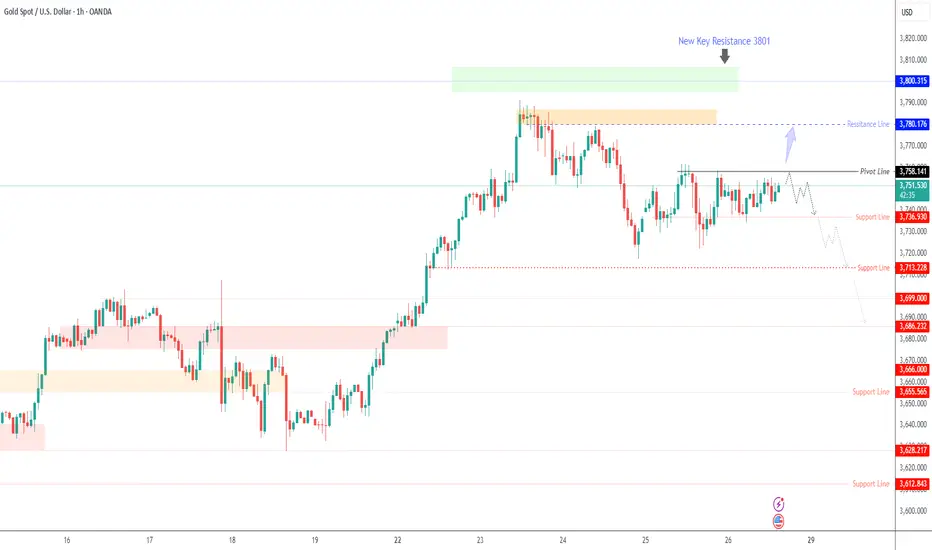
GOLD – Tariffs and PCE Data Keep Bears in Focus Below 3,758GOLD – Overview
Gold prices edged higher in early trade as President Trump’s new tariffs and rising geopolitical tensions over Russian incursions into NATO airspace boosted safe-haven demand.
ETF holdings remain at their highest levels since 2022, while investors await today’s key U.S. PCE inflation data for fresh signals on the Federal Reserve’s rate path.
Stronger U.S. GDP growth and lower jobless claims have slightly eased labor market concerns, adding to market uncertainty ahead of the release.
Technical View
Gold is attempting to stabilize below the 3,758 pivot line, keeping short-term pressure on the downside while awaiting PCE results.
Bearish Scenario:
As long as price trades below 3,758, bearish momentum targets 3,736 → 3,714 → 3,700.
Bullish Scenario:
A confirmed 15-min close above 3,758 would invalidate the bearish setup and support a push toward 3,780 → 3,801.
Key Levels
Pivot: 3,758
Resistance: 3,780 – 3,801
Support: 3,736 – 3,714 – 3,700
Trading Plan:
Gold remains bearish below 3,758, with 3,736 and 3,714 as immediate downside targets.
Today’s PCE data will decide whether price extends toward 3,700 or breaks higher toward 3,780 – 3,801.
F-XAU
Global news might have us Stalling on Gold! Chart Context (MGC Futures, H1/H4)
Price stalled out after rejecting the H4 bearish zone (3791.4–3769.9).
Yesterday’s downside move lost steam before fully reaching the deeper H4 bullish demand (3746.3–3735.2).
We’re now compressing between Daily High (3792.1) and Daily Low (3752.0).
Fundamentals:
U.S. geopolitical/military headlines (Defense Secretary Pete Hegseth ordering hundreds of generals/admirals to an urgent meeting at Quantico, Sep 30) are creating uncertainty, which could trigger safe-haven flows in gold.
Bias Going Into Friday:
Watching for liquidity sweep of yesterday’s lows (~3752/DL). If swept and reclaimed, could trigger bullish continuation.
Alternatively, a clean break & hold above yesterday’s high (~3792/DH) sets up momentum longs targeting 3812+ (previous imbalance).
No trade in the middle of the chop — patience until liquidity is taken on one side.

GOLD BULLISH BIAS|LONG|
✅XAUUSD Price forms a bullish flag above the wide demand area, showing ICT displacement. Smart Money likely drives momentum toward liquidity resting at 3,780$. Time Frame 3H.
LONG🚀
✅Like and subscribe to never miss a new idea!✅

GOLD – Dollar Strength Weighs as Market Awaits PCE DataGOLD – Overview
Gold eased in early trading as a stronger U.S. dollar weighed on prices after Fed Chair Jerome Powell struck a cautious tone on further rate cuts in his Tuesday speech.
Looking ahead, Friday’s U.S. PCE inflation data will be key—softer numbers could revive expectations for additional monetary easing and help gold reclaim recent highs.
Technical View
Gold is stabilizing below the pivot line at 3,770, keeping short-term pressure on the downside.
Bearish Scenario:
As long as price trades below 3,770, the metal is likely to continue its bearish correction toward 3,754 → 3,739.
A confirmed 15-min close below 3,739 would open the way to deeper support at 3,714.
Bullish Scenario:
A confirmed 1H close above 3,787 would invalidate the correction and signal a push toward 3,801 → 3,807.
Key Levels
Pivot: 3,770
Resistance: 3,780 – 3,800 – 3,806
Support: 3,754 – 3,739 – 3,714

Bullish bounce for the Gold?The price is falling towards the pivot and could bounce to the 1st resistance which acts as a swing high resistance.
Pivot: 3,699.30
1st Support: 3,654.40
1st Resistance: 3,784.06
Disclaimer:
The above opinions given constitute general market commentary, and do not constitute the opinion or advice of IC Markets or any form of personal or investment advice.
Any opinions, news, research, analyses, prices, other information, or links to third-party sites contained on this website are provided on an "as-is" basis, are intended only to be informative, is not an advice nor a recommendation, nor research, or a record of our trading prices, or an offer of, or solicitation for a transaction in any financial instrument and thus should not be treated as such. The information provided does not involve any specific investment objectives, financial situation and needs of any specific person who may receive it. Please be aware, that past performance is not a reliable indicator of future performance and/or results. Past Performance or Forward-looking scenarios based upon the reasonable beliefs of the third-party provider are not a guarantee of future performance. Actual results may differ materially from those anticipated in forward-looking or past performance statements. IC Markets makes no representation or warranty and assumes no liability as to the accuracy or completeness of the information provided, nor any loss arising from any investment based on a recommendation, forecast or any information supplied by any third-party.

Gold Futures – Pullback Into H4 Supply Before Drop to Demand?Price sold off strongly from 3812 resistance and is now correcting higher. On the H4, I see a bearish supply zone between 3791.4–3769.9, which aligns with prior POC acceptance around 3790. If price pulls back into this area and fails, I expect continuation lower into the H4 demand zone at 3746.3–3735.2, which also lines up with Daily Low (DL) and Weekly High (WH) liquidity markers.
Levels to Watch:
Bearish H4 Supply: 3791.4–3769.9
Bullish H4 Demand: 3746.3–3735.2
Invalidation: Break & hold above 3795 could target 3812 liquidity.
Targets: First 3746.3, extended 3735.2.
Bias: Bearish pullback scenario into supply → downside continuation.

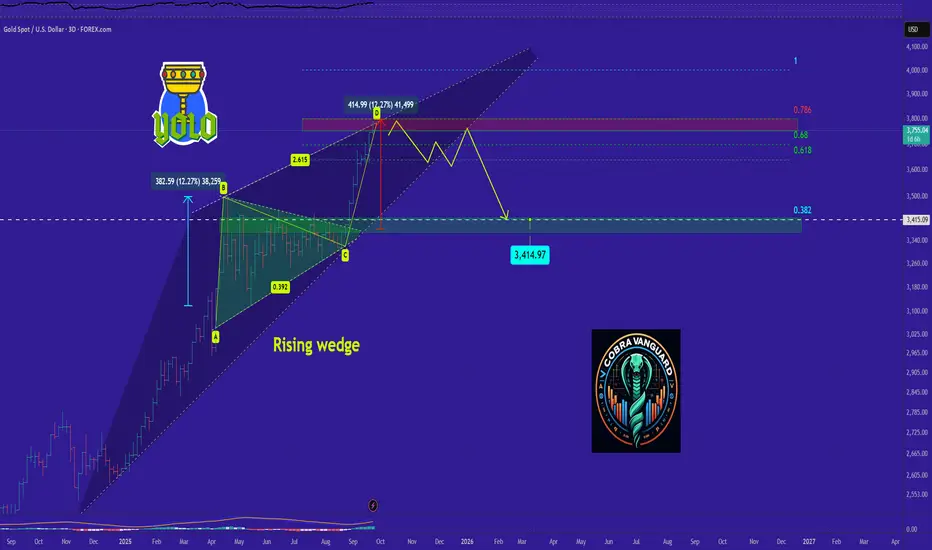
GOLD is bearish now and many Traders don't see it !!As you can see, the price is within a descending wedge, and it has reached the upper boundary of this wedge. According to technical analysis patterns, the price has closely followed the AB=CD pattern, indicating a need for a slight correction. In the coming days, the price may range within this wedge, and if the pattern breaks, the price could drop to the Fibonacci levels shown.
GOLD Free Signal! Sell!
Hello,Traders!
GOLD is trading in a strong uptrend. And it is oversold now, so as the price has formed a double top pattern, we will be expecting a bearish correction. The confirmation for the entry will be the breakout of the neckline.
------------------
Stop Loss: 3,791$
Take Profit: 3,710$
Entry: 3,754$
Time Frame: 3H
------------------
Sell!
Comment and subscribe to help us grow!
Check out other forecasts below too!
Disclosure: I am part of Trade Nation's Influencer program and receive a monthly fee for using their TradingView charts in my analysis.

Looks like we might finally get some pressure released on GoldIve been looking for price to break down. it has been on a bull run for well over a week now. and all this week it has pushed up with no pullbacks at all. Looks like we might have hit the high for the week and we could be getting a pullback from here. Waiting to see if we can break the previous Daily low for more bearish pressure.

Gold | 30min Double Top | GTradingMethodHello Traders,
I’ve entered a short position on gold based on a potential double top formation on the 30-minute chart.
🔎 Market Overview:
This pattern often signals weakening bullish momentum and potential reversal pressure. While gold has been strong recently, the short-term setup suggests an opportunity for a tactical short if the pattern confirms.
📊 Trade Plan:
Risk/Reward: 3.6
Entry: 3,757.0
Stop Loss: 3,766.6
Take Profit 1 (50%): 3,729
Take Profit 2 (50%): 3,713
🙏 Thanks for checking out my post!
Make sure to follow me to catch the next idea and please share your thoughts — I’d love to hear them.
📌 Please note:
This is not financial advice. This content is to track my trading journey and for educational purposes only.

Gold Futures — Extended After Bullish Surge, Watching 4 PullbackYesterday’s move pushed gold aggressively higher with almost no retrace, leaving a string of unfilled imbalances below. Price is now pressing into 3780 levels, just shy of the psychological 3800 handle.
Key Scenarios:
Bullish Continuation: If Asia/London hold above 3767, a squeeze into 3800–3810 is possible before any meaningful pullback.
Retracement Setup: A break under 3767 could trigger a retrace into 3743 → 3719 zone, aligning with prior resistance turned support.
Bigger Picture: Major 4H FVG remains untested below (around 3650–3660), which could act as a downside magnet later in the week.
Patience is key after such a vertical move — waiting to see if Tuesday gives us either continuation or that first retrace.

Gold | H8 Double Top | GTradingMethodHello Traders, good morning!
Gold has been pushing into new highs, but I’ve taken a small short position this morning. The reason? A potential double top is forming on the 8-hour timeframe.
Negative RSI divergence is present — price is making higher highs, while RSI is printing lower highs. This signals weakening buying momentum.
Volume on the second top is lower than the first, which adds further confluence for a possible reversal.
I am aware that this is most likely a controversial position as most people will be long gold.
However, the risk reward favors shorts at these levels and I willing to take a small position against the trend. Only time will tell.
📊 Trade Plan:
Risk/Reward: 3.6
Entry: 3,698.5
Stop Loss: 3,732.5
Take Profit 1 (50%): 3,597
Take Profit 2 (50%): 3,549.8
GTradingMethod Tip:
When trading reversal patterns, I always look for multiple layers of confluence — structure (like a double top), momentum (RSI divergence), and volume. This helps filter out weak setups.
🙏 Thanks for checking out my post!
Where do you think gold is headed today?
Please note:
This is not financial advice. This content is to track my trading journey and for educational purposes only.

XAU reverse soon On w1 chart I see the potential divergence , same on D1 chart.
I admit that we are at extreme values. If we start to correct soon, I will consider it the beginning of a bear market for gold. I assume that we are just starting to accelerate and the RSI indicator will overheat much more, and we will see 4300-4500 for gold.

Gold Futures — New Week Opens Strong After Friday RallyGold closed last week bullish after sweeping liquidity below the weekly low and snapping higher into resistance. As we open into Asian session Monday, price is testing the daily high (3719).
Key Scenarios This Week:
Bullish: If buyers hold above 3719, continuation toward 3743 (weekly fair value gap high) and potentially 3767 (ATH marker) could play out.
Bearish: A failure to hold above 3719 opens the door for retracement back toward 3700 → 3685 zone (last week’s supply area).
Opening conditions look bullish, but patience is key. Waiting to see if Asia sets the tone for continuation or if NY later in the week pulls it back.

Bullish continuation?The Gold (XAU/USD) is falling towards the pivot which aligns with the 38.2% Fibonacci retracement and could bounce to the 1st resistance.
Pivot: 3,563.40
1st Support: 3,501.76
1st Resistance: 3,706.97
Disclaimer:
The above opinions given constitute general market commentary, and do not constitute the opinion or advice of IC Markets or any form of personal or investment advice.
Any opinions, news, research, analyses, prices, other information, or links to third-party sites contained on this website are provided on an "as-is" basis, are intended only to be informative, is not an advice nor a recommendation, nor research, or a record of our trading prices, or an offer of, or solicitation for a transaction in any financial instrument and thus should not be treated as such. The information provided does not involve any specific investment objectives, financial situation and needs of any specific person who may receive it. Please be aware, that past performance is not a reliable indicator of future performance and/or results. Past Performance or Forward-looking scenarios based upon the reasonable beliefs of the third-party provider are not a guarantee of future performance. Actual results may differ materially from those anticipated in forward-looking or past performance statements. IC Markets makes no representation or warranty and assumes no liability as to the accuracy or completeness of the information provided, nor any loss arising from any investment based on a recommendation, forecast or any information supplied by any third-party.

XAUUSD Video Analysis Brief – Weekly Forecast Summary (2025)This video summarizes the key scenarios and technical outlook for Gold (XAUUSD) on the weekly timeframe, integrating both Fibonacci-based projections and macro fundamentals.
Core Setup
Gold is currently positioned near the 161.8% Fibonacci extension (~$3,276).
A breakout toward $3,500 is possible before a potential corrective move.
Scenario 1: Bullish Continuation
Gold breaks above $3,435 → rallies to $4300 → continues toward major Fibonacci targets:
TP: $4,320, which is the Fibonacci level 261.8%
Scenario 2: Correction First
Gold fails to hold above $3,435 → triggers a healthy correction to:
TP1: $2,920
TP2: $2,650
If support 161.8% level holds in the correction zone, a renewed bullish phase is expected.
Macro Alignment
Central bank gold buying (notably BRICS) supports the long-term bid.
Fed policy leaning dovish → tailwinds for gold.
Inverse correlation with DXY:
DXY below 98.95 → bullish for gold
DXY above 100 → signals correction
Effect on Altcoins
If correction is risk-on driven, capital may rotate into altcoins.
If triggered by macro stress or USD strength, alts may fall alongside gold.
This analysis offers a multi-scenario framework to navigate the next major moves in gold, with key levels to watch for traders, investors, and macro analysts alike.

Gold (XAUUSD) Weekly TF 2025Overview
This analysis outlines the structural Fibonacci confluences, scenario planning, and macro-aligned projections for Gold (XAUUSD) on the weekly timeframe. It integrates multi-layered Fibonacci extensions and retracements, mapping out key support and resistance levels, and proposes a nuanced primary scenario that includes both intermediate rallies and corrective movements.
Primary Scenario – Multi-Stage Movement Hypothesis
We anticipate that gold may initially extend higher from the current level (~$3,325) to test the 127.2% Fibonacci extension at $3,435, with the possibility of a further intermediate peak near $3,500. This level marks a psychological and technical resistance zone and could act as a temporary top.
Following this local peak, a corrective phase may unfold. This pullback could evolve into one of the two outlined correction scenarios:
1 TP Correction Scenario
Support Target: ~$2,950
Basis: 100% Fib extension confluence and prior resistance turned support
Expected Outcome: Price stabilizes at this level and resumes upward momentum
2 TP Correction Scenario
Support Target: ~$2,650
Basis: Strong historical structure + 100% Fib confluence from a broader cycle
Expected Outcome: This zone acts as a long-term demand accumulation area
Upon completion of the corrective structure, we expect gold to reinitiate its primary bullish trend.
Bullish Continuation Targets
TP1: ~$4,050 (161.8% Fibonacci extension)
TP2: ~$4,319 (261.8% Fibonacci extension)
These targets align with macroeconomic conditions, central bank accumulation trends, and long-term structural cycles.
Supporting Technicals
RSI: Holding above 50, indicating preserved bullish momentum
MACD: Positive crossover with widening histogram on weekly timeframe
Price Action: Strong support zone between $3,280–$3,300 aligning with 161.8% Fib retracement of the recent minor wave
Macro Fundamentals & Correlations
Central Bank Gold Demand: Sustained net buying by BRICS nations, particularly China and Russia, supports the structural bid on gold
Fed Policy: Market anticipates a prolonged pause or gradual rate cuts, favoring non-yielding assets like gold
DXY & US10Y Yields: Any further decline in DXY or softening yields would add tailwinds to gold
Crypto Correlation: During inflationary hedging or systemic risk periods, gold and crypto may correlate positively, especially with weakening USD
Intermarket Relationships: Gold, DXY, and TOTAL (Crypto Market Cap)
Gold vs. DXY (US Dollar Index)
Gold historically maintains an inverse correlation with DXY. A rising DXY tends to apply downward pressure on gold prices, while a falling DXY enhances gold's upside momentum.
Scenario Interactions:
If DXY breaks below 98, this could validate the bullish scenario for gold toward $3,435–$4,050.
If DXY rallies back above 100, it could trigger the correction scenarios ($2,950 or $2,650) in gold.
Gold vs. TOTAL (Crypto Market Cap)
Gold and TOTAL may show positive correlation during periods of USD weakening and global liquidity expansion.
Scenario Interactions:
If gold rallies toward $3,500 and TOTAL also breaks key resistance (e.g., $1.8T–$2T), this signals synchronized bullish risk appetite.
If gold corrects while TOTAL continues to rise, it could indicate rotation of liquidity from defensive to risk-on assets.
A simultaneous correction in both may occur if DXY strengthens aggressively or if macro shocks reduce global liquidity.
These intermarket relationships should be monitored continuously to assess the evolving macro context and validate the chosen scenario.
In the case of a gold correction toward $2,950 or $2,650, the impact on altcoins will hinge on the prevailing macroeconomic backdrop. If the correction stems from a healthy, technical rebalancing within a risk-on environment—without a concurrent surge in the U.S. dollar—it could signal a shift in capital from defensive assets like gold into more speculative plays, including altcoins. This type of capital rotation often benefits the crypto market, particularly if TOTAL (crypto market cap) holds or advances structurally. However, if the correction is caused by rising dollar strength, tightening financial conditions, or broader risk-off sentiment, altcoins may instead suffer alongside gold, as liquidity is withdrawn across the board. Therefore, the context and drivers behind gold’s correction are crucial in assessing its downstream effects on altcoin performance.
From a philosophical lens, gold's cyclical ascent and retreat mirrors the rhythm of nature and human experience—expansion, contraction, and renewal. Just as rivers carve valleys before surging toward the ocean, the market too must surrender gains to gather force. A correction in gold is not merely a financial event, but a moment of recalibration—an inhale before the next exhale of momentum. It invites reflection: whether wealth seeks refuge or ventures into risk, whether fear contracts or ambition expands. In this interplay, altcoins may inherit the restless spirit of capital in search of yield, as gold, the ancient anchor of value, briefly pauses in its timeless journey.
Conclusion
We present a multi-phased path for gold where:
An initial bullish breakout toward $3,435–$3,500 forms a short- to mid-term peak
A subsequent correction brings gold to either $2,950 or $2,650, depending on macro triggers
A renewed bull rally drives gold toward $4,050 and potentially $4,319 and beyond
This scenario reflects both the cyclical nature of market structure and the macro-fundamental backing that continues to support long-term gold strength.

GOLD – Rebound Holds Above Key 3,655 PivotGOLD – OVERVIEW
Gold rebounded in early trade after Thursday’s decline, supported by buyers despite a stronger U.S. dollar and a cautious Fed outlook. The Federal Reserve’s September meeting signaled fewer rate cuts than markets had expected, keeping sentiment mixed but overall supportive for gold.
Technical Analysis
GOLD is trying to touch the support level before the next bullish movement, which is 3639.
🔹A confirmed 15-min or 1-hour close above 3666 will strengthen the bullish continuation toward 3676 and 3686.
🔹However, a 15-min or 1-hour close below 3655 would trigger a bearish correction toward 3639.
🔹A sustained break below 3639 opens the way for deeper downside to 3628 and 3612.
Key Levels
Pivot: 3655
Resistance: 3666, 3676, 3686
Support: 3639, 3628, 3612

FRIDAY GOLD SHORT SETUP Gold Selling At Strong Resistance
Resistance Short Trade Zone
Entry 3662 / 3666
Stoploss 3618
Target 3615
Follow Us For More

XAUUSD H1 | Bearish drop offBased on the H1 chart analysis, we can see that the price has rejected off the sell entry at 3,655.23, which is a pullback resistance and could drop from this levle to the take profit.
Stop loss is at 3,672.97, whichis a pullback resistance.
Take profit is at 3,616.99, which is a pullback support that lines up with the 127.2% Fibonacci extension.
High Risk Investment Warning
Trading Forex/CFDs on margin carries a high level of risk and may not be suitable for all investors. Leverage can work against you.
Stratos Markets Limited (tradu.com ):
CFDs are complex instruments and come with a high risk of losing money rapidly due to leverage. 65% of retail investor accounts lose money when trading CFDs with this provider. You should consider whether you understand how CFDs work and whether you can afford to take the high risk of losing your money.
Stratos Europe Ltd (tradu.com ):
CFDs are complex instruments and come with a high risk of losing money rapidly due to leverage. 66% of retail investor accounts lose money when trading CFDs with this provider. You should consider whether you understand how CFDs work and whether you can afford to take the high risk of losing your money.
Stratos Global LLC (tradu.com ):
Losses can exceed deposits.
Please be advised that the information presented on TradingView is provided to Tradu (‘Company’, ‘we’) by a third-party provider (‘TFA Global Pte Ltd’). Please be reminded that you are solely responsible for the trading decisions on your account. There is a very high degree of risk involved in trading. Any information and/or content is intended entirely for research, educational and informational purposes only and does not constitute investment or consultation advice or investment strategy. The information is not tailored to the investment needs of any specific person and therefore does not involve a consideration of any of the investment objectives, financial situation or needs of any viewer that may receive it. Kindly also note that past performance is not a reliable indicator of future results. Actual results may differ materially from those anticipated in forward-looking or past performance statements. We assume no liability as to the accuracy or completeness of any of the information and/or content provided herein and the Company cannot be held responsible for any omission, mistake nor for any loss or damage including without limitation to any loss of profit which may arise from reliance on any information supplied by TFA Global Pte Ltd.
The speaker(s) is neither an employee, agent nor representative of Tradu and is therefore acting independently. The opinions given are their own, constitute general market commentary, and do not constitute the opinion or advice of Tradu or any form of personal or investment advice. Tradu neither endorses nor guarantees offerings of third-party speakers, nor is Tradu responsible for the content, veracity or opinions of third-party speakers, presenters or participants.

Gold short swing setupBearish points
Rsi divergence
Trend reversal (if it break last Higher Low)
Target should be around 50/60 fib level

Gold Futures — Bearish Momentum Building After Fed CutGold continues to show weakness after the Fed’s 25bps rate cut. Price rejected the 1H FVG overhead and is pressing down toward yesterday’s low (3660).
Key Scenarios:
Bearish Case (favored): If we break and close below yesterday’s low (D-L 3660), sellers likely push toward the weekly low (WL ~3627). That move would clean up the liquidity pool and fill the H-TF imbalance.
Bullish Case: Only if buyers defend the daily low and reclaim the 1H FVG with strength could we see price revisit 3710 (daily high).
Momentum remains on the downside, with ADX > 25 confirming trend conditions. Watching closely for the daily low sweep and possible continuation.

Dot Plot Divide: Dollar Gains, Gold Stalls The USDJPY spiked lower following the Fed’s 25 basis point cut yesterday but quickly reversed trajectory as the dot plot projections from the FOMC came in softer than markets had expected.
The updated dot plot showed a narrow majority of FOMC members anticipating two more small rate cuts in 2025, while others leaned toward just one or even none.
This potentially suggests that the Fed is not simply aligning with Trump sycophant and newly appointed FOMC board member Stephen Miran’s aggressive call for repeated 50-basis-point cuts and instead signals an element of independence.
USDJPY (left chart, 1H): The pair has carved out a sharp V-shaped reversal after its Fed-driven dip, showing strong bullish momentum. This suggests buyers remain in control unless a reversal candle (such as a bearish engulfing) forms.
XAUUSD (right chart, 4H): Gold’s rally topped out near 3,707 before pulling back more than 600 pips to 3,646. The most recent candles show shorter bodies with upper wicks — a potential sign of fading momentum and supply pressure. If this develops into a bearish continuation pattern, the channel’s border becomes the next area of focus.
