GOLD RISKY LONG|
✅GOLD is trading in a
Strong uptrend and the
Price is now making a
Local correction but a
Horizontal support level
Is ahead at 3616$ so
After the retest we will
Be expecting a local
Bullish rebound
LONG🚀
✅Like and subscribe to never miss a new idea!✅
F-XAU

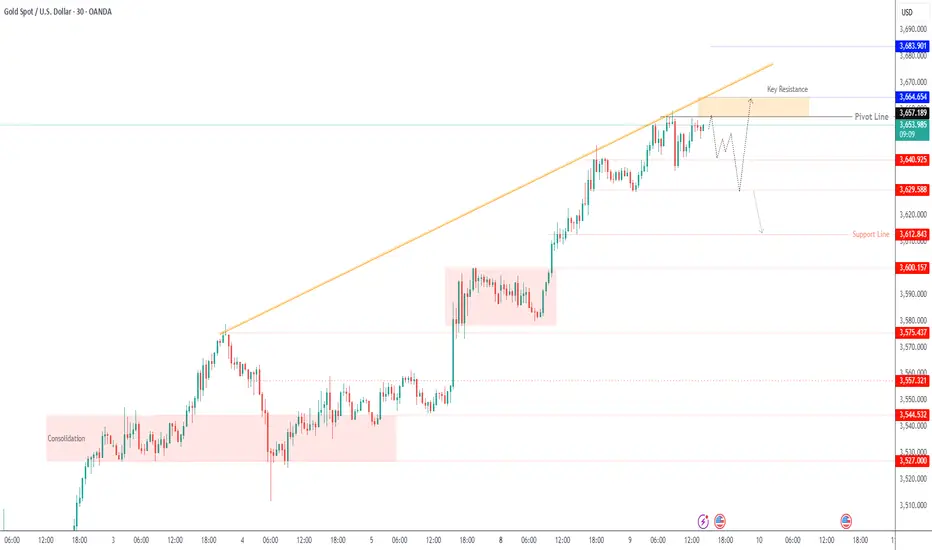
Potential bearish drop off?The Gold (XAU/USD) has reacted off the pivot and could drop to the 1st support which acts as a pullback support.
Pivot: 3,674.77
1st Support: 3,624.94
1st Resistance: 3,697.75
Disclaimer:
The above opinions given constitute general market commentary, and do not constitute the opinion or advice of IC Markets or any form of personal or investment advice.
Any opinions, news, research, analyses, prices, other information, or links to third-party sites contained on this website are provided on an "as-is" basis, are intended only to be informative, is not an advice nor a recommendation, nor research, or a record of our trading prices, or an offer of, or solicitation for a transaction in any financial instrument and thus should not be treated as such. The information provided does not involve any specific investment objectives, financial situation and needs of any specific person who may receive it. Please be aware, that past performance is not a reliable indicator of future performance and/or results. Past Performance or Forward-looking scenarios based upon the reasonable beliefs of the third-party provider are not a guarantee of future performance. Actual results may differ materially from those anticipated in forward-looking or past performance statements. IC Markets makes no representation or warranty and assumes no liability as to the accuracy or completeness of the information provided, nor any loss arising from any investment based on a recommendation, forecast or any information supplied by any third-party.

Fed Cuts Rates — Gold Reacts, Watching for Follow-Through or ReThe Fed has just delivered a 25 bps rate cut, and there’s a mixed tone in the after-move: inflation still high, jobs softening, and the dot-plot shows more cuts are expected — but with divided opinions.
On the chart, Gold spilled out of consolidation post-Fed, touched key support, and is now pressing back toward a 4H FVG (supply zone).
Scenarios:
Upside: If price pushes up toward the 4H FVG, gets rejected cleanly → potential short entry.
Downside: If that rejection holds, or support breaks, expect slide toward high timeframe FVG region in 3600s.
Trade with eyes open — volatility likely stays high. Support & resistance zones are critical here.

GOLD Will Go UP! Buy!
Hello,Traders!
GOLD is trading in a
Strong uptrend and we are
Bullish biased so as the price
Is already making a rebound
From the horizontal support
Of 3680$ a further bullish
Move up is to be expected
Buy!
Comment and subscribe to help us grow!
Check out other forecasts below too!
Disclosure: I am part of Trade Nation's Influencer program and receive a monthly fee for using their TradingView charts in my analysis.

Gold | H4 Double Top | GTradingMethodHello Traders,
Is Gold about to confirm a double top on the 4H chart?
This pattern could mark the start of a short-term correction, but I’ll only take action if my trading system confirms all the right variables.
Gold has rallied strongly, but momentum looks to be fading. A double top is forming, and with RSI divergence building, this setup has my attention.
Some of the things my system would need to confirm are:
- H4 candle to close in the entry range
- That candle must close with a specific closure rate
- RSI needs to create another divergence
- Lower volume ideally, though this may be exempted due to upcoming data events
📊 Trade Plan:
Risk/Reward: 4.4
Entry: 3 703.0
Stop Loss: 3 719.7
Take Profit 1 (50%): 3 640.4
Take Profit 2 (50%): 3 616.5
💡 GTradingMethod Tip:
When trading double tops, I project the distance from the highest point to the neckline downward to identify profit targets. This keeps my trade plan systematic and objective.
🙏 Thanks for checking out my post!
Follow me to catch the next update and share your thoughts — I’d love to hear how you’re viewing Gold right now.
📌 Please note: This is not financial advice. This content is to track my trading journey and for educational purposes only.

Gold | 30min Double Top | GTradingMethodHello Traders,
I’m watching a potential double top forming on the 3-minute timeframe. For me to confirm and take this setup, I’ll need additional signals to align before entering.
✅ Conditions before entry:
A 30-minute candle must close within the range.
That candle needs to close with a specific closure rate I require.
RSI must print another divergence to confirm weakening momentum.
📊 Trade Plan:
Risk/Reward: 3.0
Entry: 3,697.15
Stop Loss: 3,703.8
Take Profit 1 (50%): 3,681.2
Take Profit 2 (50%): 3,670.6
🙏 Thanks for checking out my post!
Follow me for the next update. Keen to hear what your predictions on gold are and if you have any questions on how I trade double tops!
📌 Please note: This is not financial advice. This content is to track my trading journey and for educational purposes only.

GOLD H1 | Bearish dropBased on the H1 chart analysis, we can see that the price has rejected off the sell entry at 3,686.33, which is a pullback resistance and could potentially drop from this level to he take profit.
Stop loss is at 3,703.51, which is a pullback resistance.
Take profit is at 3,657.45, which is a pullback support that aligns with the 61.8% Fibonacci retracement.
High Risk Investment Warning
Trading Forex/CFDs on margin carries a high level of risk and may not be suitable for all investors. Leverage can work against you.
Stratos Markets Limited (tradu.com ):
CFDs are complex instruments and come with a high risk of losing money rapidly due to leverage. 65% of retail investor accounts lose money when trading CFDs with this provider. You should consider whether you understand how CFDs work and whether you can afford to take the high risk of losing your money.
Stratos Europe Ltd (tradu.com ):
CFDs are complex instruments and come with a high risk of losing money rapidly due to leverage. 66% of retail investor accounts lose money when trading CFDs with this provider. You should consider whether you understand how CFDs work and whether you can afford to take the high risk of losing your money.
Stratos Global LLC (tradu.com ):
Losses can exceed deposits.
Please be advised that the information presented on TradingView is provided to Tradu (‘Company’, ‘we’) by a third-party provider (‘TFA Global Pte Ltd’). Please be reminded that you are solely responsible for the trading decisions on your account. There is a very high degree of risk involved in trading. Any information and/or content is intended entirely for research, educational and informational purposes only and does not constitute investment or consultation advice or investment strategy. The information is not tailored to the investment needs of any specific person and therefore does not involve a consideration of any of the investment objectives, financial situation or needs of any viewer that may receive it. Kindly also note that past performance is not a reliable indicator of future results. Actual results may differ materially from those anticipated in forward-looking or past performance statements. We assume no liability as to the accuracy or completeness of any of the information and/or content provided herein and the Company cannot be held responsible for any omission, mistake nor for any loss or damage including without limitation to any loss of profit which may arise from reliance on any information supplied by TFA Global Pte Ltd.
The speaker(s) is neither an employee, agent nor representative of Tradu and is therefore acting independently. The opinions given are their own, constitute general market commentary, and do not constitute the opinion or advice of Tradu or any form of personal or investment advice. Tradu neither endorses nor guarantees offerings of third-party speakers, nor is Tradu responsible for the content, veracity or opinions of third-party speakers, presenters or participants.

GOLD IS UNSTOPPABLE|LONG|
✅GOLD broke the key
Wide structure level around 3670$
While trading in a strong uptrend
Which reinforces our bullish bias
And I think that after the retest
Of the broken level is complete
A rebound and bullish
Continuation will follow
LONG🚀
✅Like and subscribe to never miss a new idea!✅

GOLD H1 | Bullish continuationBased on the H1 chart analysis, we could see the price fall to the buy entry at 3,655.51, which is a pullback support that lines up with the 50% Fibonacci retracement and could bounce from this level to our take profit.
Stop loss is at 3,631.24, which is a pullback support.
Take profit is at 3,684.97, which is a pullback resistance.
High Risk Investment Warning
Trading Forex/CFDs on margin carries a high level of risk and may not be suitable for all investors. Leverage can work against you.
Stratos Markets Limited (tradu.com ):
CFDs are complex instruments and come with a high risk of losing money rapidly due to leverage. 65% of retail investor accounts lose money when trading CFDs with this provider. You should consider whether you understand how CFDs work and whether you can afford to take the high risk of losing your money.
Stratos Europe Ltd (tradu.com ):
CFDs are complex instruments and come with a high risk of losing money rapidly due to leverage. 66% of retail investor accounts lose money when trading CFDs with this provider. You should consider whether you understand how CFDs work and whether you can afford to take the high risk of losing your money.
Stratos Global LLC (tradu.com ):
Losses can exceed deposits.
Please be advised that the information presented on TradingView is provided to Tradu (‘Company’, ‘we’) by a third-party provider (‘TFA Global Pte Ltd’). Please be reminded that you are solely responsible for the trading decisions on your account. There is a very high degree of risk involved in trading. Any information and/or content is intended entirely for research, educational and informational purposes only and does not constitute investment or consultation advice or investment strategy. The information is not tailored to the investment needs of any specific person and therefore does not involve a consideration of any of the investment objectives, financial situation or needs of any viewer that may receive it. Kindly also note that past performance is not a reliable indicator of future results. Actual results may differ materially from those anticipated in forward-looking or past performance statements. We assume no liability as to the accuracy or completeness of any of the information and/or content provided herein and the Company cannot be held responsible for any omission, mistake nor for any loss or damage including without limitation to any loss of profit which may arise from reliance on any information supplied by TFA Global Pte Ltd.
The speaker(s) is neither an employee, agent nor representative of Tradu and is therefore acting independently. The opinions given are their own, constitute general market commentary, and do not constitute the opinion or advice of Tradu or any form of personal or investment advice. Tradu neither endorses nor guarantees offerings of third-party speakers, nor is Tradu responsible for the content, veracity or opinions of third-party speakers, presenters or participants.

XAUUSD Pre-Cut Rates!! Will the all time high streak continue??Gold continues to show strength after breaking above the 3,676 resistance and printing a new All-Time High at 3,686. This breakout further confirms the clear uptrend structure across all timeframes, from H4 to daily. Overall, buyers remain in control, although price is currently consolidating near the highs, likely gathering momentum for the next move.
From a technical perspective, the latest candle closed above the key zone at 3,675–3,676, which has now flipped from strong resistance into dynamic support. As long as price holds above this area, the primary bias remains bullish, with potential continuation towards 3,708 and then 3,723 as the next upside targets.
On the other hand, if a deeper pullback occurs and price fails to hold above 3,656, the door opens for a retest of lower support around 3,625. However, unless there is a confirmed reversal on the lower timeframes, the broader trend still favors the upside.
🎯 Trading Plan for Today
Buy on dip at 3,656–3,660
SL: 3,625
TP1: 3,678
TP2: 3,686
TP3: 3,708
⚠️ Avoid aggressive SELL positions unless there are clear rejection signals or strong reversal patterns on lower timeframes (M15–H1).
For traders holding long positions from lower levels, consider partial take profit around TP1–TP2 while keeping some exposure for higher targets.
📌 Key Daily Zones
R3: All-Time High
R2: 3,724
R1: 3,687
Pivot: 3,675
S1: 3,637
S2: 3,601
S3: 3,586
⚠️ Notes & CTA Suggestions
Bullish momentum remains dominant, but price is trading far from major MAs, so a short-term pullback remains possible before further upside.
Watch price action around 3,675–3,656. As long as there is no close below this support, the bullish scenario stays intact.
Be cautious of volatility during the US session and use conservative lot sizing to stay protected from sudden swings.
Always adjust SL levels according to intraday volatility to avoid being taken out by temporary moves.

Gold (MGC) – Watching 3725 Key Decision Point Ahead of CPIGold surged yesterday with aggressive bullish momentum, tagging into the 3725 BFH level. Price is consolidating just beneath it as we head into Tuesday’s London and NY sessions.
Upside: Break and hold above 3725 opens the door toward 3750+.
Downside: Rejection at 3725 + breakdown through 3700 could shift structure, with targets at 3680 and 3662.
CPI & Unemployment data in the NY session may provide the catalyst.
📌 Patience until reaction confirms — 3725 is the key battleground.

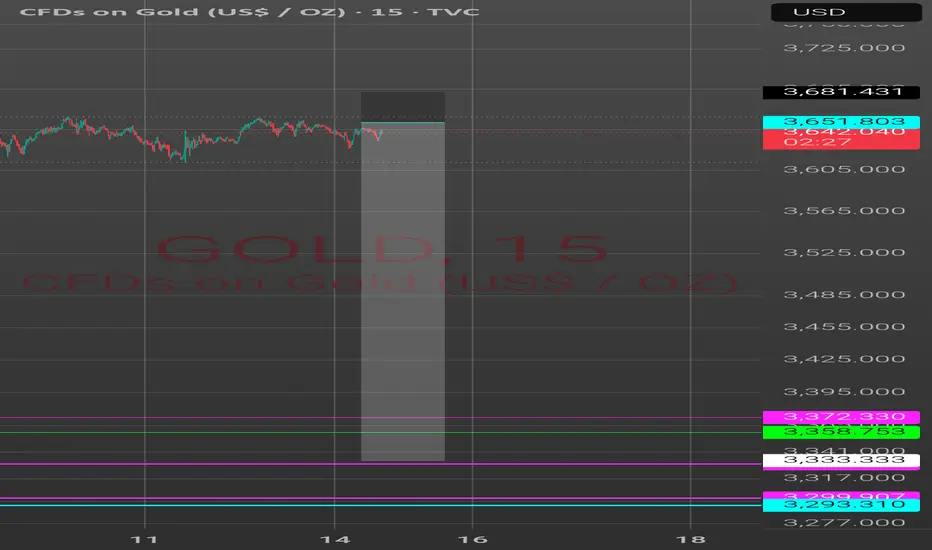
Gold Holds Near Record Highs Ahead of Fed Rate DecisionGOLD – Overview
Gold edged lower in early trade on profit-taking and a firmer dollar but continues to hover near record highs ahead of the Federal Reserve’s rate decision later this week.
Markets widely expect a rate cut, with Powell’s commentary likely to provide key guidance on inflation, labor market weakness, and potential tariff impacts.
Prices also remain supported by safe-haven demand, robust central-bank buying, and continued inflows into gold-backed ETFs.
Technical Outlook
📈 Bullish scenario: Price shows a sensitive upward bias and may retest the resistance zone around 3,657. A 15-minute close above 3,664 would confirm continuation toward 3,665 → 3,683.
📉 Bearish scenario: A reversal and 1H close below 3,628 would signal downside pressure, targeting 3,612 → 3,600.
⚖️ Range watch: Consolidation is expected between 3,628 – 3,640 until a breakout occurs.
Key Levels
Pivot: 3,640
Resistance: 3,657 – 3,665 – 3,683
Support: 3,628 – 3,612 – 3,600
Bias: Neutral inside the 3,628–3,640 range; breakout direction confirmed on a close above 3,664 or below 3,628.

Xau Short1:10 RR setup.
For TP will have alerts near price in case some event be happening in the world which would cause volatility and may push the price down to 3000
Seems like Gold wants to do liqiudity grab and then treap bulls
Gold Outlook – Short-Term Pullback, Long-Term Strength📑 Gold (XAUUSD) – Market Report
Gold has shown a strong bullish phase over recent weeks after a long consolidation. The market moved from accumulation into expansion, reflecting renewed participation by larger players. This upward momentum indicates strong capital inflows, supported by macroeconomic uncertainty and shifting investor sentiment.
Technically, price has broken out of a prolonged range and established a clear upward trajectory. Market structure suggests that buyers remain in control, though current price levels are showing signs of potential exhaustion, which could trigger short-term corrective moves before the broader trend resumes.
Fundamentally, global economic pressures continue to boost gold’s role as a safe-haven asset. Concerns over inflation, central bank policy adjustments, and currency volatility are keeping investor demand elevated. With global risk sentiment fluctuating, gold is likely to remain an attractive hedge, sustaining its medium-term bullish outlook despite short-term pullbacks.
Conclusion: Gold is in an expansion cycle, supported by both technical momentum and fundamental demand. Short-term corrections are expected, but the broader trajectory remains upward.

Gold | H4 Double Top | GTradingMethodHello Traders,
🧐 Market Overview:
Over the last 3 weeks, gold has rallied just under 10% — a massive move. While my longer-term outlook remains bullish, my system is currently flagging a potential short. On the 4-hour chart, a double top pattern is forming, signaling a possible pullback.
My system looks for rsi divergence, which is currently present. It also needs to see lower volume on the second top, also already confirmed.
My system has given the green light for opening a short. Now I am just waiting for a good entry point. Time to be patient and follow all my rules.
📊 Trade Plan:
Risk/Reward: 3.5
Entry: 3 664.5
Stop Loss: 3 691.4
Take Profit 1 (50%): 3 592
Take Profit 2 (50%): 3 551
💡 GTradingMethod Tip:
Trading is about probability. This means I need to take every single trade when my edge is available. It also means I need to follow my rules on every single trade.
🙏 Thanks for checking out my post!
Follow me for more setups and let me know — do you think gold will respect this double top or continue its bullish momentum?
📌 Disclaimer:
This is not financial advice. This content is to track my trading journey and for educational purposes only.

XAU/USD (Gold) - Trendline Breakout (US - CPI Data) (11.09.2025)The XAU/USD Pair on the M30 timeframe presents a Potential Selling Opportunity due to a recent Formation of a Trendline Breakout Pattern.
This suggests a shift in momentum towards the downside in the coming hours.
Possible Short Trade:
Entry: Consider Entering A Short Position around Trendline Of The Pattern.
Target Levels:
1st Support – 3583
2nd Support – 3546
🎁 Please hit the like button and
🎁 Leave a comment to support for My Post !
Your likes and comments are incredibly motivating and will encourage me to share more analysis with you.

Gold Stalls Ahead of CPI – Pullback Setup Loading?Gold has been aggressively bullish for the past two weeks, but yesterday showed the first signs of exhaustion. Price stalled under the daily high ($3,690), leaving liquidity below untouched.
With CPI and unemployment claims scheduled during the NY session, we may see the dollar strengthen — providing the catalyst for a deeper pullback on Gold.
Key Zones I’m watching:
Upside Liquidity: Sweep above $3,690 (D-H) could serve as a trap before reversing lower.
Downside Targets:
$3,654–$3,652 (D-L/W-H confluence)
$3,600 node
$3,530–$3,550 (H4/8H FVG rebalancing zone)
If this week is to stay bullish overall, a proper low for the week forming inside the H4/8H FVG would set the stage for continuation higher. For now, patience until price makes its move around these zones.

Gold : Neutral Between 3,640–3,657, Breakout to DecideGold – Overview
Gold hit a fresh record high at $3,659 on Tuesday, supported by weak U.S. jobs data and growing bets on Fed rate cuts. Traders now await key U.S. inflation releases – PPI on Wednesday and CPI on Thursday – which could drive the next major move.
📊 If inflation comes in hotter than expected, gold risks a sharp correction.
📊 If inflation is weaker, expectations for a 50 bps Fed rate cut could lift gold further.
Technical Outlook:
🔻 While below 3,657, price may correct toward 3,640. A 15M close below 3,640 would extend the decline to 3,629.
🔺 Stability above 3,657 on a 15M close would support further upside toward 3,665 → 3,683.
Key Levels:
Pivot: 3,657
Support: 3,640 – 3,629 – 3,612
Resistance: 3,665 – 3,683
previous idea:
Gold | H2 Double Top | GTradingMethodHello Traders 👋
🧐 Market Overview:
I’ll be honest — I’m feeling a little hesitant about entering another Gold trade. The last few setups have gone against my system more than I would like. But trading is always a game of probability — clusters of losses are part of the process.
The key is staying disciplined. Over the long run, probability is in my favour, and that’s why I have to take this trade. My system is flagging a potential double top on the H2 chart, and the so far setup aligns with my rules.
Some of the variables I look for:
- Negative rsi divergence
- decreasing volume on the second top
- Need candle to close in range to take the trade
📊 Trade Plan:
Risk/Reward: 3.7
Entry: 3666
Stop Loss: 3689
Take Profit 1 (50%): 3592
Take Profit 2 (50%): 3565
💡 GTradingMethod Tip:
Even the best systems go through losing streaks. The edge comes not from avoiding them, but from executing consistently and letting probability work itself out over time.
🙏 Thanks for checking out my post!
Make sure to follow me for more setups and share your thoughts — will this H2 double top play out, or does Gold still have momentum to push higher?
📌 Disclaimer:
This is not financial advice. This content is to track my trading journey and for educational purposes only.

Gold | H1 Head and Shoulders | GTradingMethodHello Traders 👋
We’re finally getting a clean pattern to short Gold on.
🧐 Market Overview:
The chart is showing signs of exhaustion. We already have negative RSI divergence and decreasing volume on the right shoulder — both pointing to weakening buying momentum. I’m still waiting for confirmation before fully committing, but the setup is looking solid.
📊 Trade Plan:
Risk/Reward: 4.0
Entry: 3640.77
Stop Loss: 3652.5
Take Profit 1 (50%): 3602.4
Take Profit 2 (50%): 3581.5
💡 GTradingMethod Tip:
When trading reversal patterns like head & shoulders, volume is key. A drop in volume on the right shoulder often strengthens the case for a potential move lower.
🙏 Thanks for checking out my post!
Make sure to follow me to catch the next setup and let me know what you think — will this H&S confirm, or does Gold still have room to push higher?
📌 Disclaimer:
This is not financial advice. This content is to track my trading journey and for educational purposes only.

Will weakening US labor market signal fuel gold demand?
Gold demand has risen as mounting labor market concerns drive investors toward safe havens. The BLS revised job growth down by 911k over the past year, showing only 847k jobs added versus the previously reported 1.758 mln, far weaker than the 682k consensus, signaling a clear slowdown. JPMorgan CEO Dimon noted deteriorating consumer sentiment and labor market weakness as signs of a softening US economy. However, he added that while the Fed is likely to cut rates, the impact on the broader economy may be limited.
XAUUSD continues its uptrend, consolidating near record highs. The widening gap between both EMAs indicates the potential extension of bullish momentum. If XAUUSD breaches above the resistance at 3650, the price may advance toward the psychological resistance at 3700. Conversely, if XAUUSD breaks below the support at 3580, the price could retreat toward the next support at 3500.

Gold is Finally giving a pullback! I have been looking for this move to happen for 2 weeks and they have been so aggressively bullish. If we can get a close below yesterdays high before we come into the killzone i think they will continue to drop at least till news during NY session in the morning.

Gold | 30min Head and Shoulders | GTradingMethodHello Traders!
There is a potential head and shoulders in the making.
🧐 Market Overview:
One of the key indicators I watch when trading double tops is negative RSI divergence. On the Gold chart, price has been printing higher highs while RSI has been putting in lower highs — a classic sign of weakening buying momentum.
It’s important to note: negative RSI divergence does not guarantee a correction. It’s simply one element within our robust trading system that helps us build higher-probability setups.
📊 Trade Plan:
Risk/Reward: 3.5
Entry: 3655.1
Stop Loss: 3664.7
Take Profit 1 (50%): 3624
Take Profit 2 (50%): 3614
💡 GTradingMethod Tip:
Always remember — divergence is a signal, not a certainty. Use it in confluence with structure, patterns, and risk management for the best results.
🙏 Thanks for checking out my post!
Make sure to follow me to catch the next idea and please share your thoughts — do you think this head and shoulders will play out, or is Gold still too strong?
📌 Disclaimer:
This is not financial advice. This content is to track my trading journey and for educational purposes only.
