GOLD H4 | Could the price reverse from here?XAU/USD is reacting off the sell entry at 3,382.85, which is a pullback resistance and could reverse from this level to the take profit.
Stop loss is at 3,432.37, which is a swing high resistance.
Take profit is at 3,333.65, which is a pullback support that is slightly above the 50% Fibonacci retracement.
High Risk Investment Warning
Trading Forex/CFDs on margin carries a high level of risk and may not be suitable for all investors. Leverage can work against you.
Stratos Markets Limited (tradu.com ):
CFDs are complex instruments and come with a high risk of losing money rapidly due to leverage. 65% of retail investor accounts lose money when trading CFDs with this provider. You should consider whether you understand how CFDs work and whether you can afford to take the high risk of losing your money.
Stratos Europe Ltd (tradu.com ):
CFDs are complex instruments and come with a high risk of losing money rapidly due to leverage. 66% of retail investor accounts lose money when trading CFDs with this provider. You should consider whether you understand how CFDs work and whether you can afford to take the high risk of losing your money.
Stratos Global LLC (tradu.com ):
Losses can exceed deposits.
Please be advised that the information presented on TradingView is provided to Tradu (‘Company’, ‘we’) by a third-party provider (‘TFA Global Pte Ltd’). Please be reminded that you are solely responsible for the trading decisions on your account. There is a very high degree of risk involved in trading. Any information and/or content is intended entirely for research, educational and informational purposes only and does not constitute investment or consultation advice or investment strategy. The information is not tailored to the investment needs of any specific person and therefore does not involve a consideration of any of the investment objectives, financial situation or needs of any viewer that may receive it. Kindly also note that past performance is not a reliable indicator of future results. Actual results may differ materially from those anticipated in forward-looking or past performance statements. We assume no liability as to the accuracy or completeness of any of the information and/or content provided herein and the Company cannot be held responsible for any omission, mistake nor for any loss or damage including without limitation to any loss of profit which may arise from reliance on any information supplied by TFA Global Pte Ltd.
The speaker(s) is neither an employee, agent nor representative of Tradu and is therefore acting independently. The opinions given are their own, constitute general market commentary, and do not constitute the opinion or advice of Tradu or any form of personal or investment advice. Tradu neither endorses nor guarantees offerings of third-party speakers, nor is Tradu responsible for the content, veracity or opinions of third-party speakers, presenters or participants.
F-XAU

XAU/USD Approaches Resistance – Watch 3374 CloselyGOLD Overview
Gold is currently approaching the 3374 resistance level. A 1H candle close above 3374 could trigger further upside toward the next resistance zones at 3401 and 3402.
However, if the price fails to hold above 3365 and starts to decline, this would indicate a potential bearish reversal toward the support levels at 3350 and 3333.
The next short-term move will depend on how price reacts around the 3374 zone — watch for either a confirmed breakout or rejection.
🔹 Key Technical Levels:
Pivot Line: 3365
Resistance: 3374 • 3388 • 3402
Support: 3350 • 3333
Scenarios:
🔺 Bullish: 1H close above 3374 → Targets: 3388 / 3402
🔻 Bearish: Failure to hold above 3365 → Downside toward 3350 / 3333

XAUUSD - Will Gold Continue to Rise?!Gold is trading above the EMA200 and EMA50 on the 4-hour timeframe and is trading in its medium-term ascending channel. A correction towards the demand zone would provide us with a better risk-reward buying position, and if it rises, we could consider selling it in the supply zone.
After a relatively quiet summer, the release of disappointing U.S. employment data brought a sharp shift in the gold market’s momentum, sparking a wave of optimism among Wall Street analysts. Gold ended the trading week near the short-term resistance level of $3,350—an area that, according to Kitco’s weekly survey, reflects a surge in bullish sentiment among market analysts.
This market turnaround happened rapidly. At the start of the week, gold came under selling pressure as economic data revealed that U.S. GDP grew by 3% in the second quarter. However, many economists questioned the reliability of this growth, noting its heavy dependence on volatile trade balance figures, which makes it a poor indicator of sustainable economic strength.
Midweek, another headwind emerged for gold. The Federal Reserve decided to keep interest rates unchanged, and in a press conference, Fed Chair Jerome Powell stated that no decision had been made yet regarding the September meeting. His cautious tone was captured in the statement: “We haven’t made any decisions about September.”
However, these remarks quickly lost weight. Just two days later, U.S. employment data significantly missed expectations, dramatically reshaping the outlook for monetary policy.
According to the Bureau of Labor Statistics, the U.S. economy added only 73,000 jobs in July—a number far below forecasts. Moreover, previous job gains for May and June were sharply revised downward, with a total of 258,000 jobs removed from earlier estimates. The updated figures showed only 14,000 jobs added in June and 19,000 in May. This disappointing data alone was enough to reignite expectations of a rate cut at the September meeting—an outcome that immediately boosted gold demand.
David Morrison, adopting a cautious stance, emphasized that although the jobs data favored gold, the market remains stuck in a narrow trading range, with limited evidence of a sustained short-term rally.
He explained, “Despite the significant gains last week, gold is still consolidating within a defined range. To break above $3,400 again—and more importantly, to hold it during any retracements—we’ll likely need a period of corrective volatility and price consolidation.”
Morrison also pointed out that the recent gold price rally was driven more by a sharp decline in the U.S. dollar than by internal factors within the gold market. “This sudden spike was largely a result of the unexpected downturn in the dollar following the release of the weak non-farm payroll report (NFP),” he said.
He further warned against over-interpreting a single data point: “Yes, the report has increased the odds of a rate cut in September, but we’re dealing with highly volatile data. It’s just one number—alongside a negative revision—and it can’t alone dictate the course of monetary policy.”
Meanwhile, investment bank Citi has raised its three-month gold price forecast from $3,300 to $3,500 per ounce. The expected trading range has also shifted—from $3,100–$3,500 to $3,300–$3,600.
According to Citi, this upward revision is driven by weak U.S. economic growth, heightened concerns about inflation linked to tariffs, and a weakening U.S. dollar. The bank also cited poor labor market data in Q2 and growing doubts about the credibility of the Federal Reserve and the Bureau of Labor Statistics. At the same time, investment demand for gold remains strong, with steady central bank purchases helping to sustain the metal’s favorable market position.

Will growing fears of a labor market reignite demand for gold?
Gold staged a rebound as markets reacted to weaker US labor data and escalating trade tensions. Despite a solid Q2 GDP reading of 3.0% QoQ (prev. -0.5%, cons. 2.3%), the disappointing July NFP figure of 73k (prev. 140k, cons. 110k) raised fresh concerns about labor market softness. Meanwhile, recession risks were further fueled by President Trump’s approval of sweeping new tariffs—reaching up to 41%—targeting key non-aligned trade partners, intensifying fears of tariff-induced economic drag.
XAUUSD briefly broke below the 3300 support but rebounded, climbing back above both EMAs. The price is consolidating within the 3300–3440 range, indicating a sideways trend. If XAUUSD breaks below both EMAs and the 3300 support, the price could retreat further toward 3245. Conversely, if XAUUSD holds above both EMAs, the price may gain upside traction toward the 3500 high.

XAUUSD 4Hour TF - August 3rd,2025🟦 XAUUSD 4H Analysis Long Idea
📅 August 3rd, 2025
🔹 Top-Down Trend Bias:
• Monthly – Bullish
• Weekly – Bullish
• Daily – Bullish
• 4H – Bullish
Price has broken out of a consolidation, confirming short term bullish momentum in alignment with the higher timeframes. We’re now watching how price reacts on a potential retest of the key $3,320 structure.
🔍 Key Level: $3,320
This former resistance now acts as a critical support zone. How price reacts here will determine short-term direction.
✅ Scenario A: Bullish Continuation
Clean retest of $3,320–$3,335
1.Look for bullish confirmation: wick rejections, bullish engulfing, or lower timeframe structure shift
Target 1: $3,395
Target 2: $3,450
This setup aligns with the overall bullish bias. We have ideal R:R with a clear invalidation to exit on if $3,320 fails as support.
⚠️ Scenario B: Bearish Rejection
1.Failure to hold $3,320 = potential trap breakout
2.Look for structure below $3,320 + bearish conviction
Target: $3,225 support zone
Only valid if $3,320 flips to resistance and confirms structure shift.
🧠 Final Notes
• Let price confirm the setup
• Structure > emotion
• Both scenarios are valid, but only with confirmation

What to trade if you can't trust jobs data? U.S. President Donald Trump has dismissed the head of the Bureau of Labor Statistics (BLS), reportedly in response to jobs figures he disagreed with.
This raises concerns about the integrity of government-reported economic data, especially ahead of the next key Non-Farm Payrolls (NFP) release on September 5.
This upcoming report also includes the BLS’s annual revision, adjusting past job growth figures from April 2024 through March 2025. Goldman Sachs “estimate a downward revision on the order of 550,000 to 950,000 jobs—or a reduction of 45,000 to 80,000 jobs per month over the April 2024 to March 2025 period.”
Given macro uncertainty and signs of distrust in U.S. economic data, the bid for gold may persist.
Gold has rebounded sharply in recent sessions, breaking a short-term downtrend and climbing back above the 3,360 level. Price has now retraced more than 50.0% of the July 24–31 selloff. The pair may be Short-term bullish, if price holds above 3,310.
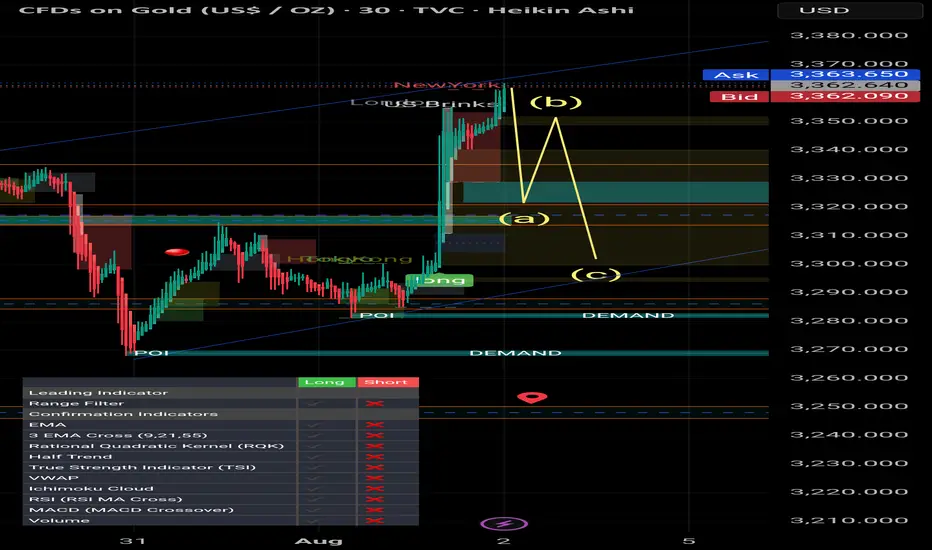
Smart Money / Price Action 5min scalping road map# 📈 ABC Pattern Explained for TradingView (Smart Money / Price Action)
The **ABC pattern** is a 3-leg corrective move in market structure, commonly used in price action, Elliott Wave, and Smart Money trading. It's mainly used to identify **pullbacks** or **correction zones** before a continuation of the main trend.
---
## 🔹 Structure of the ABC Pattern:
- **Point A**: The beginning of the move — often the end of a strong impulsive wave.
- **Point B**: The first retracement or pullback from Point A.
- **Point C**: The second corrective move that often goes beyond A, forming the completion of the correction phase.
The ABC legs can be:
- **A to B**: Impulsive or corrective.
- **B to C**: Generally a counter-trend retracement.
---
## 🔸 How to Identify on Chart:
1. **Find a strong trend** (uptrend or downtrend).
2. **Look for the first correction** — mark it as Point A to B.
3. **Next wave** that attempts to continue the trend but fails — mark the end as Point C.
4. **Use Fibonacci tools** to measure:
- **B retracement of A** (typically 50%–78.6%)
- **C extension** of AB (typically 127.2%–161.8%)
---
## 🔧 How to Draw on TradingView:
> You can use the `Trend-Based Fib Extension` tool or draw manually using the `Path` or `ABC pattern` tool.
### Step-by-Step:
1. Select the `ABC Pattern` tool from the **left toolbar** under “Prediction and Measurement Tools”.
2. Click on **Point A** (3320$).
3. Click on **Point B** (3350$).
4. Click on **Point C** (final corrective wave 3300$ ).
5. TradingView will automatically plot the shape with labels.
---
## 🧠 Pro Tips:
- Look for **liquidity sweep** or **order blocks** near Point C.
- Entry opportunity is often **after C**, targeting a **continuation** of the main trend.
- ABC is often part of **larger structures** like **complex pullbacks** or **smart money retracements**.
---
## ✅ Example Use:
- **Buy Scenario**:
- Strong uptrend → Price drops from A to B (retracement).
- Then price rises to C, failing to break above A → Possible new higher low formed.
- Enter long if price breaks above Point B again.
- **Sell Scenario**:
- Strong downtrend → A to B is a pullback.
- C attempts new high, fails → short entry after break of B.
---
## 📌 Settings Tip for Mobile Users:
- Zoom in for better point control.
- Use “Lock” feature to prevent accidental move.
- Customize color and label visibility in the style tab.
---
## 🔍 Keywords:
`ABC Pattern`, `Elliott Correction`, `Smart Money`, `Liquidity Grab`, `Break of Structure`, `Trend Continuation`, `Price Action Trading`, `Market Structure`
---
XAUUSD Technical AnalysisTechnical Analysis – Symmetrical Triangle with Retest
Current Market Situation
The chart shows a symmetrical triangle pattern, which is a continuation pattern often followed by strong directional movement.
The price has broken below the triangle, signaling a potential bearish move.
Currently, the price is in the retest phase of the broken triangle, which is an important area to confirm the bearish trend before continuing downward.
Key Zones
Retest Zone (Pullback): Located between current price and 3,374, which is a strong resistance area.
Targets (TP):
TP1: 3,322.97
TP2: 3,285.87
TP3: 3,262.59
Possible Scenarios
✅ Bearish Scenario (Preferred):
If the price holds below the retest zone, we expect a continuation to the downside towards:
Target 1: 3,322.97
Target 2: 3,285.87
Target 3: 3,262.59
⚠ Bullish Scenario (Alternative):
A daily close above 3,374 will invalidate the bearish scenario and may trigger a reversal.
Conclusion
The market shows a strong technical indication of a bearish continuation after confirming the retest.
Any daily close above 3,374 would cancel the bearish scenario.
It is recommended to monitor price action closely in the retest zone for confirmation before entering trades.

GOLD CORRECTION AHEAD|SHORT|
✅GOLD is going up now
But a strong resistance level is ahead at 3377$
Thus I am expecting a pullback
And a move down towards the target of 3352$
SHORT🔥
✅Like and subscribe to never miss a new idea!✅
Disclosure: I am part of Trade Nation's Influencer program and receive a monthly fee for using their TradingView charts in my analysis.

$BTC x $GOLDCRYPTOCAP:BTC , the largest store of value after TVC:GOLD and NASDAQ:XAG , historically follows TVC:GOLD movements!
2025 looks set to be epic for #Bitcoin

XAUUSD - Daily | More Consolidation??Gold is back in the upper range of this consolidation zone. You can see the high of the range is 3430, and the low is 3240 roughly.
Bulls:
Gold is pulling back into an Inverted FVG. If the price is bullish, then we should clear the gap with ease. Gold has just eliminated 4 days' worth of choppy bearish price action. Look for gold to give clear signs to enter a buy.
**A new daily candle should appear, creating a new FVG showing buyers are winning
Bears:
So with that said... If Gold fails to remain bullish after Friday's (Aug 1st) 700-pip jump, then the iFVG may have the price react bearishly. Watch for gold to give a clear sign of rejection before entering a sell
**Price may drop to cover Friday's gap. Doesn't mean it's bearish

GOLD Short From Resistance! Sell!
Hello, Traders!
GOLD surged up sharply
On Friday and is already
Retesting the horizontal
Resistance of 3377$
From where we will be
Expecting a local pullback
On Monday as Gold
Is locally overbought
Sell!
Comment and subscribe to help us grow!
Check out other forecasts below too!
Disclosure: I am part of Trade Nation's Influencer program and receive a monthly fee for using their TradingView charts in my analysis.

Gold Slips After Powell Speech Below 3320 Bearish Pressure BuildGOLD Overview
Market Context:
Gold declined from the 3333 level, as anticipated in yesterday’s analysis, ahead of Fed Chair Powell’s speech. Powell reiterated that it is still too early for rate cuts, citing persistently high inflation, which supported the U.S. dollar and pressured gold.
Technical Outlook:
As long as gold trades below the 3320–3310 zone, the bearish momentum is expected to continue, with the next target at 3285. A confirmed break and stability below 3285 could open the way toward 3255.
To regain bullish traction, the price must stabilize above 3320.
Support Levels: 3285 • 3255
Resistance Levels: 3333 • 3349


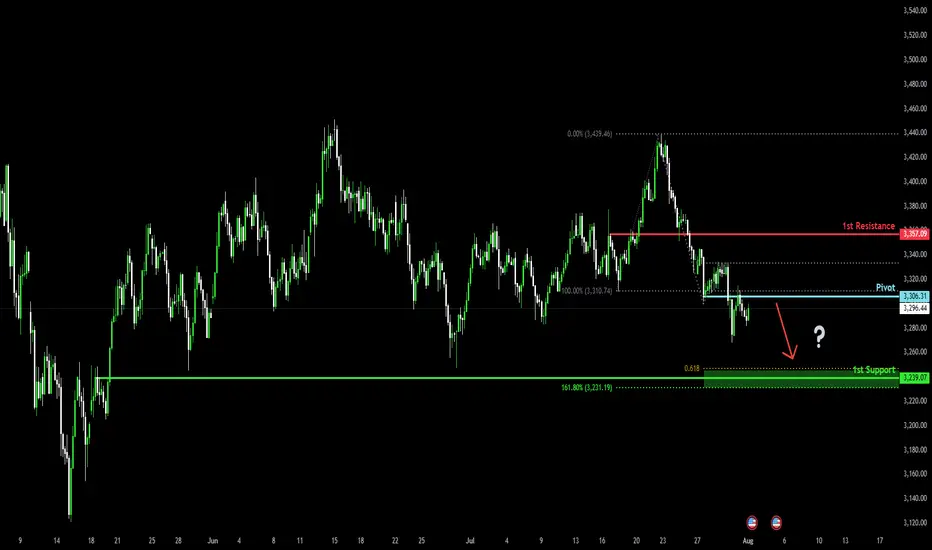
Potential bearish drop?The Gold (XAU/USD) has reacted off the pivot and could drop to the 1st support.
Pivot: 3,306.31
1st Support: 3,239.07
1st Resistance: 3,357.09
Risk Warning:
Trading Forex and CFDs carries a high level of risk to your capital and you should only trade with money you can afford to lose. Trading Forex and CFDs may not be suitable for all investors, so please ensure that you fully understand the risks involved and seek independent advice if necessary.
Disclaimer:
The above opinions given constitute general market commentary, and do not constitute the opinion or advice of IC Markets or any form of personal or investment advice.
Any opinions, news, research, analyses, prices, other information, or links to third-party sites contained on this website are provided on an "as-is" basis, are intended only to be informative, is not an advice nor a recommendation, nor research, or a record of our trading prices, or an offer of, or solicitation for a transaction in any financial instrument and thus should not be treated as such. The information provided does not involve any specific investment objectives, financial situation and needs of any specific person who may receive it. Please be aware, that past performance is not a reliable indicator of future performance and/or results. Past Performance or Forward-looking scenarios based upon the reasonable beliefs of the third-party provider are not a guarantee of future performance. Actual results may differ materially from those anticipated in forward-looking or past performance statements. IC Markets makes no representation or warranty and assumes no liability as to the accuracy or completeness of the information provided, nor any loss arising from any investment based on a recommendation, forecast or any information supplied by any third-party.
XAU/USD (Gold) - Triangle Breakout (1.08.2025)The XAU/USD Pair on the M30 timeframe presents a Potential Selling Opportunity due to a recent Formation of a Triangle Breakout Pattern. This suggests a shift in momentum towards the downside in the coming hours.
Possible Short Trade:
Entry: Consider Entering A Short Position around Trendline Of The Pattern.
Target Levels:
1st Support – 3249
2nd Support – 3225
🎁 Please hit the like button and
🎁 Leave a comment to support for My Post !
Your likes and comments are incredibly motivating and will encourage me to share more analysis with you.
Best Regards, KABHI_TA_TRADING
Thank you.
Disclosure: I am part of Trade Nation's Influencer program and receive a monthly fee for using their TradingView charts in my analysis.

GOLD Local Short! Sell!
Hello,Traders!
GOLD made a retest
Of the horizontal resistance
Of 3313$ and we are already
Seeing a bearish reaction and
We will be expecting a further
Bearish move down
Sell!
Comment and subscribe to help us grow!
Check out other forecasts below too!
Disclosure: I am part of Trade Nation's Influencer program and receive a monthly fee for using their TradingView charts in my analysis.

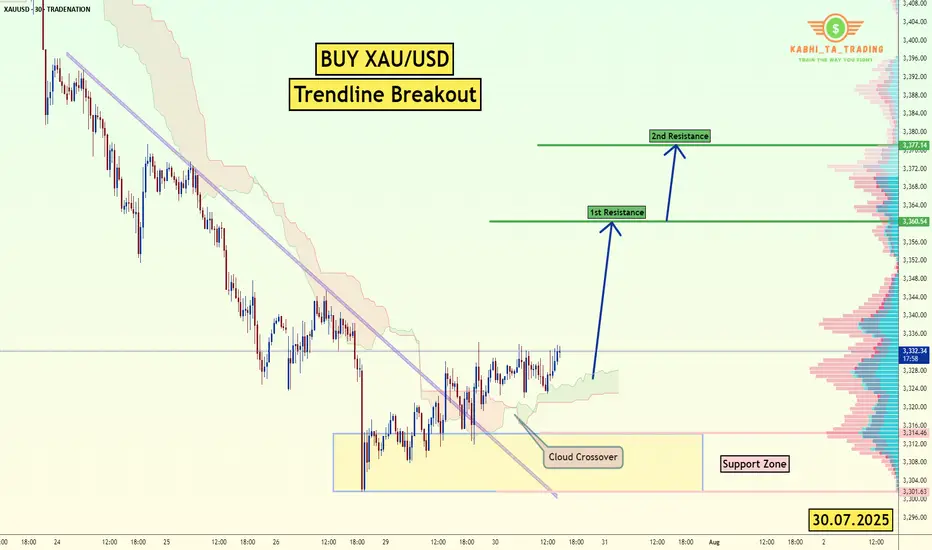
XAU/USD Trendline Breakout (30.07.2025)The XAU/USD pair on the M30 timeframe presents a Potential Buying Opportunity due to a recent Formation of a Trendline Breakout Pattern. This suggests a shift in momentum towards the upside and a higher likelihood of further advances in the coming hours.
Possible Long Trade:
Entry: Consider Entering A Long Position around Trendline Of The Pattern.
Target Levels:
1st Resistance – 3360
2nd Resistance – 3377
🎁 Please hit the like button and
🎁 Leave a comment to support for My Post !
Your likes and comments are incredibly motivating and will encourage me to share more analysis with you.
Best Regards, KABHI_TA_TRADING
Thank you.
Disclosure: I am part of Trade Nation's Influencer program and receive a monthly fee for using their TradingView charts in my analysis.
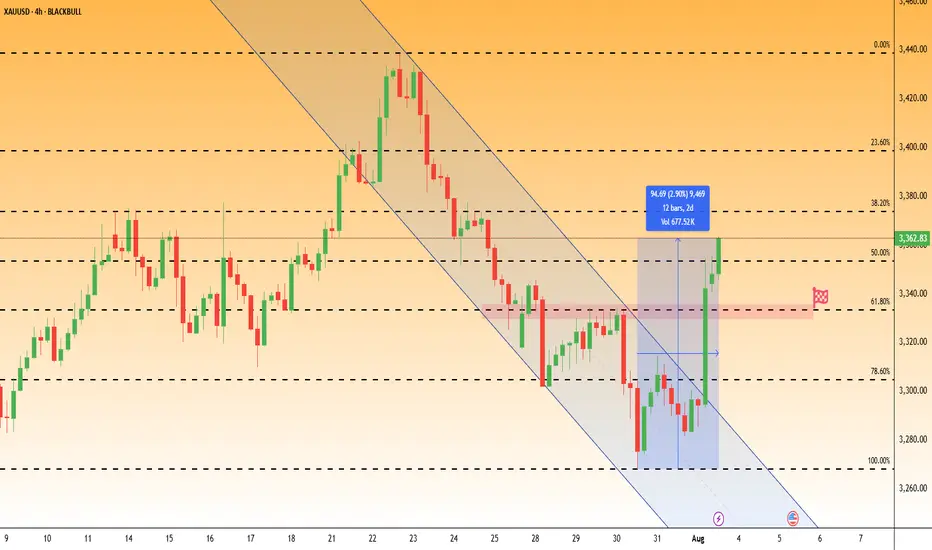
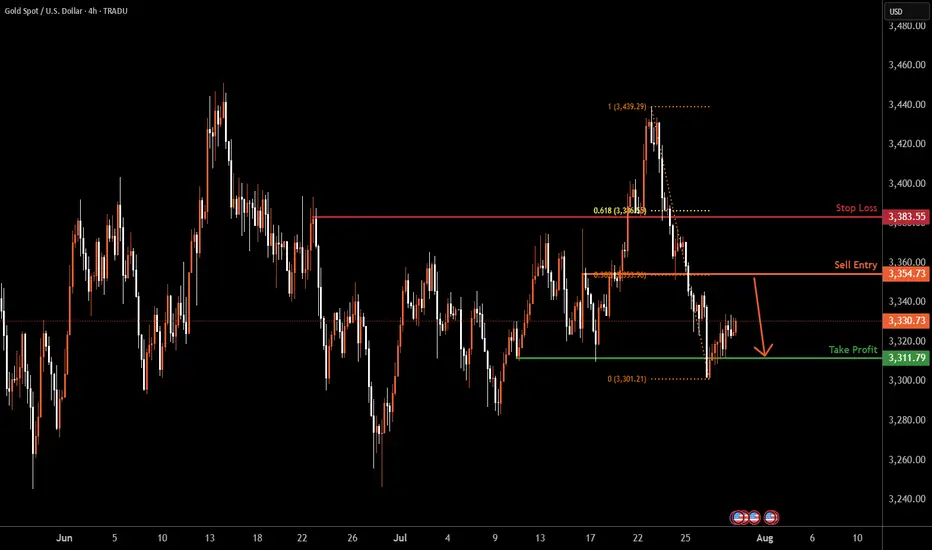
XAUUSD H4 | Heading into pullback resistanceBased on the H4 chart analysis, the price is rising towards the sell entry, which is a pullback resistance that lines up with the 38.2% Fibonacci retracement and could drop to the take profit.
Sell entry is at 3,354.73, which is a pullback resistance that aligns with the 38.2% Fibonacci retracement.
Stop loss is at 3,383.55, which is a pullback resistance that is slightly below the 61.8% Fibonacci retracement.
Take profit is at 3,311.79, which is a multi-swing low support.
High Risk Investment Warning
Trading Forex/CFDs on margin carries a high level of risk and may not be suitable for all investors. Leverage can work against you.
Stratos Markets Limited (tradu.com ):
CFDs are complex instruments and come with a high risk of losing money rapidly due to leverage. 65% of retail investor accounts lose money when trading CFDs with this provider. You should consider whether you understand how CFDs work and whether you can afford to take the high risk of losing your money.
Stratos Europe Ltd (tradu.com ):
CFDs are complex instruments and come with a high risk of losing money rapidly due to leverage. 66% of retail investor accounts lose money when trading CFDs with this provider. You should consider whether you understand how CFDs work and whether you can afford to take the high risk of losing your money.
Stratos Global LLC (tradu.com ):
Losses can exceed deposits.
Please be advised that the information presented on TradingView is provided to Tradu (‘Company’, ‘we’) by a third-party provider (‘TFA Global Pte Ltd’). Please be reminded that you are solely responsible for the trading decisions on your account. There is a very high degree of risk involved in trading. Any information and/or content is intended entirely for research, educational and informational purposes only and does not constitute investment or consultation advice or investment strategy. The information is not tailored to the investment needs of any specific person and therefore does not involve a consideration of any of the investment objectives, financial situation or needs of any viewer that may receive it. Kindly also note that past performance is not a reliable indicator of future results. Actual results may differ materially from those anticipated in forward-looking or past performance statements. We assume no liability as to the accuracy or completeness of any of the information and/or content provided herein and the Company cannot be held responsible for any omission, mistake nor for any loss or damage including without limitation to any loss of profit which may arise from reliance on any information supplied by TFA Global Pte Ltd.
The speaker(s) is neither an employee, agent nor representative of Tradu and is therefore acting independently. The opinions given are their own, constitute general market commentary, and do not constitute the opinion or advice of Tradu or any form of personal or investment advice. Tradu neither endorses nor guarantees offerings of third-party speakers, nor is Tradu responsible for the content, veracity or opinions of third-party speakers, presenters or participants.
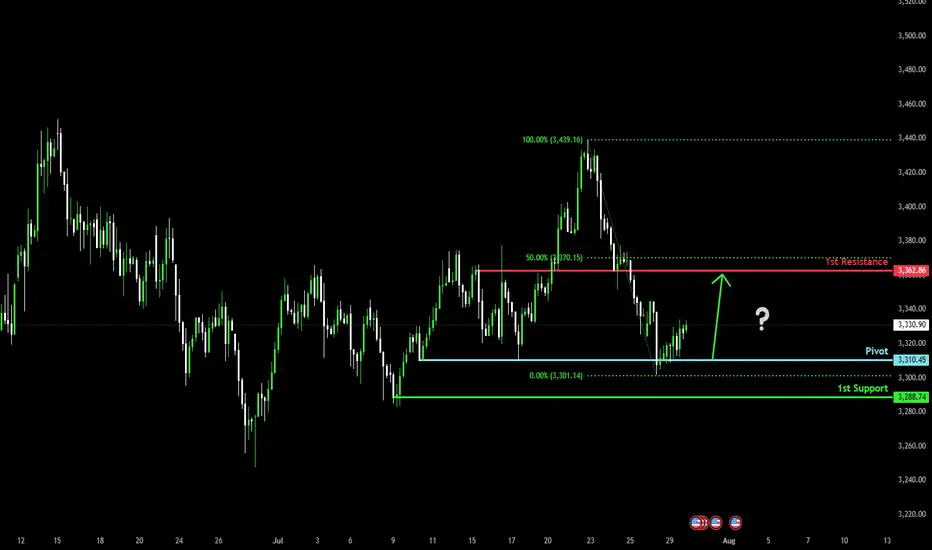
Bullish bounce off?The Gold (XAU/USD) has bounced off the pivot, which acts as a multi-swing low support and could rise to the 1st resistance, which is slightly below the 50% Fibonacci retracement.
Pivot: 3,310.45
1st Support: 3,288.74
1st Resistance: 3,362.86
Risk Warning:
Trading Forex and CFDs carries a high level of risk to your capital and you should only trade with money you can afford to lose. Trading Forex and CFDs may not be suitable for all investors, so please ensure that you fully understand the risks involved and seek independent advice if necessary.
Disclaimer:
The above opinions given constitute general market commentary, and do not constitute the opinion or advice of IC Markets or any form of personal or investment advice.
Any opinions, news, research, analyses, prices, other information, or links to third-party sites contained on this website are provided on an "as-is" basis, are intended only to be informative, is not an advice nor a recommendation, nor research, or a record of our trading prices, or an offer of, or solicitation for a transaction in any financial instrument and thus should not be treated as such. The information provided does not involve any specific investment objectives, financial situation and needs of any specific person who may receive it. Please be aware, that past performance is not a reliable indicator of future performance and/or results. Past Performance or Forward-looking scenarios based upon the reasonable beliefs of the third-party provider are not a guarantee of future performance. Actual results may differ materially from those anticipated in forward-looking or past performance statements. IC Markets makes no representation or warranty and assumes no liability as to the accuracy or completeness of the information provided, nor any loss arising from any investment based on a recommendation, forecast or any information supplied by any third-party.
GOLD BEARISH BIAS|SHORT|
✅GOLD broke the rising
Support line which is now
A resistance and the price
Is retesting the line now so
We are locally bearish biased
And we will be expecting a
Local move down
SHORT🔥
✅Like and subscribe to never miss a new idea!✅
Disclosure: I am part of Trade Nation's Influencer program and receive a monthly fee for using their TradingView charts in my analysis.

GOLD Slips as Dollar Gains on Trade Deal – Bearish Below 3349
Gold Pares Gains as USD Strengthens on Trade Deal Ahead of Fed
Gold gave up early gains, pressured by a stronger U.S. dollar after the announcement of the US–EU trade agreement.
Meanwhile, attention shifts to upcoming U.S.–China negotiations later today, as both sides aim to extend the current trade truce and avoid new tariffs.
Investors are also closely watching the Federal Reserve’s policy decision on Wednesday, seeking signals on future interest rate moves.
TECHNICAL OUTLOOK:
Gold maintains a bearish trend while trading below 3349, with potential downside toward 3320.
A 1H candle close below 3320 – 3312 would confirm extended bearish pressure targeting 3285, driven in part by ongoing geopolitical risks.
⚠️ To shift back to a bullish structure, the price must stabilize above 3349.
Key Levels:
• Support: 3320 – 3285 – 3256
• Resistance: 3365 – 3375

Gold major trendline3 Bull points
RSI div
Major trendline
and hoping to reversal trend 30min timeframe very soon...
Buy stop order
RRR 1:2
Hold for 3430 for more gain but manage your risk
