BTC Big Direction is Sell Side At Time BTC move is consolidation Not Found Clear up and Down Move ,Wait for Clear Move for BUY side in GREEN Line & SELL side for a RED Line
Fairvaluegap

ETHUSD Sell Pressure Current Price Goes up and hits the Sell Order Block for a Bearish and also have a Resistance Point, after these Done Price Come Back to Sell at Consolidation 2935.66 to 2917.91 point . When Price will Close the 2916.61 Price Then Price Should be Clear and Quickly Goes Down at 2773.21 Near About. Now Lets see what they Does.

Gold Struggling at Higher Volume Area For Bullish SideFriday Night Gold Closed at High Volume Area as per (Fixed Volume Range) Price Hit the Order Block Point at 4510.000 and its Come Back to Up Side, also 3rd Conformation is Touch the trend-Line and Most important is Normal Volume is Goes to Down-Side its Mean Price Move to Buying Side ,But One More Conformation Need Price Closing required Above at 4535.033 Area. Now lets see What Gold does.

An Exhaustive Analysis of Financial Market GapsAn Exhaustive Analysis of Financial Market Gaps: Mechanics, Psychology, and Advanced Trading Applications
● Part I: The Foundational Architecture of Price Gaps
The study of financial markets is, in essence, the study of price action. While much of this action is continuous, with transactions creating a seamless flow of data, there are moments of abrupt discontinuity that appear on price charts as voids or empty spaces. These phenomena, known as price gaps, are not mere charting curiosities; they are powerful signals that reveal profound shifts in the equilibrium between supply and demand, offering a unique window into market psychology and future price direction. Understanding the architecture of these gaps—their definition, their classification, and the complex web of factors that cause their formation—is a prerequisite for any sophisticated market participant seeking to interpret and navigate market dynamics effectively.
• Section 1: Defining the Phenomenon
At its most fundamental level, a price gap represents a range of prices at which no trades have occurred. This visual discontinuity on a price chart signifies a sudden and significant jump in an asset's price, where the opening price of one trading period is markedly different from the closing price of the preceding period.
• 1.1. The Anatomy of a Price Gap: Visual and Technical Definitions
A price gap, also referred to as a "window" in Japanese Candlestick charting, is a term used to describe a discontinuation in a price chart. Visually, it appears as an empty space between two consecutive trading periods, most commonly observed on daily bar or candlestick charts. The formation of a gap indicates that the market's perception of an asset's value has changed so dramatically that it bypasses a range of prices entirely.
• 1.2. A Taxonomy of Gap Formations: Full vs. Partial Gaps
Not all gaps are created equal in their structure or implications. This distinction gives rise to two main categories:
Partial Gap: Occurs when the opening price of the current session is higher or lower than the previous session's close, but still falls within the trading range (high and low) of that previous session.
Full Gap: Occurs when the opening price is completely outside the prior day's entire trading range.
• Section 2: The Genesis of Gaps: Causal Factors and Market Dynamics
Price gaps are the tangible result of a confluence of fundamental, technical, and market microstructure factors.
• 2.1. Fundamental Catalysts
Corporate Earnings Reports: Quarterly earnings reports are the most regular and potent catalysts for individual stocks.
Major News Events: Mergers, acquisitions, product launches, or regulatory changes.
Macroeconomic Data: GDP figures, CPI inflation reports, and interest rate decisions.
• 2.2. Technical Precursors
Support and Resistance Breakouts: A gap through a well-established level is a particularly powerful technical event.
Chart Pattern Completion: Gaps frequently serve as the confirmation signal for patterns like the cup and handle or head and shoulders.
Algorithmic Trading: Automated systems can exacerbate gaps when specific technical conditions are met.
● Part II: A Comprehensive Typology of Market Gaps
The ability to correctly classify a price gap is the most critical step in its analysis. Different types of gaps have vastly different implications for future price action.
• Section 3: The Four Archetypal Gaps: A Deep Dive
• 3.1. The Common Gap (or Trading/Area Gap)
Common Gaps are typically small in magnitude and characterized by normal or below-average trading volume. They usually appear within a sideways trading range and tend to be "filled" relatively quickly, often within a few days.
• 3.2. The Breakaway Gap (or Power Gap)
Signifies a decisive and forceful end to a period of consolidation.
Volume: Must be accompanied by a massive surge in trading volume (ideally 50% or more above the 50-day average).
Significance: Low probability of being filled in the near term; the gap area often transforms into a new support or resistance level.
• 3.3. The Runaway Gap (or Continuation/Measuring Gap)
Occurs in the middle of a well-established trend and signals that the prevailing momentum is strong. It is often driven by "FOMO" (Fear of Missing Out).
• 3.4. The Exhaustion Gap
Occurs near the end of a mature trend. The single most important feature is climactic trading volume . This represents the peak of emotional intensity, often followed by a rapid reversal and a high likelihood of the gap being filled.
• Section 4: Advanced and Specialized Gap Patterns
• 4.1. The Island Reversal
A distinctive and highly reliable chart pattern where a cluster of price bars is isolated by gaps on both sides. It represents a dramatic shift in market sentiment and is one of the strongest reversal signals in technical analysis.
• 4.2. Fair Value Gaps (FVG) and Liquidity Voids
An institutional perspective identifying market inefficiencies. An FVG is a three-candle pattern where the wick of the first and third candle do not overlap. Unlike breakaway gaps, FVGs are viewed as "magnets" that price will likely return to in order to rebalance liquidity.
● Part III: The Human Element and Empirical Realities
• Section 5: The Behavioral Science of Gaps
Irrational Exuberance: Drives bullish exhaustion gaps where optimism overrides fundamentals.
Panic and Capitulation: Drives downside exhaustion gaps at the end of a downtrend.
Herd Behavior: Amplifies price shocks as traders follow the collective crowd, often leading to initial overreactions.
"Breakaway, Runaway, and Exhaustion gaps are foundational technical formations rooted in crowd psychology and trend lifecycle stages. Conversely, the Fair Value Gap (FVG) is an institutional metric designed to identify price inefficiencies. While analytically distinct, these frameworks often converge within the same price action event, providing a dual perspective on market dynamics."
• Section 6: Statistical Analysis of the "Gap Fill"
The popular adage that "all gaps get filled" is an oversimplification.
Common/Exhaustion Gaps: Fill probability of 75-90%.
Breakaway Gaps: Fill probability of 35-65%.
Volume Impact: Gaps on low volume are 85% likely to fill within two sessions.
● Part IV: Application and Strategy
• Section 7: Strategic Frameworks for Gap Trading
Momentum-Based ("Gap and Go"): Trading with the gap. Best for Breakaway and Runaway gaps.
Mean-Reversion ("Fading the Gap"): Trading against the gap. Best for Common and Exhaustion gaps.
• Section 8: The Indispensable Role of Confirmation
Volume Spread Analysis: High volume validates breakaway gaps; climactic volume confirms exhaustion.
Momentum Oscillators (RSI, MACD): Identify divergences that suggest a gap might be exhausting rather than continuing.
Volatility Indicators (ATR): Used to set intelligent stop-losses based on the asset's specific character.
• Section 9: Advanced Risk Management
The single greatest danger in holding positions overnight is Gap Risk—the risk that price opens far beyond a pre-set stop-loss, causing significant slippage.
To manage this risk:
Avoid known catalysts (earnings).
Reduce position size during high-volatility weeks.
Use protective options (hedging).
● Part V: A Cross-Market Perspective
• Section 10: Comparative Gap Analysis Across Asset Classes
Equities: Daily gaps due to session closures; earnings are the primary driver.
Forex: Weekday gaps are rare; weekend gaps are the primary focus.
Commodities: Sensitive to supply shocks and interplay between global exchanges (CME vs LME).
Cryptocurrencies: Spot markets are 24/7 (no gaps), but CME Bitcoin Futures Gaps act as powerful price magnets with high fill rates.
● Part VI: Synthesis and Concluding Insights
• Section 11: Integrating Gap Analysis into a Holistic Market Framework
Effective gap analysis requires that:
Diagnosis Precedes Treatment: Classify the gap before selecting a strategy.
Volume is the Arbiter of Truth: It is the physical manifestation of market conviction.
Analysis is Probabilistic: There are no certainties, only shifts in likelihood based on context.
The study of price gaps remains one of the most compelling disciplines in financial markets, offering a record of collective emotion and a lens into market discovery.

BTC 30m Partial FVG Tap, Lower Imbalance Fill Setup📝 Description
BTC on M30 just made a shallow tap into the upper FVG, followed by immediate hesitation. With only a partial fill completed, it’s reasonable to expect price to seek the lower FVG for a more complete imbalance fill before any meaningful continuation.
________________________________________
📈 Signal / Analysis
Primary Bias: Short-term pullback while below 89,000–89,100
Short Setup (Reactive):
• Entry (Sell): 88,800
• Stop Loss: Above 89,00
• TP1: 88,600
• TP2: 88,340
• TP3: 87,915 (30M FVG midline)
________________________________________
🎯 ICT & SMC Notes
• Price tapped 30M FVG in premium
• HTF FVG H4/H1 overhead caps upside
• No clean CHOCH + BOS for bullish continuation
• RSI flattening → momentum exhaustion
• Liquidity draw sitting below recent lows
________________________________________
🧩 Summary
This looks like impulse and pause then retrace. As long as BTC stays below 89k, odds favor a pullback to 88.4k and 87.9k. Acceptance above premium invalidates the short and opens room higher.
________________________________________
🌍 Fundamental Notes / Sentiment
With markets still headline-sensitive and liquidity tight, quick rotations around key levels are favored. Trade the reaction at FVGs and keep risk tight.
________________________________________
⚠️ Risk Disclosure
Trading involves substantial risk and may result in capital loss. This analysis is for educational purposes only and does not constitute financial advice. Always apply proper risk management, predefined stop-loss levels, and disciplined position sizing aligned with your trading plan.

Bitcoin - Can we hit the target at $91.000 This BTC technical analysis shows that Bitcoin is currently in a waiting phase. Price is trading around $87,500 and continues to move within a clearly defined range. Although a recent bounce has occurred, there is still a lack of a convincing impulse to define the next larger move. As a result, liquidity and fair value gaps remain the primary guiding factors.
4h bullish FVG
Within the bullish 4-hour FVG, a significant amount of liquidity is still present. This makes the zone around $86,000 to $86,500 an interesting area for a potential retest. As long as this liquidity has not been fully collected, there remains a strong possibility that BTC revisits this region. A deeper test of this FVG could actually provide a stronger foundation for a subsequent upward move.
4h bearish FVG
On the upside, the 4-hour bearish FVG forms a clear and strong resistance. This zone around $91,000 to $92,000 serves as the first logical target for a bounce originating from the lower range. There is substantial supply and prior rejection in this area, making a reaction highly likely. Only a convincing breakout would allow Bitcoin to shift focus toward higher price levels.
FInal thoughts
In summary, Bitcoin remains technically neutral to slightly bullish as long as the bullish 4-hour FVG continues to hold. The market appears to be gathering liquidity before committing to a direction. This BTC technical analysis emphasizes that patience is essential, as it first needs to become clear whether BTC will collect liquidity on the downside or move directly toward the bearish FVG for another test.


GOLD Buy Near at POI Now at time gold have a selling pressure price is 4508.235 But its will be come Down at 4464.833 round about +-, and that point have a clear Order Block , Fixed Volume Range that mean Showing Clear BUY Pressure also we another conformation is 3rd Time Trend-Line Touch and Volume at time Time is Down. Now let's see what gold does.

SOLUSDT 4hr – Trade idea Price is currently trading inside a range after a strong impulsive move down.
We are seeing multiple fair value gaps below and above, indicating unfinished business on both sides.
Context
Overall structure remains bearish
Price is consolidating near local support
Liquidity has been swept to the downside
Bullish idea
If price holds this support and reclaims the local fair value gap, a move towards the higher timeframe imbalance becomes likely.
Bearish idea
Failure to hold this area could lead to a continuation into the lower fair value gap, completing the downside move.
Are you expecting a range expansion up or further downside first?
MrC

GOLD Again Buy OpperunityGold excite Point of interest area (POI) , where have Major POI ,Valid order block and also FVG , trend-line 3rd touch , Liquated Area and Fixed Volume Range

GOOGL low resistance liquidity run to ATHI think this GOOGL 24 hour chart has a great set up to take us back to All-time high.
We got the formation of a bullish fair value gap today.
We have relative highs sitting at 321.31.
Most definitely a low resistance run on liquidity at 332.98.
There was a gap on the weekly timeframe that got filled, and we got a bounce out of it two weeks in a row, and this would be the third week of a bounce .
The only thing that could disrupt this move up, is that there is a bearish weekly Fair value gap that needs to get broken through.
We clear that and it could be smooth sailing.

GBPUSD 1H Buy Direction , Find Buy Entry Now at this time Price Moving at 1.33950 , Price Struggling to move Down Possible at 1.33704 where have Fibonacci GOLDEN ZONE Area ,1H Order Block that , up side Trend-Line also showing Clear Buy Direction But one more you must to be know 1.33566 is SUPPORT Area May be Possible hit and goes down and hits ALL SL Because this is a Liquated area and then Price GOES UP a BUY Side ,these all possible points where you want to BUY

Order Block Rejection Toward Liquidity TargetsThis 4-hour USD/JPY chart shows a recent bearish shift after price rejected an identified Order Block and partially filled a Fair Value Gap (FVG) before continuing downward. The broader context includes a previously broken descending channel and a current retracement into a supply zone, suggesting bearish continuation. The chart highlights a clean inefficiency zone (FVG) serving as a potential mitigation point, from which sellers appear to be stepping in. Price is currently trading around 155.20, with projected downside continuation toward two marked liquidity levels.
Targets
1st Target: 154.058
2nd Target: 152.999

Bitcoin - Can it reclaim $89.000?Bitcoin (BTC) is currently trading in a crucial zone after the recent decline, positioned between a bullish 4-hour FVG around the lower $85,000 region and a 4-hour bearish FVG just below resistance. This BTC technical analysis focuses on whether Bitcoin can reclaim the lost trendline and the associated FVG, or whether the market instead opts for a deeper correction.
Bullish 4H FVG
The bullish 4-hour FVG around approximately $85,500 is holding for now as an important support level. From this zone, BTC recently initiated a modest bounce, indicating that buying interest is still present. As long as price continues to close above this FVG, there remains technical room for a larger recovery move toward the higher resistance zones.
Bearish Scenario
The bearish scenario centers on a rejection within the 4-hour bearish FVG that aligns with the previously broken ascending trendline. If BTC only revisits this area as a retest and is subsequently sold off, it would confirm that former support has turned into resistance. In that case, lower prices become likely again, with potential targets below the recent lows and deeper into the $80,000 range.
Bullish Scenario
The bullish scenario requires a convincing reclaim of both the trendline and the 4-hour bearish FVG above it. If BTC manages to close above this cluster and then successfully retest it as new support, market sentiment would shift back in favor of the bulls. In that case, BTC would likely revisit the recent highs near the major resistance zone. This BTC technical analysis therefore emphasizes that the reaction around the converging trendline and FVG will be decisive for the next larger move.
Conclusion
BTC is currently at an important crossroads between a still-holding bullish 4-hour FVG around $85,500 and a critical 4-hour bearish FVG at the broken trendline. A rejection at the upper levels increases the probability of further downside, while a clear reclaim of both the trendline and the FVG would open the door for a retest of the highs.

TOTAL MARKET CAP – HTF Context / LTF PlanPrice is currently trading inside the 4H bullish order block.
This zone previously acted as strong demand and is now being respected again.
At the moment, price is still inside a no-trade zone
Liquidity is being built and structure is not yet confirmed.
Bias: cautiously bullish
Plan: patience → confirmation → execution
What I’m waiting for:
A clear AMD sequence
(Accumulation → Manipulation → Distribution)
Ideally:
Short-term sweep into the lower part of the 4H OB
Reaction + displacement to the upside
Market Structure Shift (MSS) on lower timeframes
Optional confluence:
1H / 15m FVG tap
Strong bullish candle close with volume expansion
Invalidation:
Clean breakdown and acceptance below the 4H bullish OB
Failure to reclaim internal structure after a sweep
If AMD plays out correctly, this area offers a high R:R long opportunity targeting:
Internal range highs
Higher timeframe imbalance
Potential continuation towards previous highs
Until then: no FOMO, no early entries.
Let price come to us.
MrC

Bitcoin - Can the ascending triangle be broken?Introduction
Bitcoin is currently consolidating within a well-defined structure after weeks of volatile movement. Despite several failed attempts to break higher, the market continues to compress just beneath a major resistance zone. This type of tightening price action often signals a larger move approaching, as liquidity begins to build on both sides of the range. The chart highlights two key elements that will likely determine BTC’s next direction: the ascending triangle formation and the liquidity level resting below current price. Understanding how price reacts to these areas will be essential for anticipating the next significant impulse.
Ascending Triangle
BTC is forming an ascending triangle pattern, characterized by rising lows meeting a relatively horizontal zone of resistance. This resistance band, highlighted on the chart, has repeatedly capped upward attempts. Each time BTC pushes into the zone, it is met with selling pressure, but the higher lows reveal that buyers are steadily gaining ground. This pattern typically suggests accumulation and a potential bullish breakout once enough pressure builds.
If BTC can break above the upper boundary of this triangle with strength and volume, the move would likely target higher liquidity pools above recent highs. Such a breakout often leads to an impulsive leg upward, as trapped short positions are forced to cover and momentum buyers join in. For now, the ascending trendline remains a key structural support that defines the bullish side of this pattern.
Liquidity Level
Below the current range lies a clear liquidity zone, created by a cluster of equal lows and untested downside levels. This area is marked on the chart and represents where stop-loss orders and resting liquidity are likely positioned. Markets often revisit such zones before making a decisive breakout, particularly in triangle structures where liquidity builds on both sides.
A sweep of this liquidity, combined with a tap into the ascending trendline, would be a textbook setup for buyers to step back in. If BTC dips into this zone and rebounds strongly, it would further strengthen the market structure and increase the likelihood that the eventual breakout takes place to the upside. However, if this liquidity level fails and price breaks below the trendline, the bullish structure would be invalidated, opening the door for a deeper move down.
Final Thoughts
BTC is approaching a decision point, with price tightening inside an ascending triangle while liquidity pools gather below. As long as the ascending trendline continues to act as support, the market maintains a bullish bias, and a breakout above the resistance zone becomes increasingly likely. Still, a liquidity sweep to the downside before any major rally remains a strong possibility. Traders should pay close attention to how BTC reacts if it dips into the liquidity zone, as this response will reveal whether buyers are prepared to defend the structure. A clean breakout above the resistance band would confirm the next bullish leg, while a breakdown below the ascending trendline would signal weakness and shift the outlook.

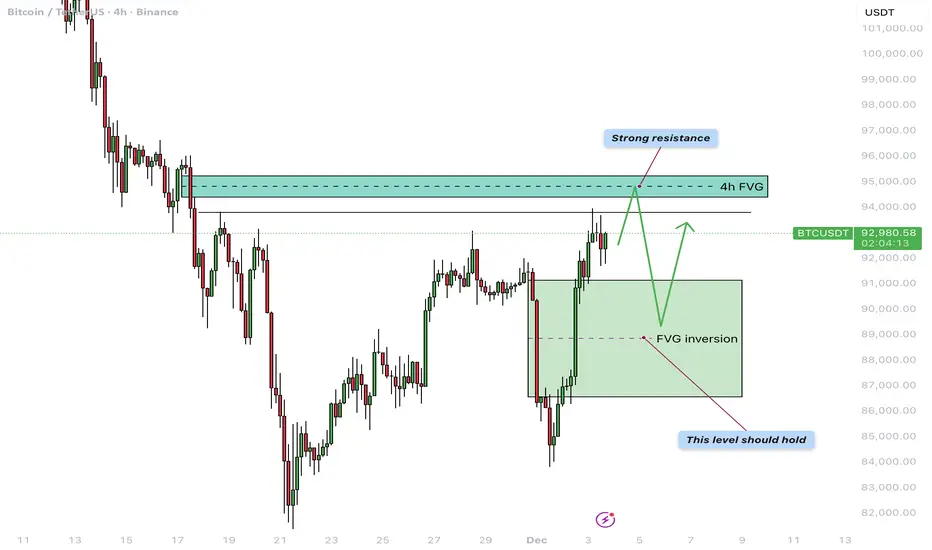
Bitcoin - $95.000 before a correction?Bitcoin finds itself at an important turning point once again after a sharp decline followed by a strong recovery. In this update, we will cover the reaction to the previous 4H bearish FVG, the newly formed 4H FVG inversion acting as support, the next resistance level around 95,000 dollars, and the recent liquidity sweep.
4H Bearish FVG Inversion
Two days ago, BTC made a strong downward move that reversed a large part of the earlier rally and collected deep liquidity beneath local lows. During this drop, a clear 4H bearish FVG was formed, acting as a supply zone. Yesterday, however, BTC reclaimed this entire FVG with conviction: the price broke through it and closed multiple candles above the zone. This shift flips the area from supply into demand, meaning the former bearish FVG has now transformed into a 4H FVG inversion. The green box on the chart now represents the primary support zone, ideally holding during any pullback.
4H Bearish FVG Around $95,000
Above the current price lies the next 4H bearish FVG around roughly 95,000 dollars, aligning with a previous consolidation and distribution phase. This region acts as strong resistance and is the next logical magnet for the ongoing recovery move. As long as the FVG inversion beneath price holds, it is reasonable to expect BTC to gradually move toward the 95k area. A clear reaction is likely once this zone is reached—ranging from a brief rejection and sideways consolidation to a potentially larger reversal if sellers become aggressive again.
Liquidity Sweep
Recently, BTC briefly pushed above a local high and pulled back immediately afterward, creating a clear liquidity sweep on the chart. This move wiped out the stops of late shorts as well as breakout longs but did not yet lead to immediate continuation to the upside. After such a sweep, the question becomes whether the market can gather enough buyers to fuel the next impulse toward the higher FVG, or whether price will first drop back toward the inversion support to gather liquidity there. The reaction at current levels will therefore provide important insight into short-term direction.
Conclusion
Because of today’s liquidity sweep, a direct correction from the current price is very possible, especially if short-term traders take profit after the strong bounce. However, the base scenario remains that BTC could still make one more push upward toward the 4H bearish FVG around 95,000 dollars, where a more significant reaction is expected. Such a move would fit perfectly within a structure where resistance is tested first, followed by a pullback to retest the new inversion support—confirming whether the recent reversal has real strength behind it.
-------------------------
Thanks for your support. If you enjoyed this analysis, make sure to follow me so you don't miss the next one. And if you found it helpful, feel free to drop a like 👍 and leave a comment 💬, I’d love to hear your thoughts!
Bitcoin - Can the bulls break resistance?Bitcoin continues to stagnate after a strong sell-off. Market structure remains weak, and trading volume is declining as price keeps moving sideways within a tight range. Traders are uncertain about the next move, and both bulls and bears currently lack conviction. Overall sentiment is cool, with most attention focused on nearby resistance zones. Many eyes are on how BTC reacts to the current consolidation area.
4H Bearish FVG
Just above the current price lies a clear bearish 4-hour Fair Value Gap (FVG). This zone now acts as strong resistance. When BTC retests this area, a rejection is the most likely scenario. Only a breakout with strong volume would give bulls something to lean on. As long as this FVG holds, further downside remains the path of least resistance.
1H Timeframe
The 1-hour timeframe shows ongoing consolidation and repeated struggles with the local 1H bearish FVG. Every attempt to break through this area is immediately rejected. As a result, the probability of BTC breaking to the downside increases, which would allow the market to collect the liquidity resting below. Bears are expected to keep defending this zone until the market breaks through with conviction. Consolidation may continue as long as the support level holds, but the underlying downside risk remains significant.
Conclusion
BTC remains technically pressured as long as there is no convincing breakout above the 4H FVG. The current range is vulnerable to a downward break, especially with weak volume and persistent resistance structures. Traders would be wise to wait for clearer signals or a new trend on higher timeframes before committing to a direction.

EURUSD - Waiting on the direction!Introduction
EURUSD is currently trading in a very technical zone where price is positioned between two significant daily fair value gaps. These opposing imbalances—one bearish and one bullish—are acting as major directional barriers. As long as price remains contained between them, the pair is effectively trapped in a compression phase, awaiting a decisive breakout. The next clear move will likely arise when either the upper or lower FVG gives way, allowing the market to target the liquidity zones that lie beyond these imbalances.
Daily Bearish FVG
Above current price sits the daily bearish fair value gap, which is acting as a strong resistance area. If EURUSD manages to break through this upper FVG with conviction, it would indicate that buyers have reclaimed control. A clean break above this zone would open the path toward the liquidity area located at the top of the chart. This region is where a large cluster of stop orders and resting buy-side liquidity is likely positioned. A move into this area would be a natural target as price seeks to rebalance inefficiencies and tap into the liquidity pool above previous highs.
Daily Bullish FVG
Below the current range lies the daily bullish fair value gap, functioning as a major support zone. If EURUSD breaks below this lower FVG, it would signal a shift in momentum back to the downside. Such a move would send price toward the liquidity zone at the bottom, where sell-side liquidity rests beneath prior lows. This would align with typical market behavior in a bearish continuation—first taking out inefficiencies, then reaching into the liquidity pools that form below structural lows.
Conclusion
EURUSD is currently confined between two major daily FVG levels, creating a tightly compressed structure where the next breakout will dictate direction. Until price decisively breaks either the bearish FVG above or the bullish FVG below, the pair remains in a waiting phase. The eventual breach of one of these imbalances will determine whether EURUSD hunts liquidity at the top or at the bottom, making this a critical moment for directional clarity in the market.

Bitcoin - Approaching the Make or Break ZoneBitcoin continues to bleed lower after multiple liquidity sweeps, and the decline is beginning to compress into a more controlled down move. The chart shows a clear shift in sentiment after the all time high sweep, then another daily sweep that helped close both the daily and 4H imbalance. Since losing the mid range zone and treating it as resistance, the market has been trending toward the next major area of interest.
Consolidation Structure
The structure is currently defined by a clean series of lower highs combined with sharp impulsive down legs. These moves are driven by liquidity grabs followed by displacement, which fits the narrative of a market hunting demand. The previously supportive gray zone has now flipped into resistance, confirming that the current trend remains heavy until a deeper demand zone is reached.
Key Support Zone and Expectations
The most important area beneath price sits around the seventy two thousand to seventy five thousand range, which is the closest meaningful support left on the higher time frame. This zone has been untested since the last major accumulation phase, and as long as price reaches it with a clean move, the reaction can form the base for a bullish leg. If this zone fails to hold, the next meaningful support sits deeper, and the downside extension could accelerate before any recovery starts.
Bullish Scenario
If Bitcoin reaches the seventy two thousand to seventy five thousand range and prints a clear rejection with displacement back upward, the market can set the foundation for a strong bullish bounce. Ideally, we see a final liquidity sweep beneath that range, followed by a sharp market structure shift on the lower time frames. That would open the door for a sustained recovery toward the mid range inefficiencies left behind during the selloff.
Bearish Scenario
If the key zone does not hold, the current support gives way and the market moves into a much deeper discount. That would shift the bias toward continuation lower, targeting untouched liquidity pools further down. In this scenario, any attempt to bounce would likely be corrective rather than the start of a true reversal.
Conclusion
I expect Bitcoin to deliver a meaningful bullish bounce once the seventy two thousand to seventy five thousand zone is tapped, as long as the level holds cleanly. If it fails, the decline continues into a deeper support, but the higher time frame idea remains that the next strong reaction will come from that region. Until then, patience is key while the market completes the move into higher time frame demand.
___________________________________
Thanks for your support!
If you found this idea helpful or learned something new, drop a like 👍 and leave a comment, I’d love to hear your thoughts! 🚀

Bitcoin - Relief rally is imminent!Introduction
Bitcoin (BTC) has shown strong downward pressure over the past several days, yet it is beginning to display early signs of stabilization within key higher-timeframe fair value gap zones. Even though the current market structure remains bearish, several technical elements are aligning that suggest the potential for a relief rally. With multiple patterns and liquidity levels converging, the market may be preparing for a temporary upside correction before determining its next major direction.
Weekly FVG
On the weekly timeframe, BTC recently tapped into the weekly fair value gap and filled roughly fifty percent of this imbalance. This partial fill often indicates that the market is collecting liquidity before initiating a larger move. As a result, this weekly FVG acts as a strong demand zone where buyers tend to become active again, offering an area where price often stabilizes, even if only temporarily. The reaction here suggests that BTC may be forming a short-term base.
Daily FVG
On the daily timeframe, another fair value gap is present, and it aligns almost perfectly with the weekly zone. Above current price action lies a clear descending trendline, which is likely to act as resistance on any upward push. The combination of the daily FVG and the downward trendline creates a technically significant decision point. If BTC reaches this area, it may face renewed selling pressure, making this zone crucial for determining whether the market can extend higher or whether the downtrend will reassert itself.
4H Timeframe
On the 4-hour chart, BTC has formed a falling wedge, a pattern that is typically considered bullish. Initially, price broke downward out of the wedge, which seemed like a continuation of weakness. However, BTC quickly moved back into the structure, signaling a fake-out. This type of movement often occurs when liquidity is collected beneath the pattern before a reversal begins. The return into the wedge strengthens the case for a short-term upward correction, suggesting that buyers may be gaining traction.
Relief Rally
The first zone to watch lies just above the current price level, where a 4-hour bearish FVG overlaps with the descending trendline. This confluence is likely to act as immediate resistance, making an initial rejection from this level highly plausible. After a potential rejection, price may revisit the bullish 4-hour FVG below, where buyers are expected to step in again. From this supportive zone, BTC could attempt to break through the descending trendline and continue higher toward the upper 4-hour bearish FVG around the 98,000-dollar region. This serves as a logical target for a relief rally, should momentum continue to build.
Conclusion
BTC is currently positioned within an important higher-timeframe demand zone, strengthened by the overlap of both the weekly and daily FVGs. Although the broader market structure remains bearish, the fake-out within the falling wedge on the 4-hour chart signals that a relief rally may be developing. The immediate resistance above price will provide the first major test. If Bitcoin finds renewed momentum from the bullish 4-hour FVG and successfully breaks the descending trendline, an upward move toward 98,000 dollars becomes increasingly realistic. For now, BTC appears to be setting the stage for a corrective bounce, with key levels offering clear guidance on how this scenario could unfold.

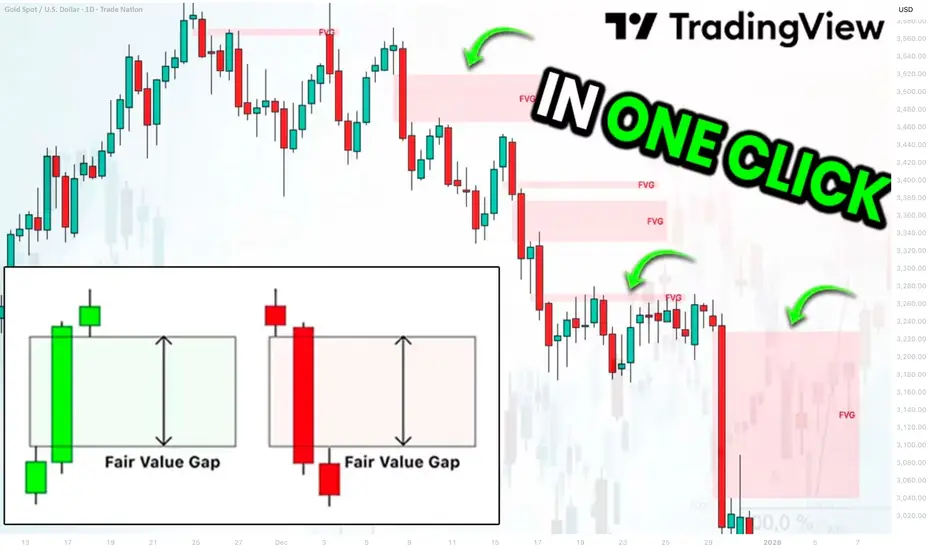
Best Free Fair Value Gap FVG Technical Indicator on TradingView
This free indicator accurately identifies Fair Value Gaps FVG on any market.
It is available on TradingView and it is very easy to set it up.
In this article, I will show you how to use this indicator and how to find a fair value gap easy in one click.
Let's start with my definition of a fair value gap because it is different from trader to trader.
FVG is a sudden, sharp price move that happens so fast that it leaves behind a price zone where very little trading actually occurred.
Because this zone saw almost no trading, it creates an imbalance .
Such a move is usually created by a large candle.
A candle with a big body and almost no wicks.
Among classic Japanese candlesticks, there is one such a candle.
It is called Marubozu.
Here are bullish and bearish structures of that candle.
A green one represents extremely strong bullish momentum. The price opened at the low of the period and closed at the high of the period. There were no pullbacks ; buyers were in complete control from the opening bell to the close.
Its bearish variation has the same logic.
The price opened at the high of the period and closed at the low of the period, with a very little trading activity within.
Our technical indicator will look for such a candle.
The indicator that we will use is called "All Candlestick Patterns".
In the settings of this indicator, we should select Marubozu White (bullish candle) and Marubozu Black (bearish candle).
After we click "OK", the indicator will immediately start working.
The indicator will show valid and significant Fair Value Gaps FVG on any time frame and any trading instrument.
Like any other indicator, it will miss some Fair Value Gaps, but while you are learning to identify them, it will help you to spot the most important ones.
❤️Please, support my work with like, thank you!❤️
I am part of Trade Nation's Influencer program and receive a monthly fee for using their TradingView charts in my analysis.
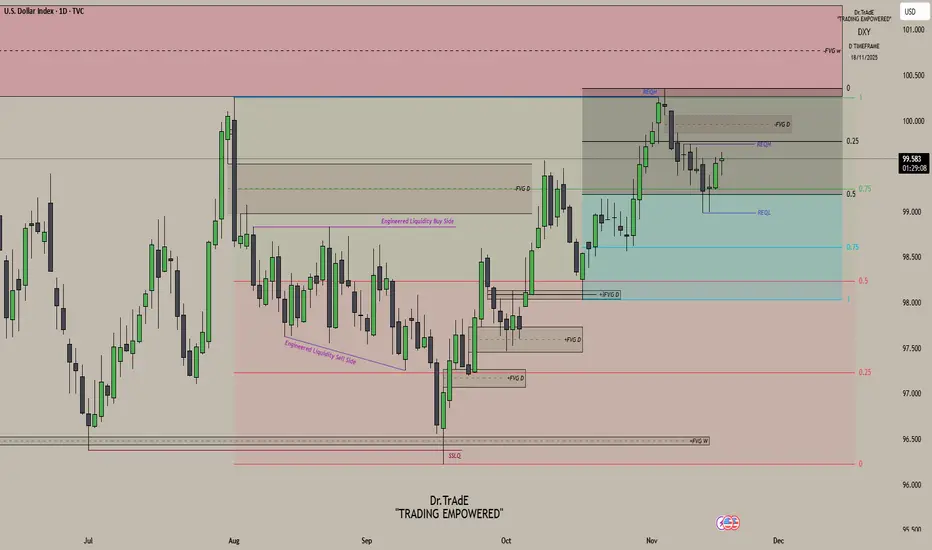
Understanding Dollar Structure and DeliveryCurrent price action is unfolding inside the Intermediate Dealing Range, defined by the November 5 high and the October 17 low. DXY is trading in the premium of its 20 day IPDA range, with equal highs sitting just under the 0.25 level as my first draw on liquidity and a Daily SIBI resting right above it. If price reacts at those equal highs, fine, that is expected. But if it keeps pressing higher, the Daily SIBI is the next draw, no question. And if price shifts with displacement from either of those levels, I am looking straight to the relative equal lows first, then 98.563 below the 0.75 level. With NFP coming up, the fundamentals can blow through structure, but if the dollar shows weakness, price is reaching into discount. That is the only direction it can go.
If you want to understand the delivery here, study this chart from August 1. Watch how price cleans up inefficiencies, hunts liquidity, and moves between premium and discount with every shift in order flow. Every displacement points to the next target. The PD arrays along the path are not decoration, they are the roadmap. I have marked the August 1 high and the September 18 low as the larger dealing range, and the November 5 high with the October 17 low as the Intermediate Dealing Range. That is the framework. That is where price is operating right now. If you want to understand the current delivery, this is the range you need to focus on.
Study the chart and you will see exactly why price moved the way it did. Yes, it is hindsight, and that is the whole point. Understanding past delivery helps you see future price action with real precision. The levels that got targeted here were not random. They were the logical draws. Learn that, and you stop guessing. The same delivery repeats again and again.