Liquidity Basics: Equal Highs/Lows, Inefficiencies & POIsPrice doesn’t move randomly, it is always attracted towards liquidity.
Every wick, breakout, and fake-out tells a story of orders being filled.
If you can read where those orders are hiding, you stop trading noise and start trading intention.
Equal Highs & Lows — The Obvious Targets
Retail traders love to mark equal highs and lows as “strong support/resistance.”
Smart money sees them as fuel.
Above equal highs = cluster of buy stops.
Below equal lows = cluster of sell stops.
When price reaches them, it’s a collection of accumulated liquidity as a main driver behind that move.
Inefficiencies — Fair Value Gaps
Also known as Fair Value Gaps (FVGs) or imbalances, these occur when price moves too quickly, leaving unfilled orders behind.
Price often revisits these zones later to rebalance.
Spot them between large candles with no overlap, they often mark where institutions filled partial orders.
Points of Interest (POIs)
POIs are areas where liquidity and inefficiency converge , the zones of intent.
Look for:
Liquidity sweep of equal highs/lows
Return to imbalance or order block
Shift in market structure
That’s where high-probability setups occur.
Note:
Stop chasing every candle.
Start mapping why price moves.
Equal highs and inefficiencies are magnets, with proper plan and confluence this can represent your strong side of trading.
Fairvaluegap

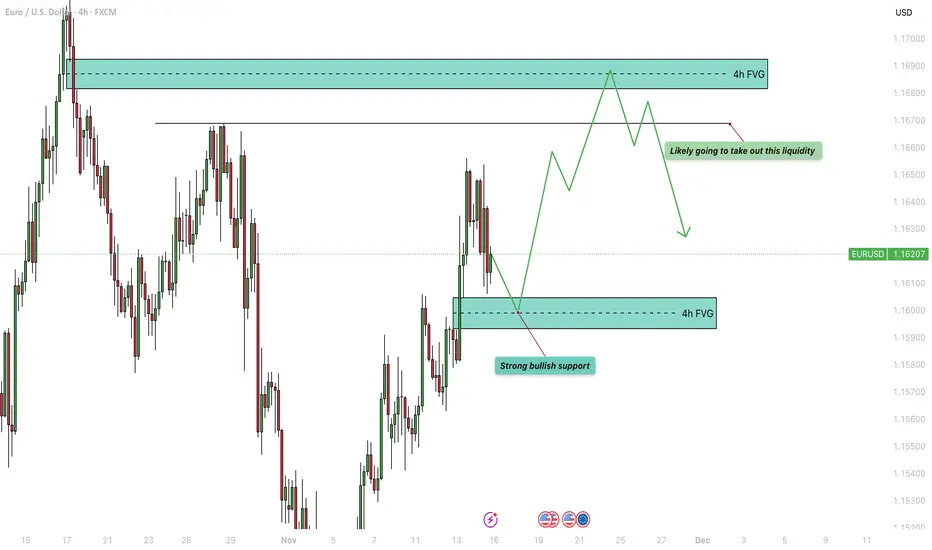
EURUSD - Outlook for next week!Introduction
EURUSD has been steadily climbing, maintaining a firm uptrend that continues to show strength in market structure. The series of higher highs and higher lows suggests that bullish momentum remains intact, with the market consistently respecting key demand zones on its way upward. As the pair progresses, important technical levels such as fair value gaps and liquidity pools will act as guidance for where price may gravitate next. The chart reflects this upward trajectory and offers a clear roadmap for potential continuation.
Bullish 4H FVG
One of the most significant areas currently in focus is the bullish 4-hour fair value gap. I expect this gap to be reached and to hold as a supportive zone if price pulls back into it. This region represents an area where the market previously moved with strong displacement, leaving inefficiencies behind. If price returns to rebalance this gap and reacts positively, it would provide a strong indication that buyers are still in control. A successful hold of the 4H FVG would reinforce the broader bullish narrative and serve as a foundation for further continuation to the upside.
Liquidity Sweep
With the prevailing trend pointing upward, EURUSD is likely to continue seeking liquidity positioned above current price levels. As momentum carries the market higher, a liquidity sweep becomes increasingly probable. This would involve price reaching into the cluster of resting liquidity above previous highs, tapping into stop orders and filling imbalances before potentially testing the bearish 4-hour fair value gap above. Such a move aligns with typical market behavior, where price targets areas of inefficiency and pockets of liquidity before deciding on its next direction.
Final Thoughts
In conclusion, EURUSD remains firmly positioned within an uptrend, and the draw on liquidity continues to point upward. The liquidity residing above the market, particularly around and just above the bearish 4-hour FVG, presents a natural target for price to explore. As long as the bullish structure remains intact and the 4H FVG holds as anticipated, the path of least resistance is still to the upside. Traders should remain attentive to how price behaves around these key zones, as they will provide important clues for the next significant movement in the pair.
-------------------------
Thanks for your support. If you enjoyed this analysis, make sure to follow me so you don't miss the next one. And if you found it helpful, feel free to drop a like 👍 and leave a comment 💬, I’d love to hear your thoughts!
Bitcoin - Is This Where The Pain Finally Ends?Bitcoin has been grinding lower for about a month after sweeping the previous all time high, which created the shift that kicked off this broader downtrend. Since that sweep, every push up has been met with selling, and the market has slowly bled its way back into a major support zone that has been significant in earlier cycles. This is the kind of level where the market usually makes a statement, either by holding and reversing or by breaking and opening the door to a deeper move.
Support Structure and Key Reaction Point
Price is sitting inside a wide support band that has given strong reactions in the past. It is a level traders know well and one that typically slows the market down. The difference this time is the structure leading into it. The downtrend has been consistent, with a string of lower highs showing that sellers remain in control for now. How the daily candle closes inside this zone will tell us a lot about whether buyers still have enough strength to defend it or if this level finally gives way.
Recent Liquidity Events and Daily Gap Behavior
Before dropping into this support, Bitcoin ran a recent daily high and instantly filled the gap above it, making it clear that the move was more about collecting liquidity than shifting the trend. After that, price slid lower again and retested the inside of the daily imbalance, but the retest failed to spark any meaningful demand. That kind of behavior often hints at a market that is still hunting lower levels rather than building upside structure.
Bullish Scenario
For sentiment to turn, Bitcoin needs to close back above the midline of this zone. That level is the one that would show buyers are actually stepping back in and absorbing the sell side. If the market can reclaim it, a short term reversal becomes possible, and the first targets would be the inefficiencies left behind during the recent selloff. From there, the market would still need to break a series of lower highs before a proper shift is confirmed on the daily timeframe.
Bearish Scenario
If the daily candle fails to close above that internal level highlighted on the chart, viewers should expect continuation lower to become the more probable scenario. A failed close there tells you buyers did not manage to hold the midpoint of the range, which usually means the market is preparing to reach for deeper liquidity. In that situation, the next major support zone below becomes the logical draw, and the path shown on the chart, a small bounce followed by another leg down, fits well with the current momentum.
Conclusion
Bitcoin is sitting at a decision point. Either this support zone does its job again and gives the market enough fuel for a recovery, or the daily close confirms that the level has weakened and the market is ready to reach for the next higher timeframe support. Until that close gives clarity, patience is key, since this is typically where traders get chopped if they try to force a direction too early.
___________________________________
Thanks for your support!
If you found this idea helpful or learned something new, drop a like 👍 and leave a comment, I’d love to hear your thoughts! 🚀

Bitcoin - Will it take the liquidity at $98.000?Bitcoin (BTC) has shown a clear downward price structure in recent days.
After a period of sideways movement and attempts at recovery, selling pressure has once again become dominant, resulting in a sharp decline toward key liquidity zones.
4h Bullish FVG Inversion
BTC has just failed to hold the 4-hour bullish FVG and has closed below it, which now acts as resistance (inversion). This opens the path toward lower levels, and the likelihood of a continued decline remains high. The bulls are currently struggling to regain ground.
Liquidity Sweep
During the most recent session, a liquidity sweep occurred, with the price dipping below previous lows and triggering many stop-losses and sell orders. Although such a move often leads to a technical bounce, overall sentiment remains bearish. The remaining liquidity below the major low around $98,000 continues to create selling pressure and could lead to further downside.
Conclusion
Despite the recent liquidity sweep, there is still no convincing bottom in sight, and downside risk continues to dominate. As long as BTC trades below the 4h FVG inversion and bearish momentum persists, a move toward $98,000 remains the most likely scenario within the current technical outlook.
-------------------------
Thanks for your support. If you enjoyed this analysis, make sure to follow me so you don't miss the next one. And if you found it helpful, feel free to drop a like 👍 and leave a comment 💬, I’d love to hear your thoughts!

Bitcoin – From Break to Battle: Will the Bulls Hold the Line?Bitcoin has broken its four-hour downtrend line, marking a potential shift in momentum after an extended bearish phase. The move has sparked renewed interest from buyers, signaling the first real attempt to reclaim structure after consistent lower highs. Despite this progress, the market remains trapped beneath a strong resistance area that has historically acted as a ceiling for price action.
Structure and Key Levels
Following the breakout, Bitcoin left behind a fair value gap, which has now been fully filled, resulting in a healthy bullish reaction. This confirms that the imbalance served as an effective demand zone, attracting buyers back into the market. Above current price, however, lies a key resistance zone that aligns with a previous liquidity sweep, keeping the risk of rejection in play.
Bullish Scenario
If buyers can maintain control above the filled gap and sustain momentum, the structure could expand higher as liquidity above recent highs becomes the next target. A decisive break and hold above the resistance zone would confirm the continuation of bullish intent and potentially establish a higher low formation on the four-hour timeframe.
Bearish Scenario
If price struggles to gain acceptance above resistance and fails to hold its current structure, a rejection could trigger a deeper retracement. This would likely drive the market back into the range below, turning the breakout into a liquidity grab rather than a true reversal. A return toward previous demand areas would then become likely as sellers reclaim control.
Price Outlook
At this point, Bitcoin appears to be consolidating between the strong resistance above and the fair value gap below. This range may act as a decision zone for the next leg. A clean break to the upside would confirm strength and validate the recent shift in structure, while a hard rejection would suggest that the broader downtrend is not yet over.
Conclusion
Bitcoin is at a crucial juncture, trading between a proven supply area and a fresh demand zone that just produced a strong reaction. The market’s next move will reveal whether this breakout can evolve into a sustained trend reversal or if it was simply another liquidity sweep within a broader bearish context.
___________________________________
Thanks for your support!
If you found this idea helpful or learned something new, drop a like 👍 and leave a comment, I’d love to hear your thoughts! 🚀

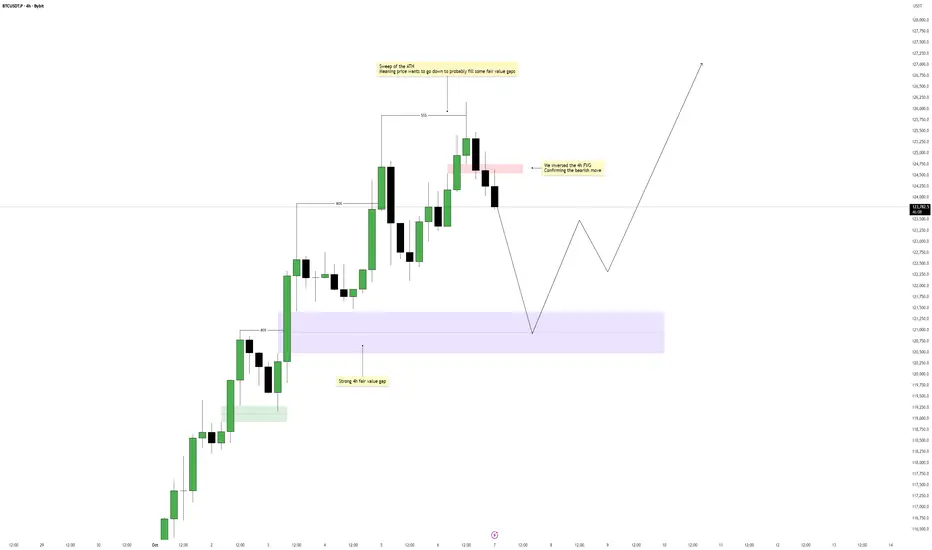
Bitcoin – Bulls Need Confirmation Before the Next Leg UpBitcoin first swept the all-time high, taking out liquidity before showing signs of exhaustion. This move triggered a sharp selloff that rebalanced the previous inefficiency left behind on the daily chart. The rejection from that premium area set the tone for a corrective phase, bringing price back into discount levels where buyers are now attempting to re-establish control.
Consolidation Structure
After the ATH sweep, Bitcoin formed a clear lower high structure. The subsequent drop not only filled an existing daily Fair Value Gap but also created another sweep within that same range. This type of double sweep formation often acts as a transition phase between bearish distribution and potential accumulation, provided the market finds enough volume support at lower levels.
Bullish Scenario
The most recent move filled the lower wick and swept local lows, which typically indicates a liquidity grab before a shift in sentiment. If bulls can close above the highlighted level with strong volume, this would suggest a market structure shift on higher timeframes and could trigger a push toward the 111,000–114,000 region, where the next daily inefficiency lies inside the previous sweep zone.
Bearish Scenario
Failure to reclaim and close above the key resistance level would suggest that the current move is only a retracement within the broader bearish leg. In that case, Bitcoin could revisit the 100,000–101,000 area to re-test the liquidity base created by the recent wick fill, potentially even running the lows one more time before forming a clearer accumulation range.
Price Target and Expectations
If bullish confirmation comes through, the initial target sits near 111,000, aligning with the lower boundary of the daily FVG. A clean breakout beyond 114,000 would further confirm strength and possibly open the way back toward the 118,000–120,000 region where prior inefficiencies remain unmitigated.
Conclusion
Bitcoin has completed a deep corrective sweep, but bulls have yet to prove dominance. A decisive close above the marked resistance with solid volume would confirm that buyers are regaining control and set the stage for continuation toward the higher daily imbalance. Until then, patience is key, as the current move remains a potential retracement rather than a confirmed reversal.
___________________________________
Thanks for your support!
If you found this idea helpful or learned something new, drop a like 👍 and leave a comment, I’d love to hear your thoughts! 🚀

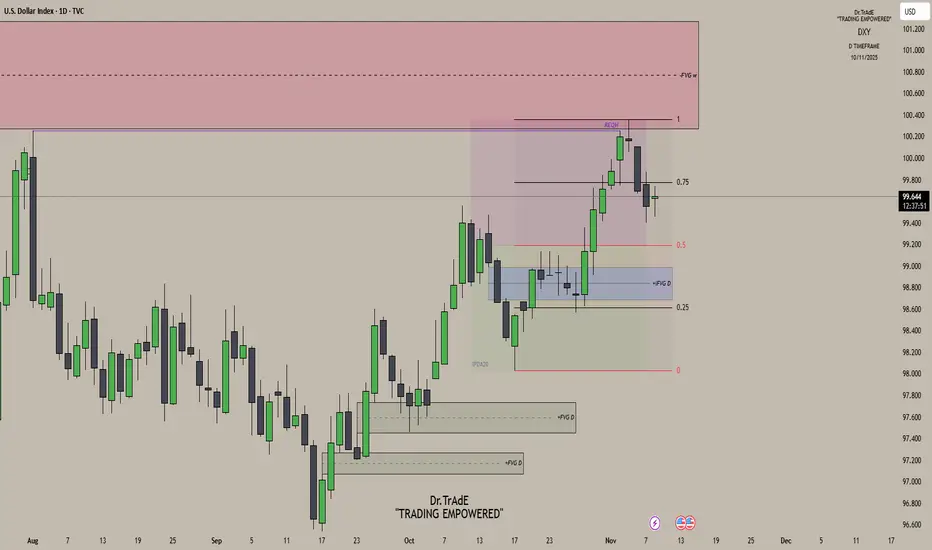
DXY Daily AnalysisLast Week’s Review:
Monday: Bullish delivery as price continued higher.
Tuesday: Price maintained bullish momentum but failed to take out the previous high, leaving equal highs — liquidity resting above.
Wednesday: That liquidity was swept as price reached into the weekly fair value gap, completing delivery to the premium array and initiating bearish distribution.
Current Outlook:
On the daily chart, we’re still trading deep inside premium, and price is showing clear signs of exhaustion after that delivery into the weekly FVG. With bearish distribution now in play, my bias remains bearish. Any short-term push back into the 0.75 quadrant, I’ll treat as a retracement — a chance for price to reprice some lower-timeframe inefficiencies before the next leg lower. On the 4H chart, I’ll be watching for price to trade back into short-term FVGs or inefficiencies that align with this overall bearish narrative.
Bitcoin - Deathcross is coming!Bitcoin has shown a strong move over the past week, reaching the predicted downside target.
The price action is currently hovering around key technical levels that influence market sentiment on both higher and lower timeframes.
Recap of Last Week
Last week, it was noted that BTC had made a liquidity sweep, inversed the bullish daily FVG, and formed a fake-out, all pointing toward further downside movement. The target was set just above $103,000, and this was convincingly reached, with a decline of roughly 7–10%. The prediction played out accurately, and the market clearly demonstrated that the bears remain in control.
Daily Timeframe
On the daily timeframe, it’s notable that the major low around $98,000 has not yet been taken out. At the same time, BTC is trading below a strong resistance zone just above the current price.
This area will be difficult to break and could create downward pressure, making a sweep of the $98,000 level more likely. However, if BTC manages to reclaim these resistance zones, sentiment could shift to a more bullish outlook, but for now, the bears are still in charge.
4h Timeframe
On the 4-hour timeframe, there’s a 4h FVG located just above the current price.
From a technical standpoint, this is a logical area for a potential rejection.
The expectation is that BTC will first move up toward this FVG before facing a rejection and then drop again toward the $98,000 zone.
Death Cross
A death cross may form within the next 1–2 weeks, occurring when the 50-day MA crosses below the 200-day MA. This is a well-known bearish signal, but historically, it often appears toward the end of a downtrend. In this cycle, we’ve already seen three death crosses, all of which either marked or came close to marking a bottom.
However, during 2017 and 2021, death crosses also appeared at the end of bull markets — followed by a sharp decline, and then a relief rally that pushed prices back above the death cross level. Therefore, it’s crucial to stay alert to whether this signals the end of the bull market or rather a final shakeout before a new rally.
Conclusion
BTC has reached the expected downside target and is currently trading below strong resistance. It’s likely that BTC will first test the 4h FVG and then move toward the $98,000 zone.
The upcoming death cross could add pressure, but historically, such signals often mark the end of a downward phase. The coming weeks will be crucial in determining whether this is a deeper correction or the start of a new bullish impulse.
-------------------------
Thanks for your support. If you enjoyed this analysis, make sure to follow me so you don't miss the next one. And if you found it helpful, feel free to drop a like 👍 and leave a comment 💬, I’d love to hear your thoughts!

Fair Value Gaps: The Market Secret You Shouldn’t IgnoreEver scrolled through a chart and spotted a weird empty space in the candles — like the market just skipped a beat? That’s a Fair Value Gap (FVG). It’s one of those subtle price imbalances smart traders love to hunt for. Understanding how these gaps form and how price reacts around them can seriously level up your chart-reading game.
What Is a Fair Value Gap in Trading?
A Fair Value Gap happens when there’s a sudden surge in buying or selling pressure that causes price to move so fast, it doesn’t fully balance out between buyers and sellers. In simple terms, it’s an imbalance — a zone where the market skipped over potential orders.
When you hear traders talking about FVG in trading, they’re referring to those little pockets of unfilled liquidity left behind during strong moves.
So, what is FVG in trading, and why does it matter? Because price often comes back to those areas later to “rebalance” — filling the gap before continuing in the original direction. That’s the core logic behind Fair Value Gap trading.
Bullish and Bearish FVGs
There are two main types of Fair Value Gaps — bullish and bearish:
Bullish Fair Value Gap (bullish FVG): Forms during a strong upward move, when aggressive buyers push price higher, leaving a void below. Price might later dip back into that zone before continuing upward.
Bearish Fair Value Gap (bearish FVG): Forms in a sell-off, when sellers dominate and the market drops quickly, skipping over potential buy orders. Later, price often retraces upward to “fill” that gap.
Both can act as magnets for liquidity — areas where smart money likes to re-enter the market.
Fair Value Gap Example
Let’s say Bitcoin jumps from $110,000 to $120,000 in a single bullish candle, with almost no trading in between. That sudden move leaves a Fair Value Gap — the zone between the candle’s high and low where little to no trading took place.
If the market later pulls back to that range and finds support before bouncing, you’ve just witnessed a textbook Fair Value Gap example in action.
Using a Fair Value Gap Indicator
You can spot these zones manually by looking for three-candle structures — one candle that “leaves the gap” and two surrounding it that don’t overlap. But if you prefer automation, you can use a Fair Value Gap indicators:
Fair Value Gap Trading Strategies
Fair Value Gap trading isn’t about chasing price — it’s about waiting for the market to come back to you. Within Smart Money Concepts, traders often combine FVGs with CHoCH (Change of Character) to confirm a potential shift in structure before entering.
A common approach is to mark recent FVGs, identify the broader trend, and wait for price to revisit a gap in line with that trend.
In a bullish trend , traders look for bullish FVGs below current price as potential demand zones — ideally after a CHoCH confirms that buyers are stepping back in.
In a bearish trend , they watch for bearish FVGs above current price as potential supply zones, again validated by a CHoCH showing a shift in control.
Still, it’s important to remember — these setups are not guarantees. The market doesn’t owe you a fill. Use FVGs and CHoCH as part of the Smart Money framework, not as standalone signals. Always manage risk and make your own trading decisions based on your personal strategy and comfort level.
Final Thoughts
So, what is a Fair Value Gap really? It’s not magic — just the market showing where it moved too fast. Learning to read Fair Value Gaps gives you insight into liquidity, momentum, and potential reversals. Whether you use a Fair Value Gap indicator or mark them by hand, mastering FVG in trading can give you a serious edge in spotting high-probability zones.
Just keep in mind — no indicator or setup replaces good judgment.
Observe, adapt, and let the charts speak for themselves.

Bitcoin - Liquidity grab signals further downside!Bitcoin (BTC) is currently in a crucial phase within a broader consolidation structure. After a strong upward move, the price has encountered significant resistance and is showing signs of weakening buying pressure. On the daily chart, it is clear that the price has re-entered the triangle structure after a brief breakout above resistance.
Liquidity Grab
Around $116,000, a clear liquidity sweep can be observed. Above this level, many stop orders and short-position liquidity were clustered. After this liquidity was taken, the price reversed sharply downward — indicating that large market players likely used this move to take profits or open short positions.
Fake-Out from the Triangle Pattern
The breakout above the triangle structure turned out to be a fake-out. Instead of holding above the trendline for confirmation, the price quickly fell back within the formation. This indicates buyer weakness and strengthens the bearish scenario. A fake-out above a consolidation pattern often leads to a move in the opposite direction — toward the lower boundary of the structure.
Daily FVG
The current candle is positioned within an important daily Fair Value Gap (FVG). If the daily close remains as it is, this bullish FVG will convert into a bearish FVG, meaning the area will now act as resistance. This suggests that bears are taking control and further downward price action is likely.
Target
After an upward fake-out that collects liquidity, price often moves to the opposite side of the pattern. In this case, that would be the lower side of the triangle. A drop toward $103,000–$104,000 is therefore the most likely scenario. This zone aligns with previous structural support and can serve as a logical target area.
Conclusion
Bitcoin is showing clear signs of exhaustion near the top of the range. The liquidity grab and fake-out from the triangle reinforce the bearish outlook. With the daily FVG flipping bearish and bullish momentum fading, a move down toward the $103,000–$104,000 zone appears to be the most probable next step — unless BTC unexpectedly manages to close above the FVG.
-------------------------
Thanks for your support. If you enjoyed this analysis, make sure to follow me so you don't miss the next one. And if you found it helpful, feel free to drop a like 👍 and leave a comment 💬, I’d love to hear your thoughts!

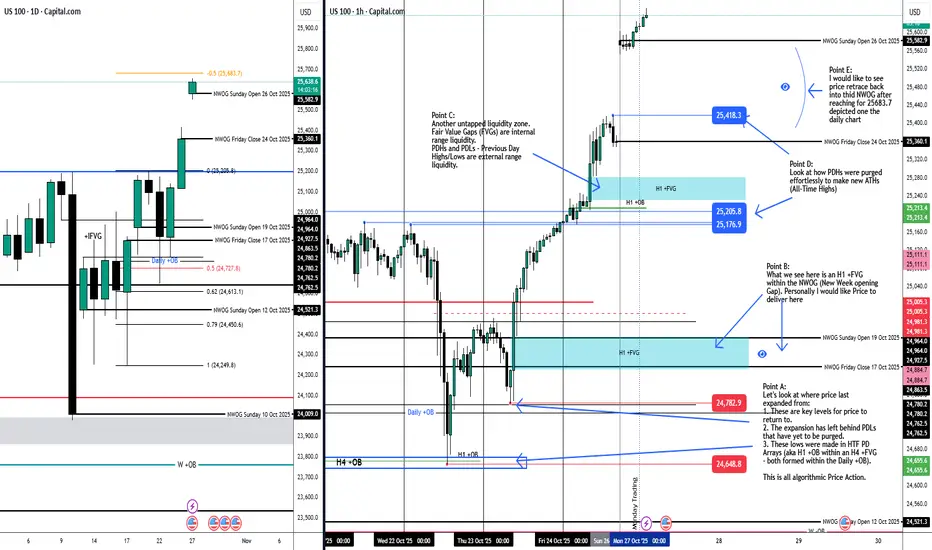
NO CLEAR BIAS: AWAITING PRICE ACTION SIGNALS TO DECIDESTUDY THE POINTS MADE ON THE H1 ALONGSIDE WHAT THE DAILY CHART INDICATES
DISCLAIMER:
The owner of this page is an authorised Representative under supervision of TD MARKETS (PTY) LTD, an authorised Financial Services Provider (FSP No. 49128) licensed by the Financial Sector Conduct Authority (FSCA) under the Financial Advisory and Intermediary Services Act (FAIS).
The FSP is licensed to provide advice and intermediary services in respect of Category I financial products, including but not limited to derivative instruments, long-term deposits, and short-term deposits.
All investment ideas are provided in accordance with the scope of the FSP's license and applicable regulatory requirements. Derivative instruments is a leveraged products that carry high risks and could result in losing all of your capital, and past performance is not indicative of future results.
This idea and any attachments are informational/education and does not constitute a recommendation to buy/sell.
No guarantee is made regarding the accuracy or outcome of this trade idea.
If you choose to accept this idea, please do so at your own risk.
Bitcoin - Will the bears push the price towards $104.000?Introduction
Bitcoin is currently in a phase of consolidation following the recent sharp decline. For several days, the price has been forming a symmetrical triangle, indicating increasing tension between buyers and sellers. This phase is often seen as a period of preparation for a larger move. However, clear bullish momentum is still lacking, which increases the risk of a downward breakout.
Triangle pattern
The price is moving within a triangle pattern, where the highs are decreasing and the lows are slightly rising. This suggests a compression of liquidity and declining volatility. The upper boundary of the pattern acts as dynamic resistance, while the lower boundary serves as support. Once the price breaks out of this structure, the direction of the next major move will likely be determined. For now, the price seems trapped between these two key levels.
Liquidity at the top with the bearish 4h FVG tested
Yesterday, the upper side of the structure was tested, just above the 4-hour bearish Fair Value Gap (FVG). In that area, liquidity from previous highs was also located. The price reacted with a strong rejection and quickly fell back. This reaction confirmed that sellers still have control and that demand has weakened. The signal indicates that the market is struggling to break above $114,000.
4h bearish FVG
The 4-hour bearish FVG is located between approximately $108,600 and $111,300. This zone now serves as a key resistance area. Each time the price touches this region, selling pressure increases, limiting further upside movement. As long as this zone is not convincingly broken with volume, the short-term trend remains bearish. A breakout above this level could open the door to higher targets.
Liquidity area at the bottom
At the lower end of the triangle, there is a clear liquidity area around $103,500. This is where stop-losses from long positions and potential buy orders from large players are located, waiting for a liquidity grab. If the price moves into this area, a short wick downward could occur before a potential bounce takes place. Therefore, this level is important to monitor in case of a downward breakout.
Conclusion
BTC still shows no signs of strength. The rejection from the 4-hour bearish FVG above the liquidity zone points to a lack of buying interest. As long as the price remains within the triangle and trades below $113,000, the likelihood of a downward move remains higher. Only a convincing breakout above the upper boundary could temporarily improve market sentiment. Until then, the bears remain in control, with focus on the support around the lower liquidity zone.
-------------------------
Thanks for your support. If you enjoyed this analysis, make sure to follow me so you don't miss the next one. And if you found it helpful, feel free to drop a like 👍 and leave a comment 💬, I’d love to hear your thoughts!

21 OCT 2025: US100 MARKET RECAPNOT A DAY FOR THE FAINT HEARTED
Study through the consolidation!
DISCLAIMER:
The owner of this page is an authorised Representative under supervision of TD MARKETS (PTY) LTD, an authorised Financial Services Provider (FSP No. 49128) licensed by the Financial Sector Conduct Authority (FSCA) under the Financial Advisory and Intermediary Services Act (FAIS).
The FSP is licensed to provide advice and intermediary services in respect of Category I financial products, including but not limited to derivative instruments, long-term deposits, and short-term deposits.
All investment ideas are provided in accordance with the scope of the FSP's license and applicable regulatory requirements. Derivative instruments is a leveraged products that carry high risks and could result in losing all of your capital, and past performance is not indicative of future results.
This idea and any attachments are informational/education and does not constitute a recommendation to buy/sell.
No guarantee is made regarding the accuracy or outcome of this trade idea.
If you choose to accept this idea, please do so at your own risk.

Gold (XAU/USD) M30 Smart Money Setup – Price Action Analysis📊 Current Structure:
On the M30 timeframe, CHOCH (Change of Character) has formed around 4186, confirming a possible bearish shift in market structure. The previous low stands at 4004, which acts as a major liquidity zone and final bearish target.
🧠 Smart Money Concept Overview
After the CHOCH at 4186, Gold is expected to retrace to premium zones before continuing its bearish move. The market has created two Fair Value Gaps (FVGs) — potential supply areas where price may react.
⚙️ Key Zones
1️⃣ 1st FVG (4231 – 4246) → Minor retracement zone 🟠
2️⃣ 2nd FVG (4302 – 4322) → Strong supply zone 🔴
📍 Stop Loss (SL): 4346
🎯 Target (TP): 4001
🧭 Trading Plan
Wait for price to tap into any FVG zone (4231–4322).
Confirm bearish reaction using candlestick rejection or CHOCH on lower TFs (M5–M15).
Enter short positions aiming for the 4001 target.
Risk management: keep SL tight above 4346.
📉 Conclusion
Gold currently shows strong bearish pressure after CHOCH confirmation. Smart money traders will be looking for short entries from FVG zones toward the 4001 liquidity target. Manage your trade wisely and follow structure confirmation before entry. 🧩
💡 Disclaimer: This analysis is for educational purposes only. Always do your own research before trading. 📚

Bitcoin - Is the top already in?Introduction
This chart analyzes Bitcoin’s cyclical timing. The focus is on time, not price. It examines the number of days between structural moments such as cycle tops, cycle bottoms, and halvings. By comparing these intervals, we can understand rhythm and consistency. This helps determine whether the current cycle top may have already formed in early October.
Cycle Top to Cycle Bottom
The period from cycle top to cycle bottom represents the bear phase after a market peak. In the previous two cycles, this phase lasted about 365 days each. This pattern suggests that the market typically needs a year to recover. After that, a new accumulation phase usually begins. If the pattern holds, it provides a fairly predictable window for correction. It marks the transition from euphoria to rebuilding.
Cycle Bottom to Cycle Top
The phase from cycle bottom to cycle top defines the bull run itself. In the last two cycles, this period lasted 1,065 and 1,066 days. That is just under three years. During this time, Bitcoin rose from deep accumulation to a new all-time high. Based on current data, 1,065 days points to early October. In that month, a new ATH was reached. This makes the current phase consistent with past cycles. It supports the idea that the top may already be in.
Cycle Top to Cycle Top
The full duration from peak to peak measured 1,461 and 1,431 days in previous cycles. This shows a clear recurring rhythm. The market moves in fairly consistent four-year patterns. Comparing this with the current cycle shows a slight extension. If the peak occurred in early October, this cycle is longer than the last. That may suggest a more mature market. Growth is slower but structurally stronger.
Halving to Cycle Top
The time between a halving and the next cycle top is key. Halvings affect both supply and market sentiment. In past cycles, this interval was 518 and 548 days. We are now exactly at day 548 since the last halving. This aligns perfectly with historical timing. It supports the idea that the top was reached in early October. The moment fits the halving-to-top rhythm observed in earlier cycles.
Conclusion
Based on this timing analysis, it is very likely that the cycle top formed in early October. The bottom-to-top duration of 1,065 days and the halving-to-top of 548 days confirm this. Both match previous patterns. The current cycle is slightly longer than earlier ones, suggesting a slower rhythm. If Bitcoin sets a new ATH later, it would mark an extended cycle.
Timing alone does not guarantee future price direction. Macro factors, policy shifts, and liquidity events can all change the rhythm. Use timing cycles as context, not as prediction. Combine them with price structure and on-chain signals. Maintain active risk management, since longer cycles often bring higher volatility and larger deviations from historical averages.

Bitcoin - First Signs of the Bear AwakeningBitcoin recently swept the previous all-time high, taking liquidity from the major external range. After that sweep, price reacted sharply downward, leaving behind a significant daily imbalance. This gap is now acting as resistance, with clear rejection seen on the daily timeframe. The move signals exhaustion from buyers and an early sign that the market could be preparing for a deeper retracement phase.
Consolidation Structure
Following the rejection, Bitcoin is moving within a short-term consolidation range, sitting between the daily imbalance above and a major demand zone below. This structure represents indecision as the market transitions from expansion to a potential reaccumulation or redistribution phase. The large wick left behind during the last drop suggests that liquidity was collected below the previous range, but it remains unfilled, hinting at unfinished business in that area.
Bullish Scenario
In the short term, a bounce from the lower zone could play out as the market attempts to correct the imbalance. This would align with a 50% fill of the previous large wick, providing the liquidity needed before resuming any sustained downside movement. If buyers manage to reclaim control temporarily, the move would likely target the unfilled 4-hour gaps sitting above current price.
Bearish Scenario
However, any upside reaction is expected to face resistance at the daily imbalance. Once those 4-hour gaps are filled, the likelihood of another rejection increases. If that rejection confirms, it could trigger a larger selloff targeting the strong support area below, where the next round of liquidity rests. The reaction from that zone will determine whether the market continues lower or begins forming a new base for accumulation.
Price Target and Expectations
The ideal flow would see Bitcoin dip to fill 50% of the large wick, find temporary support, then stage one final bounce into the 4-hour imbalance zone before resuming its bearish leg. This structure keeps the overall narrative intact, combining liquidity behavior with efficient price delivery.
Conclusion
Bitcoin’s current setup remains technically balanced between two key inefficiencies. A short-term bounce is likely before continuation lower, with the daily gap rejection acting as the main pivot point in this structure. Until the wick fill and 4-hour gaps are resolved, the path of least resistance remains to the downside.
___________________________________
Thanks for your support!
If you found this idea helpful or learned something new, drop a like 👍 and leave a comment, I’d love to hear your thoughts! 🚀

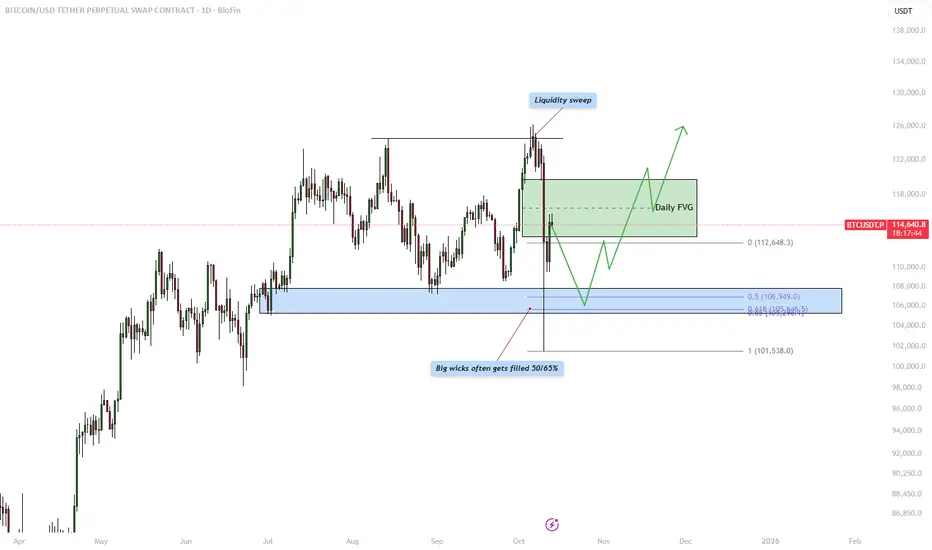
Bitcoin - What to expect from this week?Introduction
This analysis examines the recent price behavior of Bitcoin against USDT on the daily timeframe. The chart highlights several key technical concepts, including a liquidity sweep at the highs, a daily Fair Value Gap (FVG) acting as resistance, and the likelihood of a wick fill within a major imbalance zone. Together, these elements provide valuable insight into how institutional traders may be engineering liquidity and preparing for the next significant move. Understanding these areas can help traders anticipate high-probability reaction zones and better align with the market’s underlying structure.
Liquidity sweep
The market recently executed a liquidity sweep above previous swing highs, triggering buy stops and attracting breakout traders into the move. This sudden push to the upside was quickly rejected, signaling that smart money likely used this moment to gather liquidity and distribute positions. Liquidity sweeps often serve as the market’s way of collecting orders before a reversal or retracement, indicating that the bullish momentum may be temporarily exhausted. This event sets the stage for price to rebalance inefficiencies left behind during the rapid move.
Daily FVG resistance
Following the liquidity sweep, price left behind a clear daily Fair Value Gap, which represents an area of imbalance caused by strong displacement. This gap often acts as resistance, where price is expected to return and mitigate before potentially continuing lower. The FVG provides an ideal area for institutional traders to reposition, as it offers a point of confluence between inefficiency and structure. If price reacts bearishly within this zone, it would strengthen the bearish outlook and suggest a continuation toward lower levels.
Wick fill
The large wick seen during the recent sell-off is an important feature of this chart. Historically, big wicks tend to get filled by 50% to 65%, reflecting the market’s tendency to rebalance inefficiencies over time. The marked blue zone below shows where this fill is most likely to occur. This zone aligns closely with previous support levels and Fibonacci retracement levels, further reinforcing it as a potential area of interest. A wick fill into this region could provide liquidity for future bullish movement, allowing the market to establish a more solid foundation for the next impulsive leg upward.
Conclusion
In summary, the current daily structure of Bitcoin suggests that price has completed a liquidity sweep at the highs and is now in the process of rebalancing inefficiencies through a possible retracement. The daily Fair Value Gap above serves as a critical resistance zone where sellers may re-enter, while the wick fill area below marks a high-probability target for price to revisit before establishing new direction. Traders should monitor how price reacts to these two regions, a rejection from the FVG coupled with a move toward the wick fill zone could signal the next significant swing opportunity. In this environment, patience and precision are key, as the market seeks equilibrium before its next major directional move.
-------------------------
Thanks for your support. If you enjoyed this analysis, make sure to follow me so you don't miss the next one. And if you found it helpful, feel free to drop a like 👍 and leave a comment 💬, I’d love to hear your thoughts!
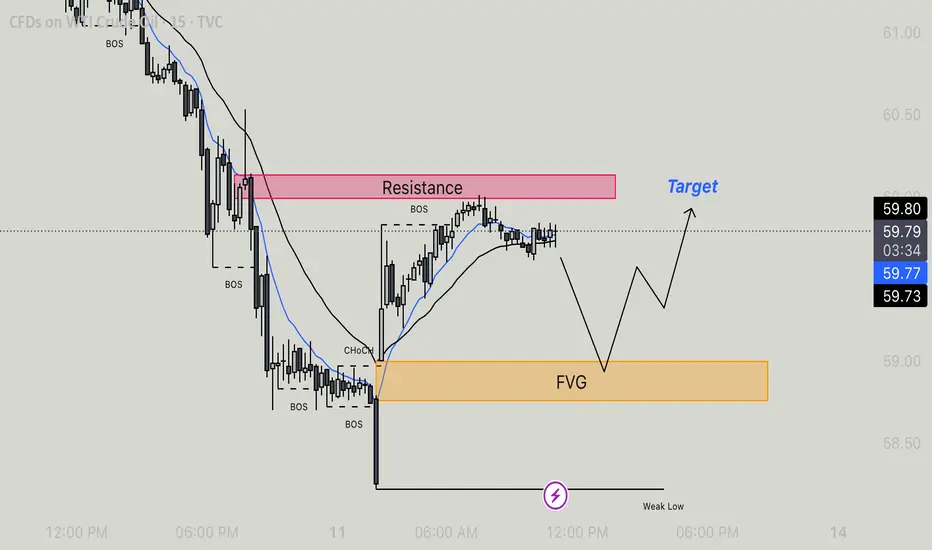
Usoil - Retracement to FVG Before Bullish ContinationMarket Structure & Key Levels
Resistance Zone: Price reacted from this supply area, showing short-term rejection after BOS (Break of Structure) to the upside.
FVG (Fair Value Gap): Price is expected to retrace into this imbalance zone for demand before resuming higher. Watch for bullish price action here.
Weak Low: If price breaks this low, the bullish scenario becomes invalid and deeper downside may follow.
Structure Highlights:
BOS (Break of Structure): Several BOS points confirm previous bearish trend and recent short-term bullish correction.
CHoCH (Change of Character): Marked at the base of reversal near FVG zone, indicating possible trend shift.
EMA Confluence: Price hovering around short EMAs, showing possible slowdown and setup for a pullback.
Trade Scenario
Expected Move:
Price could retrace to the FVG zone (imbalance fill) before a bounce.
From there, bullish momentum may resume toward the target zone above resistance.
Bullish Confirmation:
Look for price to tap into the FVG, form bullish structure (e.g., BOS, CHoCH), and engulfing patterns or lower-timeframe entries.
Target would be near recent highs or break above resistance at ~$59.90–60.00.
Invalidation:
Break below the Weak Low would invalidate this bullish setup and open room for further downside.
Bitcoin – Short-Term Weakness, Long-Term StrengthBitcoin has recently swept the all-time high, triggering a short-term reaction from liquidity resting above that level. This move often signals that the market has completed its buy-side run and is now seeking to rebalance inefficiencies created during the aggressive push upward. The current structure indicates that price is shifting momentum in the short term, preparing for a deeper retracement before resuming its bullish trajectory.
Imbalance and Structure Shift
Following the liquidity sweep, a clear 4-hour imbalance (IFVG) has formed, acting as the first sign of bearish pressure entering the market. This inefficiency shows that the prior move lacked sufficient counter-orders, meaning price may need to return there to restore balance. The bearish move was further confirmed as price inverted a smaller 4-hour FVG, signaling a potential continuation to the downside in the short term.
Bearish Scenario
If the market continues to respect the newly formed IFVG, we could see a sustained bearish retracement develop. Price may use this imbalance as a draw, seeking to fill deeper inefficiencies left behind during the prior expansion. This corrective phase is not necessarily a trend reversal but rather a short-term redistribution phase before buyers potentially step back in from lower levels.
Bullish Scenario
Once the 4-hour fair value gap below is filled, the market could begin forming a base for a new bullish leg. The liquidity collected from the downside move and the rebalancing of inefficiencies would give price enough fuel for a strong continuation higher. Traders should look for a clean market structure shift or displacement from that demand area as the signal of renewed bullish intent.
Expectations and Outlook
In summary, Bitcoin appears to be in a healthy retracement phase after sweeping liquidity at the highs. The 4-hour imbalance provides a clear short-term target for price to seek, and once filled, the bullish structure could resume. This setup favors patience, waiting for confirmation that the downside rebalancing is complete before anticipating another impulsive rally.
Conclusion
Overall, Bitcoin’s structure suggests a temporary bearish move to fill the 4-hour FVG, followed by a potential bullish continuation once that inefficiency is resolved. Watching how price reacts upon entering that zone will be key in determining whether the next expansion phase begins.
___________________________________
Thanks for your support!
If you found this idea helpful or learned something new, drop a like 👍 and leave a comment, I’d love to hear your thoughts! 🚀
Bitcoin - Shortterm correction in the bullish trend!Introduction
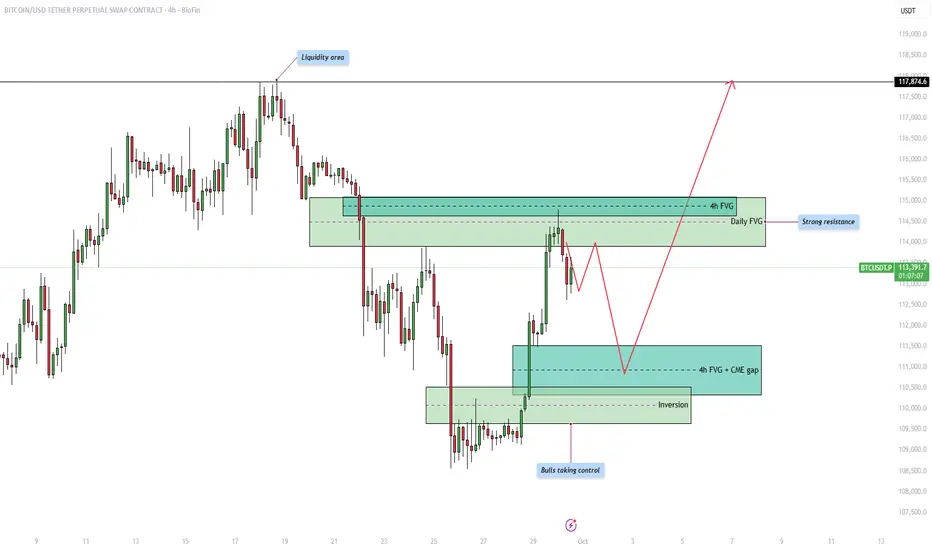
The Bitcoin price action is currently moving within a structured range where both liquidity and fair value gaps (FVGs) are playing an important role in shaping potential market direction. By analyzing the chart, we can identify key areas of liquidity, resistance, and support that traders are likely to pay close attention to in the coming days. Understanding how price reacts around these zones will help anticipate whether bulls can maintain control or if bears will attempt to reclaim lost ground.
Upside liquidity
At the top of the range, we can see a clear liquidity area where price previously reversed. This liquidity pool represents buy-side liquidity, and the market could be drawn towards it as price seeks to sweep the highs. Liquidity is often targeted by the market before making a significant move in the opposite direction, which makes this area important to watch closely.
Resistance from the 4h and daily FVG
Before price can reach higher liquidity levels, it must contend with a strong resistance zone that overlaps with both the 4-hour and the daily fair value gap. This confluence strengthens the resistance, making it more likely that price will struggle to break through immediately. Traders will be watching for signs of rejection within this area, which could cause short-term pullbacks before any potential breakout.
4h FVG and CME gap support
On the downside, the 4-hour fair value gap aligns with the CME gap, providing a strong support level. This zone acts as an attractive area for price to retrace into before continuing higher. It is common for the market to return to such imbalances to fill inefficiencies, so a temporary dip into this support could serve as a healthy retracement before bulls attempt to push price further upward.
Bullish inversion
Another critical development is the inversion zone, where previous resistance has now flipped into support. This shift highlights that bulls are taking control of the market structure, strengthening the overall bullish outlook. As long as this inversion level holds, buyers are likely to defend it aggressively, reducing the probability of a deeper breakdown.
Final thoughts
Overall, the market remains in a bullish posture with upside liquidity acting as a magnet, but significant resistance awaits at the overlapping 4h and daily FVG. Short-term pullbacks into the 4h FVG and CME gap support are likely before the next major move upward. If the bullish inversion continues to hold, we could see a strong push towards the higher liquidity zones, potentially targeting levels beyond 117,000. The coming days will be crucial in determining whether bulls can maintain this control or if resistance proves too strong.
-------------------------
Thanks for your support. If you enjoyed this analysis, make sure to follow me so you don't miss the next one. And if you found it helpful, feel free to drop a like 👍 and leave a comment 💬, I’d love to hear your thoughts!
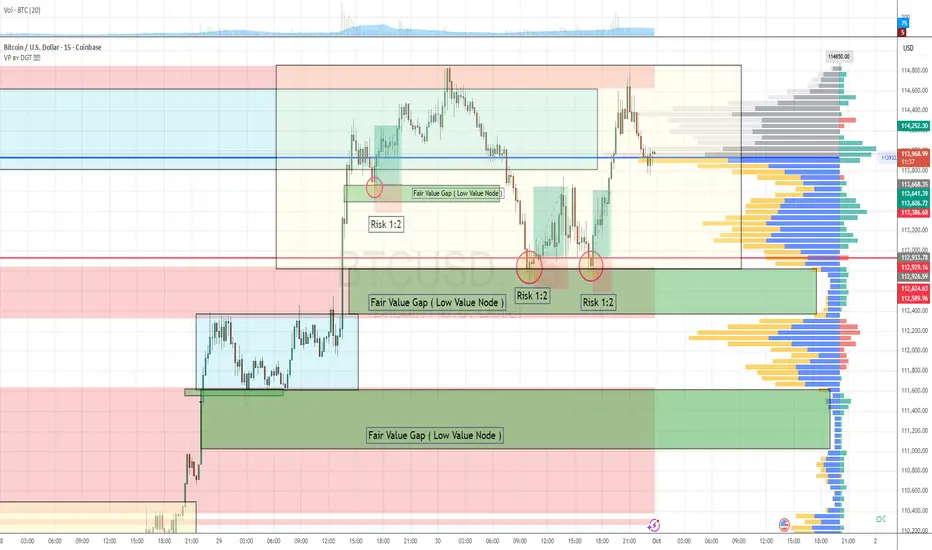
Order Flow & Fair Value Gap Approach 3 Setups in the last 48hourThis strategy leverages order flow analysis and the concept of fair value gaps, operating on the principle that the market behaves as an auction—constantly seeking areas of balance and imbalance.
Over the past 48 hours, BTCUSD has presented three high-probability scalping setups aligned with this methodology.
Market Context
Trend: Bullish
The market has shown clear bullish momentum over the last 48 hours.
Breakout Event:
Price broke out of a consolidation zone with strong, aggressive buying activity, indicating a shift in market sentiment and the initiation of a new leg in the trend.
Imbalance Creation:
During this breakout, two fair value gaps (FVGs)—also referred to as low value nodes (LVNs)—were formed as a result of inefficient price movement.
Trade Setup Criteria & Checklist
To validate each setup, we apply the following checklist:
Criteria Status
1. Trend is bullish ✅ Confirmed
2. Breakout from a consolidation zone with aggressive buy orders ✅ Confirmed
3. Fair value gap created by impulsive buying ✅ Confirmed
4. Retracement into the fair value gap ✅ Confirmed
5. Confirmation of strong buyers defending the FVG zone ✅ Confirmed
6. Defined risk with favorable R:R (1:2 or better) ✅ Confirmed
Risk Management
Each trade setup followed a 1:2 risk-to-reward ratio, maintaining consistency with our strategy's risk parameters.
This sequence illustrates how combining order flow with structural imbalances like fair value gaps can produce high-quality scalping opportunities. Always remember: context, confirmation, and confluence are key.
Cable$FibreIn the past few days we've seen a bearish momentum on cable and fibre. This is my opinion will continue to be the case in he coming weeks. This week however, the market is retracing, to take out those who're currently profitable. The first week of the month is relatively unpredictable so I'd advice you to sit back and relax, unless you know what you're doing. From next week, I expect to see price resume its bearish stance.

EURUSD - Bears are taking control!Introduction
This chart analysis of EUR/USD highlights key price action concepts such as liquidity grabs, fair value gaps, and inversions on the four-hour timeframe. By examining how the market has been moving recently, we can better understand where price may head next and how institutional activity could be shaping upcoming moves. The following sections break down the liquidity sweeps, the bearish and bullish setups, and the potential implications for future price direction.
Liquidity grab at the upside
The recent price movement shows a clear liquidity grab to the upside, where price aggressively pushed higher to take out resting buy stops above previous highs. This kind of move is typical of market makers and institutions seeking liquidity before reversing the price. Once those stops are cleared, the market often lacks the momentum to sustain higher levels, which can be a precursor to a reversal or deeper retracement.
Liquidity grab at the downside
After the upward liquidity sweep, the market also executed a downside liquidity grab. Price dipped lower to target sell-side liquidity, running stops beneath previous lows before showing signs of reacting. These moves are designed to trap both breakout traders and late sellers, creating the liquidity necessary for the next larger move. This back-and-forth price action emphasizes how the market often seeks liquidity in both directions before deciding on a sustained trend.
4h bearish FVG
A four-hour bearish Fair Value Gap (FVG) has formed, which acts as a strong area of imbalance where price is likely to return. This zone provides a potential entry point for institutional traders looking to short, as it represents inefficiency in the market that has yet to be filled. As long as price respects this area and reacts bearishly upon re-entry, it strengthens the case for continuation to the downside.
4h bullish inversion
At the same time, there is a four-hour bullish inversion level, where previous resistance has flipped into potential support. This area can act as a temporary base for price to consolidate or retrace before resuming its bearish trajectory. If the inversion holds, we might see short-term bullish reactions, but the broader market structure still favors sellers as long as the bearish FVG remains intact.
Final thoughts
Overall, the current EUR/USD setup suggests that the market is in the process of engineering liquidity on both sides before deciding its next major move. The upside and downside liquidity grabs confirm the presence of institutional activity, while the bearish FVG highlights a potential point of interest for further selling. The bullish inversion may offer temporary support, but the broader bias remains bearish until proven otherwise. Traders should watch how price reacts to the highlighted zones, as these areas are likely to provide the clearest signals for the next significant move.
-------------------------
Thanks for your support. If you enjoyed this analysis, make sure to follow me so you don't miss the next one. And if you found it helpful, feel free to drop a like 👍 and leave a comment 💬, I’d love to hear your thoughts!
