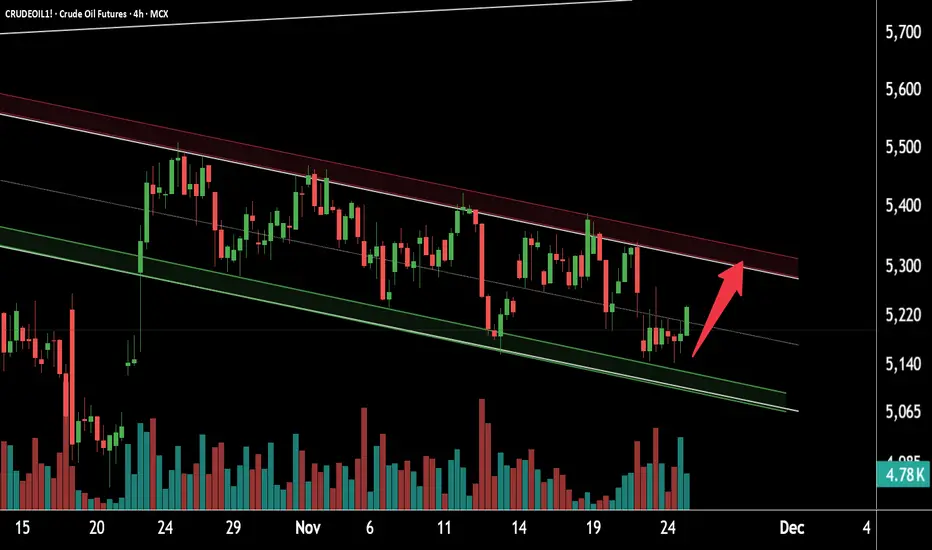
Crude Oil Showing Strong Upside SetupThis is the 4-hour timeframe support zone of Crude Oil.
The price is moving within a falling channel and is currently trading near the support zone at 5050–5100.
Crude Oil is respecting this support and has started taking a reversal.
If the momentum continues, the bullish move may extend towards the resistance zone at 5350–5400.
Thank you.
Fallingflag
NIFTY | Twin Bullish Patterns Signaling Market ConfidenceNIFTY | Dual Bullish Pattern on 15-Minute Timeframe
This is the 15-minute timeframe chart of NIFTY.
NIFTY is currently forming two bullish patterns — a triangle pattern and a falling flag pattern.
If the triangle pattern support breaks, the next strong support lies near the ₹25,550–₹25,600 zone, aligned with the lower boundary of the falling flag.
As long as this support zone holds, NIFTY is likely to resume its upward momentum, potentially heading toward a new high in the ₹26,250–₹26,300 range.
Thank You !!

Nasdaq Analysis Week of May 19th Weekly= Bullish
Daily= Bullish
4H= Bullish
1H= Falling Flag Pattern = Continuation Pattern
30 min & 5 min inverse head & shoulders. Expecting price to respect both patterns and continue up. First TP level around 18664.

CHAYO | Elliott Wave | Correction Projection - 25%Price action and chart pattern trading
> The current price C-wave correction is moving within a falling flag
> Potentially 4-wave uptrend targeting 0.5 retracement of 3-wave approaching / fakeout SMA200 day resistance zone.
> Entry @ SMA200 breakdown
> Target @ 0.5-0.618 Wave 3 extension zone -25% - 30%.
> Stop @ 8% previous 1-wave correction zone
Always trade with affordable risk and respect your stoploss

SHIBUSD | Wave Analysis Mapping - Primary Wave 2 Target RangePrice action and chart pattern trading
> Falling Channel pattern with target downtrend wave 5 within the range of 0650 - 1300 based on 1.236 - 1.618 wave 4 retracement
> Long Entry @ local downtrend line breakout
> Medium-term Target @ upper channel resistance near SMA200 zone / volume profile resistance zone
> Indicator: MACD crossover signal line below the base.
Always trade with affordable risk and respect your stoploss.

ALICEUSDT | Falling Flag - Local Trend Breakout Trade SetupPrice action and chart pattern trading setup
> Falling Flag reversal pattern of local trend
> Entry at breakout downtrend line
> 1st target at previous high zone 0.786 - 1.0 retracement, a possible wave 1 leading diagonal
> 2nd target at wave 3 - 1.618 - 2.0 zone for long term trade
> Stop zone at the lowest position of last wave, RRR: 2.5:1 for medium term trade, downside risk 10 - 15%.
Indicator:
1. strong smart money volume support
2. banker chip multiple entries
3. fund flow reversal pattern
4. BBD signal crossing up baseline 0
5. KDJ stochastic bullish divergence
Always trade with affordable risk and respect your stop-loss
