FARTCOIN - SWING SETUP Bullish breakout daily confirmed on #Fartcoin ✅ 🚀
All my lines looks good for more📈
Levels i'm watching for a SWING play:
0.5500 - 0.5900 - 0.6150 - - 0.6400 - 0.75500
Fartcoin

This Breakdown Could Get Ugly for FARTCOIN Holders…Yello Paradisers! Is FARTCOINUSDT about to fall off a cliff? After printing a clean bearish divergence and breaking down of a rising wedge pattern, the warning signs are stacking up fast. If you’ve been following our latest market updates, this setup should feel very familiar and very dangerous.
💎Recent price action developed within a rising wedge, which has now broken to the downside, typically a bearish continuation signal. Before this, price had been grinding higher with weakening momentum, showing signs of exhaustion as it repeatedly tested resistance. Most importantly, we’ve now seen a clean internal Change of Character (I-CHoCH), confirming that bullish momentum is fading. Price also left behind a Fair Value Gap (FVG), which could still be filled before any further drop. This only adds confluence to the bearish scenario we’ve been tracking.
💎Momentum-wise, a strong bearish divergence appeared on the histogram just as price tapped into the key resistance zone. The red zone above 0.32 is acting as a major supply wall. Unless we see a confirmed candle close above it, the current structure favors the downside. That’s the invalidation level, if bulls reclaim it, the short thesis is off the table. Until then, bears are in full control.
💎Looking ahead, the first key support lies at 0.2713. A breakdown below that could quickly open the door toward the major support zone around 0.2300—a potential -20% decline from current levels. The combination of a rising wedge breakdown, bearish divergence, and heavy rejection at resistance gives this setup a high-probability bearish continuation outlook.
🎖But it never is, and never will be a free ride. Make sure you play it smart, Paradisers; the next 6–9 months will be juicy for some and painful for others. Discipline, patience, robust strategies, and trading tactics are the only ways you can make it long-term in this market.
MyCryptoParadise
iFeel the success🌴

FARTCOIN – Waiting for Key Support Before ReversalWe're watching FARTCOIN closely as it approaches a major support zone between $0.22 – $0.24. On the higher time frames, this level has held strong in the past, and we're hoping to see a bounce here that could signal the start of a trend reversal. Until then, we remain patient, waiting for cleaner entries and signs of strength before jumping in.
⚙️ Trade Setup
Entry Zone: $0.22 – $0.24
Take Profit Targets: $0.32 and $0.40
Stop Loss: $0.19
If we see bullish confirmation around the support, this could be a good spot long opportunity. The upside targets line up with prior resistance levels that could act as take-profit zones if momentum builds.

FARTCOIN buy/long setup (4H)Considering the strong bullish CH and BOS, the liquidity formed below the pivots, and the creation of a QM pattern, we can look for buy/long positions in the zone below the liquidity, which overlaps with the QM level.
Since the stop level is far, it is recommended to trade this setup on spot.
The targets have been marked on the chart.
A daily candle closing below the invalidation level will invalidate this analysis.
Do not enter the position without capital management and stop setting
Comment if you have any questions
thank you

FARTCOIN Reclaiming Key StructureWe are looking at a classic break of market structure. After a downtrend and a notable fakeout earlier, price action managed to break above.
Unlike the previous fakeout, we are seeing constructive consolidation above the demand zone after breaking the descending resistance line.
As long as price holds above the support zone ($0.3280 - 0.3500), the bias remains bullish. I'm definitely looking for a continuation of this momentum.
I will take a buy when the price relief down to support zone to have a better R:R setup.
This setup will be invalidated if price daily closes below $0.2470
Good Luck!

FARTCOIN - Down After a Liquidity Grab?Alright traders, let’s see what kind of nonsense we’re dealing with today.
BTC is still stuck in a range,
no fresh macro,
no big news,
which usually means one thing:
perfect conditions for a liquidity grab.
And if BTC plays the “grab liquidity first” game,
FARTCOIN is more than happy to follow. 😅
The idea here is simple:
a little grab,
a little fake move,
a little “gotcha”…
and then continuation to the downside,
possibly stretching into tomorrow before new macro steps in.
Is this guaranteed?
Of course not.
This is crypto.
BUT…
if this plan actually works,
the risk-to-reward is spicy —
almost 7:1,
which is the kind of math we like. 😄
So yeah,
just a plan,
just an idea,
just crypto doing crypto things.
⸻
👉 Range conditions
👉 Liquidity grab potential
👉 Downside continuation idea
Good luck traders — and may the fart fade gracefully this time 💨📉😄

FARTCOIN – Quick UpAlright traders, gather around.
This setup could disappear faster than an actual fart in your “special place.”
One minute it’s there… next minute it’s gone.
Classic FARTCOIN behavior. 😅
But hey —
I’m still posting it because…
why not?
It looks decent, it looks funny, and honestly, it might even work.
A quick little pop to the upside is possible —
very low commitment, very high meme potential.
Let’s see if this plays out
before it fades into the blockchain forever. 💨😂

FARTCOIN – Liquidity Grab Hunter?Alright traders, let’s give this a shot.
FARTCOIN is sitting on a pile of liquidity underneath,
we’ve got wicks on both the top AND bottom,
which basically means one thing:
👉 Market makers are cooking something.
With FOMC coming up tomorrow, we could easily see some classic
liquidity grabs → fakeouts → stop hunts → emotional damage…
and hopefully a move upwards after the chaos settles.
But hey, this is FARTCOIN —
anything can happen and nothing makes sense anyway. 😅
Let’s see how this plays out.
Stay safe, protect your capital,
and may your positions not evaporate faster than the coin’s name implies. 💨🚀

FARTCOIN Update🚨📊 FARTCOIN Update
FARTCOIN is testing the red resistance zone 🔴.
If breakout happens, the first target will be the green line level 🟩🎯.

Title: FARTCOIN | Breakout Retest and Long-Term Structure PlayAfter a long period of compression, FARTCOIN (FART/USDT) is showing early signs of a potential trend reversal on the 1D chart.
Price has respected a descending resistance line for months while simultaneously forming higher lows on the ascending yellow trendline — signaling that bullish pressure may be building.
Currently, price is testing the intersection point between descending resistance and ascending support, forming what could be a symmetrical triangle breakout setup.
If we can hold above the breakout area and reclaim the mid-structure level (~0.40–0.42), the next technical objectives would be:
TP1: 0.56 – Retest of prior structural resistance
TP2: 0.73 – Measured move from the breakout pattern
TP3: 1.00+ – Potential full cycle expansion target
⚠️ Invalidation:
A daily candle close below 0.30 would suggest a failed breakout and continuation of the prior downtrend.
Educational Breakdown:
This setup is designed to teach how trendline confluence + structural compression can reveal early trend reversal zones.
Notice how the breakout leg aligns with a swing projection pattern, confirming momentum shift probability.
Bias:
Directional Bias: Bullish
Setup Type: Breakout + Retest (Mid-term swing)
Timeframe: 1D

FARTcoin GETTING STRONGFartcoin is getting strong after to reset all the oscillators and now with big green weekly candle can push very high in the coming months

FARTCOIN RoadMap (1D)It seems the price is in an ABC correction, and we are now at the end of wave C.
The green zone is a suitable area for spot buying. We need to see whether the price will make a deeper pullback into the green zone or if it will break out from the red descending trendlines from here.
It appears that one bullish wave in the form of wave C is still remaining on the chart.
Keep in mind that this is a highly volatile memecoin, so you must control your risk and position size.
Since the target for this coin is a large one, the invalidation level is also far away. Therefore, you should pay special attention to the timeframe and risk management.
Let’s see what happens | this is our outlook on FARTCOIN.
For risk management, please don't forget stop loss and capital management
When we reach the first target, save some profit and then change the stop to entry
Comment if you have any questions
Thank You

Letting gas out of the fartcoin trade, back under $1Fart coin looks like shit. Looks to me like the gas has run out of this trade.
If we look at the chart, we can see that price has rejected resistance here and Heikin Ashi candles starting to show the bearish trend starting.
On top of that you have a massive head and shoulders top forming, which would be confirmed under $.88.
I think it's likely that we see the bottom supports get tagged from here.
Invalidation would be a break of $1.53.

fartcoin - update:FARTCOIN - Update:
Bullish setup invalidated ❌
Price broke under key support (0.2280 - 0.230$).
There is no buy pressure yet, and if the 0.200$ level don't hold, then we could see a large sell off toward 0.1600 - 0.1500$ 🔴
Im transparent with you; sometime we lose, but most of time 🏆

#FARTCOIN Price looks set to explode! #FARTCOIN Price looks set to explode! 🚀
✅Triple bottom weekly
✅Bullish H4 candle {breakout]
✅Bull div RSI daily
✅Reversal structure (channel)
✅Highly oversell area (ichimoku weekly).
We may see a 50%+ bull correction from this low area📈
🎯0.400
🎯0.470
🎯0.560
🎯0.600

$FARTCOIN - Long Trade IdeaMEXC:FARTCOINUSDT | 2D
Some alts are holding up surprisingly well during this dump. Looks like a decent spot to take a risk.
FARTCOIN just tapped its low and is still defending the $0.20 area — especially if Bitcoin can hold the 90–88k zone.
Entry: cmp $0.24 to .020
Stop: $0.16
Targets:
tp1 - $0.30-0.36
tp2 - $0.47-0.54
tp3 - $0.82-0.88

FARTCOIN - BULLISH SETUP SHORT TERM SEED_WANDERIN_JIMZIP900:FARTCOIN - short term outlook: 📈
Highly oversell + bull div. Likely bullish to visit upper resistance 📈 (correction only).

$FARTCOIN – The Hot Air’s Running Out?MEXC:FARTCOINUSDT | 15m
Not sure why Farty is nuking here.
.335–.34 looks like resistance, so if I’m going to long this, it’s probably around .325–.32 (ltf base support)
Lose that base, then I’d be looking to pick this up around .25–.20.

FARTCOIN Update📊 FARTCOIN Update
FARTCOIN is currently retracing 🔄
If the price keeps dropping and reaches the green support zone, it could offer a potential long entry — but only with confirmation 💚
✅ Trade smart, not blind.

FARTCOIN - BIG MOVE LOADING? Is #Fartcoin loading for the next big move?
Daily uptrend keep supporting prices nicely (3rd test).
Recently, we saw some #MEMECOIN moving nicely:
like SEED_DONKEYDAN_MARKET_CAP:FLOKI +30% ✅📈 , CRYPTOCAP:DOGE 35%+ ✅📈etc...
The current price is pretty neutral and under some key resistances.
But zooming on the H1, I see a potential ascending channel anticipating another big leg up?? 👀
If the 0.600 - 0.6100$ support zone hold, then I expect to see further price increase (channel play).
Upper key resistances:
0.75500 - 0.6900 - 0.800 - 0.8680
Lower key supports:
0.6300 - 0.61800 - 0.600 - 0.57800

FARTCOIN | Bullish Setup at Key SupportFARTCOIN has retraced into a key support zone between $0.657 – $0.623, presenting a potential opportunity for a long spot position. This zone has historically acted as a strong base for bullish moves, and price action suggests it may hold once again. The current consolidation near this level could set the stage for a continuation to the upside.
📈 Trade Setup:
Entry Zone: $0.657 – $0.623
Take Profits: $0.7123, $0.758, $0.798
Stop Loss: 4H candle close below $0.623
If momentum builds and buyers reclaim control, these TP levels align with resistance zones from previous rallies. A clean break below $0.623 on a 4H close would invalidate the setup and trigger the stop loss.

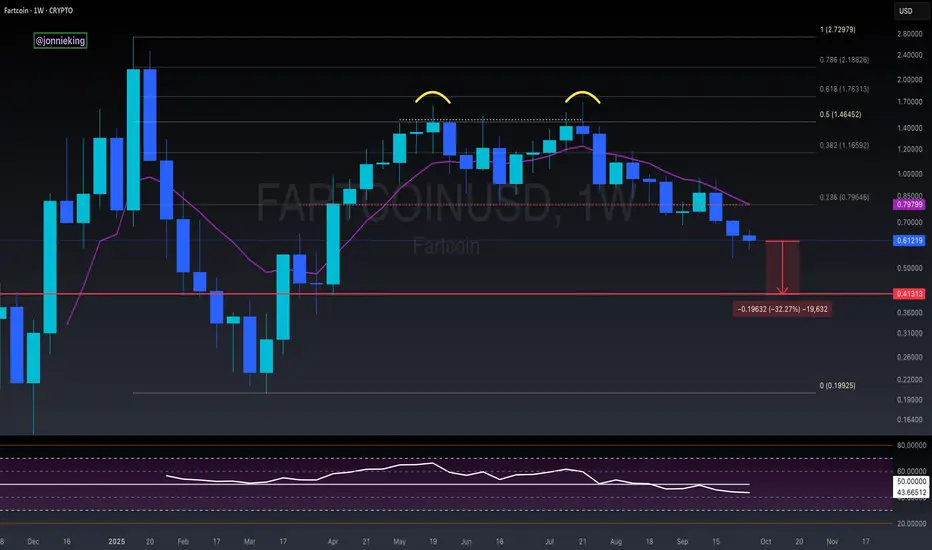
$FARTCOIN On the Brink of Blowing UpThis played out nice 🌬️
$FARTCOIN issuers better close the Week green and retest the 9WEMA soon otherwise could face another ~30% to the downside.
Fartcoin - Double support, strong rebound potentialFartcoin is sitting right on a double support level, which gives the chart a solid base. This setup signals strong rebound potential. If momentum builds from here, we could see a sharp bounce.
