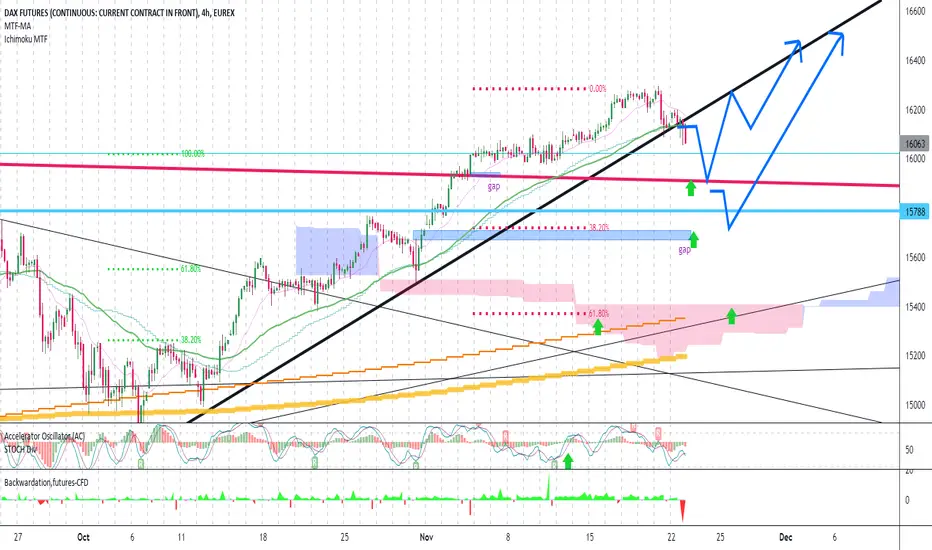
alert of dax fly up fibo 61% and gap in zoom , target of many buyer
be carefull from sell(put sl on day high) , dax can fly up to 1700
if you have buy , dont fear ,main daily chart trend is +++ dax will see 16800-17000 soon (you can put hedge sellstop in low)
Fdax

Weekly Analysis 29th Nov - 4th Dec - horizon after Black FridayFriday's Black Friday introduced significant valuations also on the markets and we met with large anomalies also from the perspective of the Option flow, which we automatically analyze with our software. While we observe a strong directional movement already during the Globex session, it is not worth fighting the trend and it is much safer to try to join it wisely. Anyway, the Gamma Intraday strategy assumes that in the event of breaking the extreme level, we do not fight the trend but try to join the movement. Gamma -1 was broken in the markets during the Overnight / Globex session.
From a medium-term perspective, it's worth going back to the Virgin VPOC levels to assess the potential for moves. The market will try to retest them, the only question is when it will happen. Let's look at the situation on the main instruments:
DAX - a clear downward trend that was deepened during Friday's session. The price is close to the 14946 level, so it should be retested sooner rather than later. The remaining Virgin VPOC levels are above the current price, showing upside potential on the German index - starting at 15,909 with a potential to 16,158.
S & P500 - Friday's panic on the American stock market may only be the beginning of the sell-off. It has been known for a long time that the FED has been pumping sky-high amounts of money for a long time, which causes continuous increases in the S & P500. From the Virgin VPOCs perspective, there is a lot of potential for declines through 4471.50, 4310.25 and ending at 4234.25. This does not negate long-term gains, but it is definitely worth keeping an eye on the downside opportunities.
Gold - despite declines in the main stock exchange indices, we would expect gold to increase significantly in line with the inverse correlation. However, we saw a moderate drop in price on Friday's session and only the end showed the demand entry. Relatively close is the 1763 level, one of the Virgin VPOCs below the current gold price (at the time of writing). The growth potential of Gold looks much more interesting due to Virgin VPOC points at 1817.2 through 1863, 1875.7 with potential at 1885.2
Crude oil - a clear discount on "black gold" on Black Friday, which will surely please drivers at gas stations;) From the perspective of potential, there is a lot of room for growth, with the price reaching 81.37 and 84.22.

dax break trend line , fear of Corona new wave in green arrow we must buy dax with sl=40 and hold 10 day to new high (16500-16600 )
DAX on beginning of new week - based on Options Flow (Gamma)Going to the right, DAX tests investors' nerves and endurance. What can the beginning of a new week bring to us? Overall, we are high in the context (which does not in any way negate further increases for the sake of clarity!). Below the current price level, we have several Virgin VPOC levels, which even extend to the region of 15,200. But the only thing is that EVERY time the index will return there. Not necessarily now;)
In the context of Intraday trading, breaking the Gamma +0.25 level determined automatically based on the Options market - gives the opportunity to play a Long with a target of up to Gamma +0.5. We play it carefully because of Dax's trailblazing in such high places. The exit to Gamma +0.5, because as you already know from previous analyzes, this is a very strong Intraday resistance level. Similar to playing Short as a mirror image of the described move - after Gamma -0.25 goes down, there is an opportunity for Short. Target is Gamma -0.5 (again - strong Intraday support level), but this time we are watching whether there will be a price reaction and a rebound - another opportunity for Long as the Gamma -0.5 level is in the volume zone determined automatically by VSA Scanner. According to the Gamma strategy - a bounce from Gamma -0.5 most often ends statistically at the Pivot level.
Another trading opportunity is a price breakdown at the level determined automatically - Extreme Low of Day (determined from the Options and Volatility market) with the target at the extreme Gamma -1. Here, we also expect a price reaction and a position reversal in Long, where the presence of the volume zone (determined by the VSA Scanner) is an additional strengthening of the signal strength.
The Options Market helps forecast movements that are yet to come in derivatives (including Futures Contracts). Therefore, it is a powerful weapon in the Trader's arsenal and is available to everyone;)

2 gap and daily chart Doji is active on dax for coming days 2 gap in down and reach all time high(record) dont allow dax go up in friday
cash xetra dax chart
fdax (dax futures) daily chart sell DOJI
wait for around 15700 (next low) for buy ,dont hurry for buy
ALERT= technical and dax history say it can back to EMA200 easily too ,dax love EMA200 daily too

DOJI on dax daily come +NFP day let see dax daily chart
gap on fdax and cash xetra dax is open ,can fill (in green arrow we can buy with SL=40 point) for hold 5-6 day
secret= dax love fibo 61% too much ,it can easily pullback to fibo 61%
alert=trade dax need min 5 year practice on demo account before real money , it is very zigzag

dgghfgh rfgfdfg rd zrd dfgdf gdf gd ghfgh rfgfdfg rd zrd dfgdf gdf gd ghfgh rfgfdfg rd zrd dfgdf gdf gd ghfgh rfgfdfg rd zrd dfgdf gdf gd ghfgh rfgfdfg rd zrd dfgdf gdf gd ghfgh rfgfdfg rd zrd dfgdf gdf gd ghfgh rfgfdfg rd zrd dfgdf gdf gd ghfgh rfgfdfg rd zrd dfgdf gdf gd ghfgh rfgfdfg rd zrd dfgdf gdf gd ghfgh rfgfdfg rd zrd dfgdf gdf gd ghfgh rfgfdfg rd zrd dfgdf gdf gd ghfgh rfgfdfg rd zrd dfgdf gdf gd ghfgh rfgfdfg rd zrd dfgdf gdf gd ghfgh rfgfdfg rd zrd dfgdf gdf gd ghfgh rfgfdfg rd zrd dfgdf gdf gd ghfgh rfgfdfg rd zrd dfgdf gdf gd ghfgh rfgfdfg rd zrd dfgdf gdf gd ghfgh rfgfdfg rd zrd dfgdf gdf gd ghfgh rfgfdfg rd zrd dfgdf gdf gd ghfgh rfgfdfg rd zrd dfgdf gdf gd ghfgh rfgfdfg rd zrd dfgdf gdf gd ghfgh rfgfdfg rd zrd dfgdf gdf gd ghfgh rfgfdfg rd zrd dfgdf gdf gd ghfgh rfgfdfg rd zrd dfgdf gdf gd ghfgh rfgfdfg rd zrd dfgdf gdf gd ghfgh rfgfdfg rd zrd dfgdf gdf gd ghfgh rfgfdfg rd zrd dfgdf gdf gd ghfgh rfgfdfg rd zrd dfgdf gdf gd ghfgh rfgfdfg rd zrd dfgdf gdf gd ghfgh rfgfdfg rd zrd dfgdf gdf gd ghfgh rfgfdfg rd zrd dfgdf gdf gd ghfgh rfgfdfg rd zrd dfgdf gdf gd ghfgh rfgfdfg rd zrd dfgdf gdf gd ghfgh rfgfdfg rd zrd dfgdf gdf gd

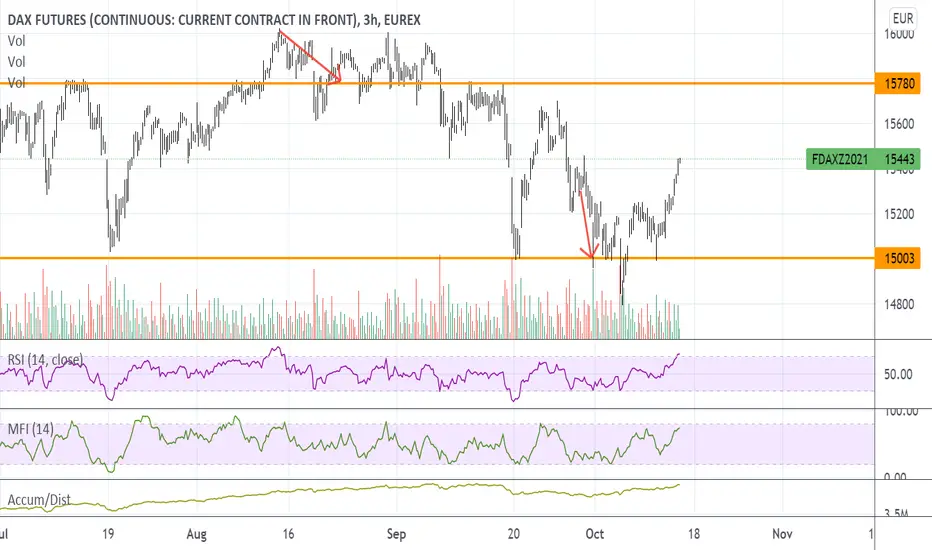
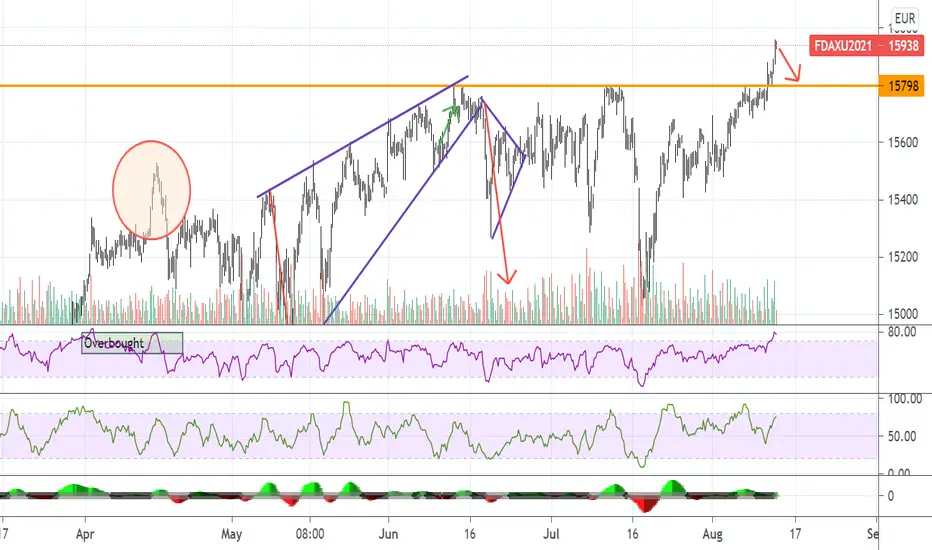
FDAX overboughtRSI overbought MFI almost there.
I wouldn't expect much of a gap up tomorrow, but you never know.

news on dax push it under EMA200 daily ZOOM on above chart
dax now touch powerful support on daily chart(must be low for next 30 day) , we dont belive sell on dax , soon or late it must fly up to fill 2 open gap on cash dax
advice = when dax break ema200 daily (big orange line) looking for buy in deep with sl in low ,dont pick sell signals
alert= dax in 2-3 day can move up 1000 point ,see march 2021/3/9

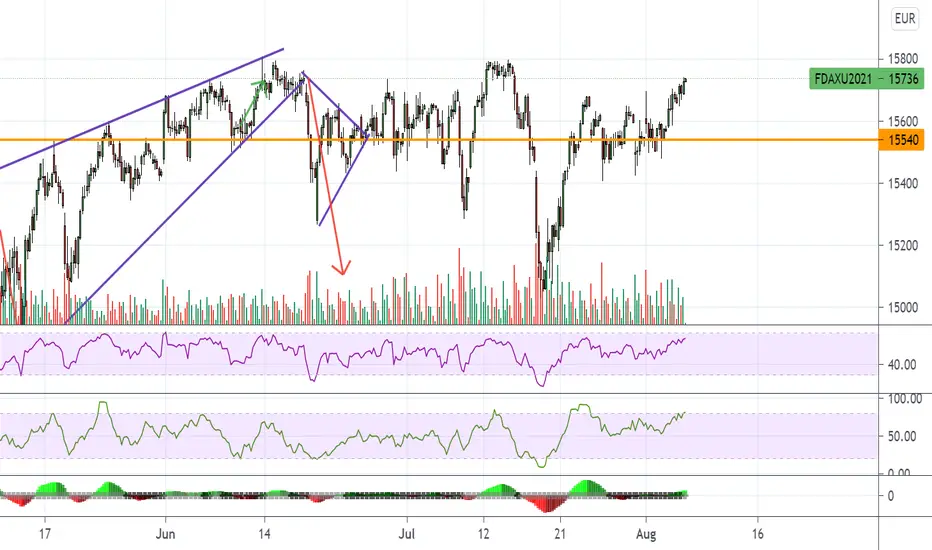
FDAX UpdateLooks to me like it wants to retest support, double bottom if you will.
Indicators look like they want to go oversold again, if FDAX goes down it usually results in a gap down for the US market. Keep in mind ES and NQ are already oversold on the 3 hr if you decide to do a gap play.
Options flow as early call forecast in Intraday TradingOptions flow gives big edge on market, very often predicting moves before they happen on Futures instruments. By applying custom indicators reading Options flow data, it is possible to receive levels that can play important and leading role in Intraday Trading. When we add to this basic understanding of market mechanics, then we can have significant edge in trading. Still this is not Holy Grail, but though accurate strategy. All potential moves are explained and described on charts. Enjoy!

Options flow gives ideas for Intraday Trading - daily projectionOptions flow gives big edge on market, very often predicting moves before they happen on Futures instruments. By applying custom indicators reading Options flow data, it is possible to receive levels that can play important and leading role in Intraday Trading. When we add to this basic understanding of market mechanics, then we can have significant edge in trading. Still this is not Holy Grail, but though accurate strategy. All potential moves are explained and described on charts. Enjoy!

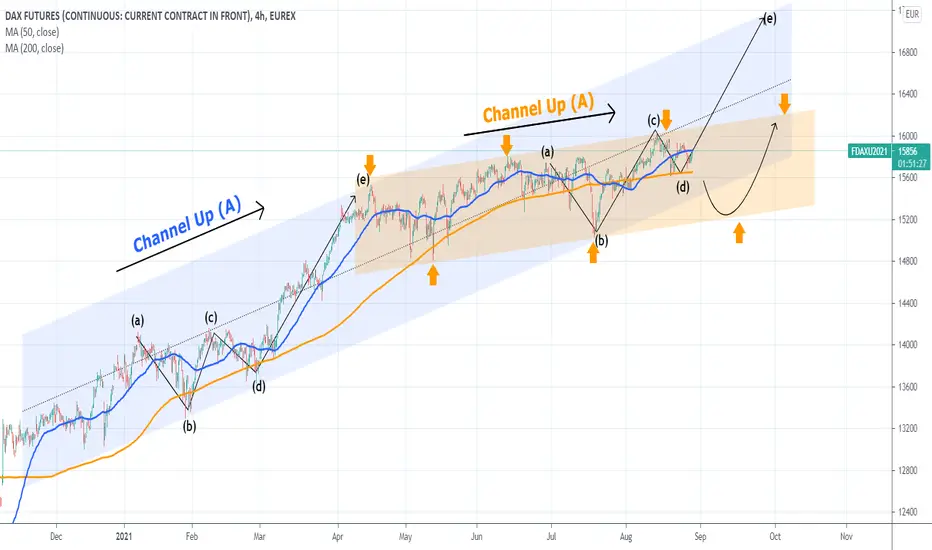
DAX Which Channel will prevail?DAX is ahead of critical crossroads as the long-term Channel Up (blue) that was formed after the November 2020 U.S. elections is on its last leg (d) before the aggressive rally that last time (March-April) led to leg (e).
If this pattern is not repeated, then there is a new Channel Up (orange) that may continue this uptrend but in a more controlled, less aggressive manner. I believe that the signal for this will be a closing below the 4H MA200 (orange trend-line).
Which Channel Up do you think will prevail?
** Please support this idea with your likes and comments, it is the best way to keep it relevant and support me. **
--------------------------------------------------------------------------------------------------------
!! Donations via TradingView coins also help me a great deal at posting more free trading content and signals here !!
🎉 👍 Shout-out to TradingShot's 💰 top TradingView Coin donor 💰 this week ==> nevada999
--------------------------------------------------------------------------------------------------------
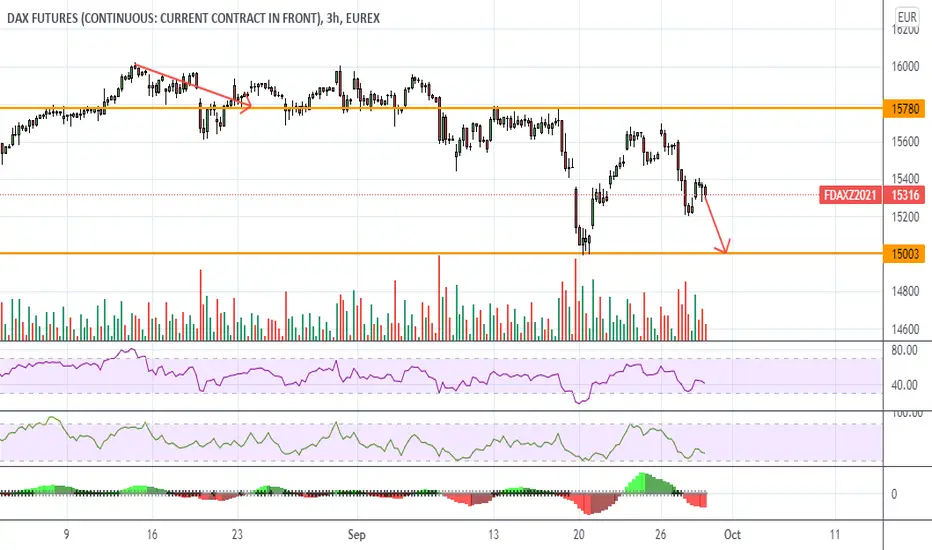
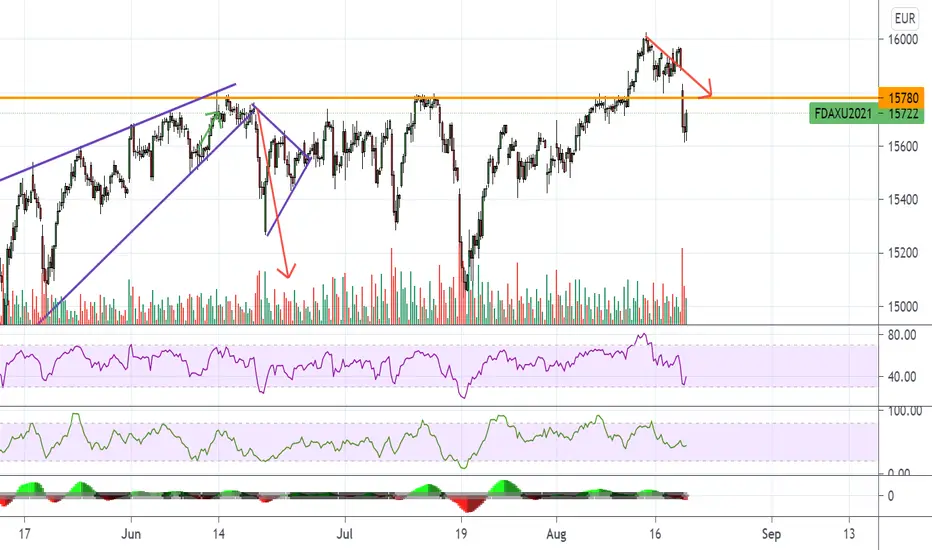
FDAX intraday 25 VIII 21 - Bearish structure Expecting some bearish momentum, that's why I'm looking for Short setups only today.
The best area which offer excelent R:R are levels around supply zone.

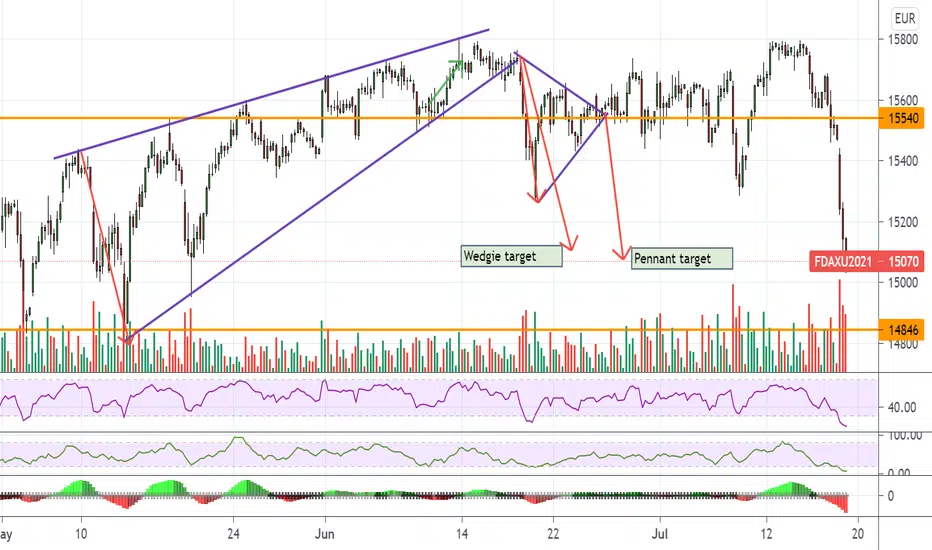
FDAX UpdateTouched oversold and bounced
I warned everyone earlier this week not to go long until FDAX gets oversold, so here we are. All futures gaps must close, so probably a double top coming.
(Futures gap rule depends on index though, Brazil and China don't always fill gaps.)
FDAX OverboughtI have a hard time getting bullish when FDAX is overbought. When it sells off it's usually a gap down for the US market....
Don;t know if it happens tomorrow or Monday
DAX Fractal from 2017 hints to one last HighThis is a fractal comparison for DAX on the 1W time-frame. As shown on the chart, the Channel Up since the October 2020 low has many similarities with the Channel Up since the June 2016 low. They both started after a recovery of the price below the 1W MA50 (blue trend-line) and continued posting Higher Highs for as long as the 1W MA50 was supporting. In 2017 the final peak came in October (one marginal break and rejection in Jan 2018) and then the index corrected back below the 1W MA50, even the 1W MA200 (orange trend-line).
Based on the Fib extensions, the 3.0 level should hold (even with a marginal break below) it and push the index for that last High on the 5.0 level at 16700. Even their RSI sequences seem fairly symmetrical.
** Please support this idea with your likes and comments, it is the best way to keep it relevant and support me. **
--------------------------------------------------------------------------------------------------------
!! Donations via TradingView coins also help me a great deal at posting more free trading content and signals here !!
🎉 👍 Shout-out to TradingShot's 💰 top TradingView Coin donor 💰 this week ==> sikret
--------------------------------------------------------------------------------------------------------

5 August dax : dax try to touch gap in 15800 all trader watching chart when dax will touch 16000
note: AC (or stoch 7.4.4) on 4hour chart turn red now ,if dax can break today high 15710 ,can turn AC to green again(mean new + trend start)
strongly advice stand on buy side(sl=low) above 15500, dont pick sell , green arrow powerful buylimit place sl=40 trailstop=40
www.tradingview.com
for germany and dax news you can use below (use chrome for translate)
www.finanznachrichten.de

DAX Bullish fractalPattern: Channel Up on 1D.
Signal: Buy as long as the 1D MA50 holds or if the Channel Up breaks upwards. The pattern resembles the Nov 2020 - March 2021 Channel.
Target: 16500 (the 2.0 Fibonacci extension).
** Please support this idea with your likes and comments, it is the best way to keep it relevant and support me. **
--------------------------------------------------------------------------------------------------------
!! Donations via TradingView coins also help me a great deal at posting more free trading content and signals here !!
🎉 👍 Shout-out to TradingShot's 💰 top TradingView Coin donor 💰 this week ==> CryptoCreatin
--------------------------------------------------------------------------------------------------------

BULL market can continiue to 2023 this is longterm view (weekly chart)
enjoy bull market , buy in deep ,close on new high ...dax next target is 17000(end of 2021) then will start to 20.000 (after 2008 crash we see 12 year bull market)
for dax daily analyse,each morning check recent analyse on FDAX1!
www.tradingview.com
