FETUSD Will it continue on its historic bullish pattern?Artificial Superintelligence Alliance (FETUSD) has been trading within a 6.5-year Channel Up ever since its first trading day. The pattern's Bullish and Bearish Legs are very distinct and since its March 25 2024 All Time High (ATH), the market has been on the latest Bearish Leg (red Channel).
The 1W RSI just touched its 30.00 oversold barrier and last time it did so on a Bearish Leg (June 13 2022), the bottoming process (Higher Low) started towards the 0.236 Fibonacci level of the multi-year Channel Up.
As a result, FET may start its new Bullish Leg, as long as the overall market remains on a Bull Cycle. The short-term Target is the 1W MA50 (blue trend-line), with which contact can be made around $0.62000. Long-term (again if the Bull Cycle extends) we could see another +6430% Bullish Leg to $8.000.
-------------------------------------------------------------------------------
** Please LIKE 👍, FOLLOW ✅, SHARE 🙌 and COMMENT ✍ if you enjoy this idea! Also share your ideas and charts in the comments section below! This is best way to keep it relevant, support us, keep the content here free and allow the idea to reach as many people as possible. **
-------------------------------------------------------------------------------
💸💸💸💸💸💸
👇 👇 👇 👇 👇 👇
FET

FET Macro flipped long term bearish! Done and dusted?NYSE:FET has disappointed many and continues to be dumped hard. We can see 3 waves up from the very bottom as an ABC followed by a 5 wave structure down that's nearly complete, as weekly RSI hits oversold. No bullish divergence.
The wave 5 structure down resembles a motif wave which means any bullish moves are now corrective and we won't likely see all time highs again but we can still make decent profit.
Once a bottom is found, price should return to $0.6, at least, as counter trend rally / reversion to mean where it may find heavy selling.
Price needs to break $0.84 and find a higher low to flip the structure bullish again, a tough challenge.
Downside 'alt-coin golden pocket' Fibonacci, 0.786 has not been reached yet and is the highest probability area for alts to bottom, $0.13.
Safe trading

$FET is not looking good...NYSE:FET must support no lower than the macro trend line, closing and dropping below could mark the death of this asset.
Bulls need a large bid and soon and could offer incredible returns but i have my doubts at his point!
Conditions are extremely oversold on all time frames.
Safe trading

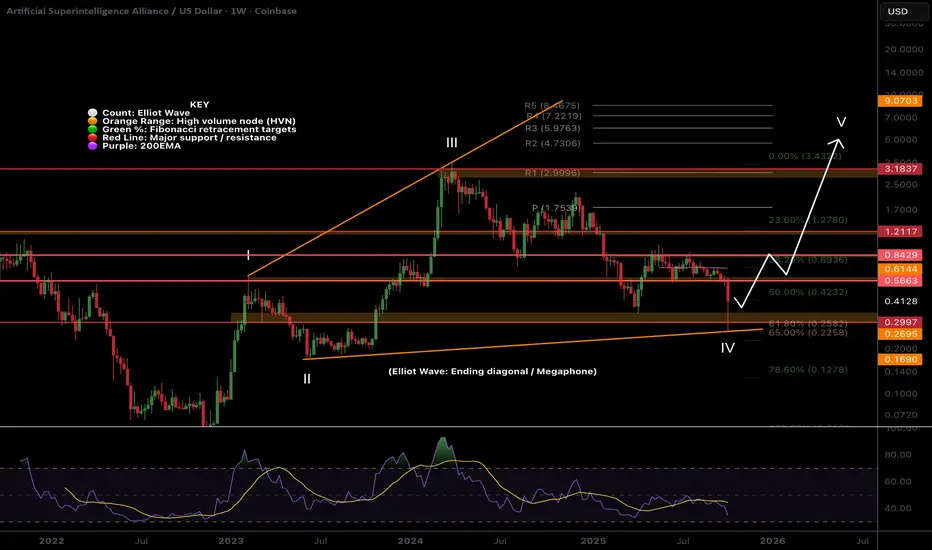
FET extreme opportunity zone!NYSE:FET wave IV megaphone pattern is still in play despite the lower low and is invalidated only if we get blow wave II at $0.1685. This is a complex Elliot wave structure where investors and traders get trapped easily!
Weekly RSI now has bullish divergence forming but is not yet confirmed. Price found support at the major High Volume Node and Fibonacci Golden Pocket, a high probability reversal area!
Wave V has an expected target of the R2 weekly pivot at $4.73 but can over-extend in an exuberant market conditions.
Fetch had one of the largest runs last year offering a 56x from a swing below the SD-3 green opportunity band zone. When an asset moves with such momentum to the SD+3 threshold (where it is expected to spend <1% of the time) momentum is found in the opposite direction and gives way to extreme undervaluation! This is were we strike!
Price has now reached the opportunity green band zone once more quickly catching a bid of 20% as of writing. Price is expected to spend <5% of the time in this zone offering investors a short window of opportunity. It can go lower of course but there is a good chance a bottom is formed in this area! I intend to buy here and I am looking out for longs which give me larger position size than buy and hold due to the nature of the risk management.
Price targets for fair value, where we expect price to return to at least, is currently at $0.60. Another irrational alt-season with backed momentum could see a new all time high towards the $5 range and I will take profits at each band threshold along the way!
FET ROADMAPTo me the view is pretty clear.
* The purpose of my graphic drawings is purely educational.
* What i write here is not an investment advice. Please do your own research before investing in any asset.
* Never take my personal opinions as investment advice, you may lose your money.

FETUSDT UPDATE#FET
UPDATE
FET Technical Setup
Pattern: Bullish falling wedge pattern
Current Price: $0.946
Target Price: $1.71
Target % Gain: 50.32%
NYSE:FET is breaking out of a falling wedge pattern on the 1D timeframe. Current price is $0.946 with a target near $1.71, indicating about 80% potential upside. The breakout confirms bullish momentum, suggesting a potential trend reversal and continuation to higher levels. Always use proper risk management.
Time Frame: 1D
Risk Management Tip: Always use proper risk management.

fet looking good at least for short termformed falling wedge and approaching towards trend line, expecting breakout soon expecting move towards 1$ in case of successful brreakout

FET Secondary trend 19 07 2025Logarithm. Time frame 1 week for clarity.
Main trend is an ascending channel.
Secondary trend is a descending channel
Local trend is a Ross hook, at the median resistance. Reversal zone.
By the way, the trading idea from 2022 FET/BTC is still relevant. Pay attention to where the price is.
FET/BTC Main trend. Pump zone cycles . 2022 06

FET/USDT — Bullish Reversal or Bearish Continuation?FET/USDT is now trading at 0.575 USDT, right inside the critical support zone between 0.50–0.62 (yellow box). This level has been a major battleground since early 2024, repeatedly holding back sellers and triggering strong rebounds.
Looking closely, the chart has formed a Descending Triangle pattern:
Lower highs show persistent selling pressure.
Horizontal support at 0.50–0.62 acts as the last stronghold for buyers.
Price is already near the apex, signaling that a major breakout is likely approaching.
---
🟢 Bullish Scenario
Trigger: a decisive 4D close above the descending trendline and the 0.70–0.78 resistance zone, supported by strong volume.
Narrative: a breakout here would flip the structure into a classic bear trap, trapping shorts and fueling an aggressive rally.
Targets:
TP1 = 0.784 (+36% from current levels)
TP2 = 1.135 (+97%)
TP3 = 1.617 (+181%)
Strategy: safer entry after breakout + successful retest, with stop loss below 0.62.
---
🔴 Bearish Scenario
Trigger: a confirmed 4D close below 0.50 USDT with rising sell volume.
Narrative: once this key support breaks, buyers lose control, and a strong downside move may follow.
Targets:
Breakdown target from pattern = 0.216 USDT (−62% from current levels).
Next historical support lies near 0.16 USDT.
Strategy: avoid long entries during breakdown. Safer approach is waiting for support confirmation below, or consider short setups.
---
📌 Conclusion
FET is standing at a make-or-break zone. The 0.50–0.62 range will decide its next major move:
A breakout could trigger a multi-stage rally,
While a breakdown risks opening a capitulation phase toward much lower levels.
Key point: wait for 4D close confirmation + volume before committing. Patience will define profit.
---
#FETUSDT #FetchAI #CryptoAnalysis #ChartPattern #DescendingTriangle #Altcoin #CryptoTrading #SupportResistance #BreakoutSetup

FET Macro Outlook, Why Hasn't it moved?NYSE:FET macro still appears to be in an expanding megaphone pattern with an expected terminal target of the R2 pivot at $4.73 almost a 10x from here.
After being one of the best performers late 2024 FET drew a lot of attention and trapped a lot of new investors and traders. This attracts whales, who pray on the assets sentiment and hope. They apply continued downside pressure every time it pumps as new traders will get excited about that big profits happening again and this wont stop until everyone capitulates and leaves the asset.
Wave 2 of V appears to be underway with a target of the ascending orange support line.
Analysis is invalidated if we drop below wave IV and head to the High Volume Node support at $0.3 keeping wave IV alive but highly likely terminating there and starting a new uptrend with power.
Price is below the weekly 200EMA and weekly RSI is in bottoming zone but and may print bullish divergence.
I plan to execute longs at the key areas to capture at least a bounce profit if not the bottom.
Safe trading

FET: Still on My Radar, Still Looking BullishA few weeks ago, I pointed out that FET is one of the alts firmly on my radar and that I was looking to add more to my bag. The market has delivered exactly what I wanted to see:
• The coin reinforced support just above 0.55, proving that buyers are very active at this level.
• From there, FET has started to rise again, showing constructive price action
This is in line with my broader outlook from the Total Excluding Top 10 analysis , where I argued that acceleration to the upside could be the next big move for alts.
Trading Plan
For FET specifically, the picture is clear:
• As long as 0.55 holds, dips should be treated as buying opportunities.
• The next logical target in such a breakout scenario is 1 USD, which is both a round psychological level and a strong resistance from the past.
🚀 Strategy: Buy dips against 0.55. Targeting 1 USD in the coming wave.

Long Signal Given on Fetch AIFetch AI runs hot when it goes. Recently, I received a BUY alert from my indicator letting me know that we’re getting close to another run soon. I have entered here and will have a fairly conservative target of .88. My SL is .57, giving me a fairly modest 1:3 rrr. My plan is to sell half at the target and let the rest ride. Of course, that could always change with time, so keep an eye on my trade tracker.
FetchAI · $3.33 · Elliott & Market WavesFetchAI is in a standard situation. Notice how small is the first bullish move. This is always wave 1. Between 7-April and 23-May.
Wave 2 would be the consolidation pattern and here is why I continue to say that the next high will not be the end of the bull market.
Wave 3 is the next advance, the one that will develop after FETUSDT breaks out of the consolidation pattern. The peak can be $3.33 or can be higher.
After this peak, we have wave 4 which is another correction similar to wave 2. The difference is that wave 2 lasted a long while while wave 4 will be quick.
Finally, wave 5 will produce the bull run and potential all-time high. Not all pairs will hit a new all-time high but the highest prices will definitely be reached within the fifth wave.
It is still early for FETUSDT. There is plenty of room left available for growth.
Namaste.

FET Wave 2 Underway, Triangle InvalidatedWave C of 2 appears to be underway for $FET. With the 1:1 extension target from wave A lines up with the golden pocket retracement and S2 daily pivot so is definitely an area to watch.
RSI has room to fall into oversold.
Price failed 2 tests of the descending daily 200EMA, we expect price to break through on the 4th.
Safe trading

Four Coins for the Longer Run – My PlanWhen it comes to crypto, I’m definitely not the “buy & hold to the moon 🚀” type of trader. I prefer realistic targets, good entries, and a clear plan.
That being said, there are a few coins where I’m willing to have more patience, aiming for a 3x or more return.
For the first three (ADA, ALGO, XDC), the ETF story could play a big role in the coming year. FET is a different case, but one I still like. Let’s go one by one.
ADAUSD
- After the ATH above 3 in 2021, ADA collapsed more than 90%, bottoming in 2023 near 0.23.
- That bottom marked the start of a long accumulation phase, followed by an upside breakout in Nov 2023.
- Each correction since then has formed higher lows (0.3 → 0.5), showing strength.
- July’s rise looks constructive, and last week price also broke the falling trendline.
📌 Plan:
Accumulate around 0.9 and below, with DCA reserve if we see 0.65–0.67 zone.
Target: 2.3 in the first phase. Above that, I’ll reassess for a possible run toward ATH.
ALGO
- ALGO’s drop was even harsher, losing more than 90% from its peak.
- Found bottom near 0.1, and despite the spike late last year, it’s mostly still sideways accumulation.
For me, this is exactly the kind of base-building I like to see before a real run.
📌 Plan:
Buy near 0.2, keep reserves for a DCA if it drops again to 0.1.
Target: at least 0.7, then I’ll evaluate if market conditions favor holding further.
XDC
- XDC is more speculative, but also more explosive.
- The structure shows that a 3x to 5x move isn’t unrealistic once momentum picks up.
- With potential ETF headlines in play, it could be a nice upside surprise.
📌 Plan:
First buy zone around 0.07, with DCA reserves at 0.045.
Target: 0.15 in the first stage.
FET – Not About ETFs, But Strong Potential
- Different case here – no ETF talks, but I like the project.
- Already holding from around 0.4.
- If price dips to 0.55, I’ll add more.
📌 Target: 2.0 USD.
Final Thoughts
I’m not aiming for x100 fairy tales. My strategy is simple:
- Enter at accumulation levels
- Use DCA wisely
- Take profits at realistic targets

FET/USDT — Symmetrical Triangle: Ready for Breakout or BreakdownSummary
The FET/USDT (1D) chart is forming a symmetrical triangle — a consolidation pattern where descending highs and ascending lows converge. Price is trading around 0.7020 inside a tight range, with volatility shrinking as it approaches the apex. Major resistance levels are 0.9089, 1.2319, 1.6173, 2.2200, while the key support lies at 0.3444.
---
Pattern Explanation
Pattern Name: Symmetrical Triangle.
Nature: Neutral; direction depends on breakout confirmation.
Context: Formed after a strong downtrend (Dec–Apr) followed by higher lows since April, suggesting possible accumulation.
Key Point: Breakout/breakdown probability increases as the price nears the apex. Always confirm with volume.
---
Measured Move Projection
Triangle height: 2.2200 – 0.3444 = 1.8756.
Breakout projection from ~0.7020 = 2.5776 (long-term measured move target).
Realistically, price will face major resistances first: 0.9089 → 1.2319 → 1.6173 → 2.2200.
---
Bullish Scenario
Confirmation:
Daily close above descending trendline and ideally 0.9089.
Volume expansion above average.
Retest of breakout zone turning into support.
Targets:
Conservative 1: 0.9089.
Conservative 2: 1.2319.
Aggressive: 1.6173 → 2.2200 → measured move ~2.58.
Trading idea:
Aggressive: enter on breakout with stop loss below breakout candle (~<0.65).
Conservative: wait for breakout + retest above 0.9089, enter on retest.
---
Bearish Scenario
Confirmation:
Daily close below ascending trendline.
Volume spike on sell-side.
Retest failure of broken support as resistance.
Targets:
Initial target: 0.3444.
Extended bearish levels: 0.30 → 0.20 if momentum accelerates.
Trading idea:
Short on retest after breakdown or enter on close confirmation.
Stop loss above retest level (e.g. >0.75 if breakdown occurs around 0.70).
---
Key Notes / Risk Management
Watch volume for confirmation, avoid fakeouts.
Confluence with indicators: RSI, MACD, MA 50/200.
Manage risk: use stop loss, avoid overexposure (1–3% per trade).
Keep an eye on fundamentals or project-related news that could trigger sudden volatility.
---
FET/USDT — forming a Symmetrical Triangle near the apex. A breakout above 0.9089 with strong volume could target 1.23 / 1.62 (ext. 2.22 → measured ~2.58). Breakdown below the rising support risks a drop toward 0.344. Always wait for confirmation and manage risk.
#FETUSDT #FET #CryptoAnalysis #TrianglePattern #Breakout #AltcoinAnalysis #SupportResistance #CryptoTrading #TechnicalAnalysis

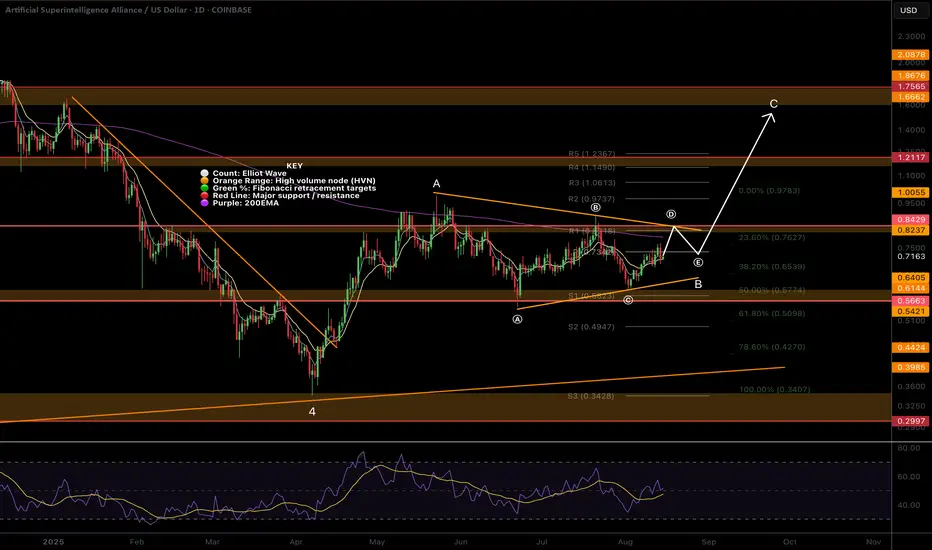
$FET Elliot Wave Updated, Triangle forming?NYSE:FET appears to be printing a triangle in a larger degree wave B of an ABC counter-bear trend correction.
Wave (D) is expected to finish at the descending resistance, poking above the daily 200EMA, while wave (e) is often shallow so expected to end at the daily pivot point. The target is $1.6 at he triangle pattern depth and major High Volume Node resistance.
An ABC corrective wave does not mean that the macro count is invalidated and may form part of larger ending diagonal series of ABCs to achieve my high degree wave 5 targets above all time high. I will update the weekly chart to reflect this shortly.
Safe trading
Will FETUSDT Trap the Bulls Before a Brutal Drop?Yello Paradisers — is FETUSDT setting up the perfect bull trap before a sharp sell-off? The current market structure suggests danger ahead, and ignoring it could be costly.
💎FETUSDT remains in a clear bearish market structure. After taking inducement, price is now moving toward a key resistance zone while following an ascending channel — a combination that typically increases the probability of a downside reversal.
💎If price reaches this resistance zone and begins showing bearish reversal patterns — such as a double top or head-and-shoulders — the odds of a strong move down will rise significantly. For aggressive traders, an early entry could be taken on a confirmed breakdown of the ascending channel, but this is not the safest play, as the risk-to-reward would be poor.
💎However, if FETUSDT breaks and closes above the invalidation level, our bearish idea will be completely off the table. In that scenario, the smarter move is to wait patiently for a fresh setup with cleaner price action before committing capital.
🎖Strive for consistency, not quick profits. Treat the market as a businessman, not as a gambler.
MyCryptoParadise
iFeel the success🌴

#FET/USDT Preparing for a Major Rally ?#FET
The price is moving within a descending channel on the 1-hour frame and is expected to break and continue upward.
We have a trend to stabilize above the 100 moving average once again.
We have a downtrend on the RSI indicator that supports the upward break.
We have a support area at the lower boundary of the channel at 0.655, acting as strong support from which the price can rebound.
We have a major support area in green that pushed the price upward at 0.650.
Entry price: 0.665
First target: 0.688
Second target: 0.716
Third target: 0.750
To manage risk, don't forget stop loss and capital management.
When you reach the first target, save some profits and then change the stop order to an entry order.
For inquiries, please comment.
Thank you.

Mirroring alts - FET weekly update August 10 - 16thFetch.ai (FET) is advancing within a multi-degree Elliott Wave alignment that mirrors the structures seen across many other altcoins. At the Cycle degree, price is in Wave 1; at the Primary degree, a completed 1–2 structure suggests that Wave 3 is now underway; at the Intermediate degree, the same 1–2 formation implies another Wave 3; at the Minor degree, price is currently in Wave 1; and at the Minute degree, price is in the late stages of Wave 3, which is likely to end inside the highlighted Fair Value Gap (FVG).
Once this smaller Wave 3 completes, a short-lived Wave 4 pullback is expected, followed by Wave 5 to finish Minor Wave 1. A deeper retracement into the 0.5–0.764 Fibonacci zone would then be possible as part of Minor Wave 2 before the next sustained advance. The structure remains bullish as long as key support levels hold.
From a sentiment and liquidity standpoint, funding rates are positive, indicating a bias toward long positions. The liquidity heatmap shows only limited liquidity above current price, while there is more liquidity resting below — a configuration that could allow for a quick liquidity sweep before continuation.
This chart pattern is notably similar to many other altcoin structures right now, reflecting the high degree of correlation within the crypto market. If Bitcoin confirms its own bullish wave count, these aligned setups could trigger synchronized breakouts. Conversely, a BTC rejection could weigh on all correlated altcoins, including FET.
In the broader macroeconomic context, the CME FedWatch Tool indicates a 88,9% probability of a Federal Reserve rate cut at the September FOMC meeting. Markets often front-run such decisions, and this could act as a catalyst for impulsive Wave 3 rallies across crypto. However, heavily skewed bullish sentiment increases the risk of a “sell-the-news” event if traders over-leverage ahead of the announcement. Institutional accumulation likely occurred earlier in the cycle, leaving retail traders to drive the next legs higher.
As long as structural support remains intact and the anticipated Wave 4–5 sequence plays out, FET appears well-positioned for continuation — in alignment with the bullish setups currently visible across much of the altcoin market.

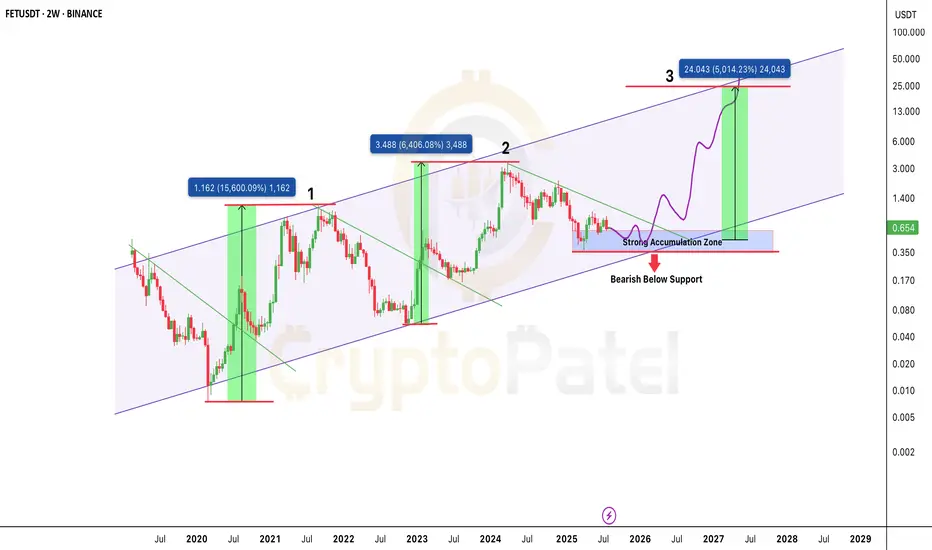
$FET is back in the zone that sparked 15,000%+ rallies?NYSE:FET is back in the zone that sparked 15,000%+ rallies. Same setup. 50x incoming?
FET continues to respect its multi-year ascending channel structure, active since 2020.
Price Action History:
🔹 Wave 1 (2020–2021): +15,600% rally from channel support to resistance
🔹 Wave 2 (2022–2024): +6,400% move following a similar breakout pattern.
🔹 Current Cycle (2025): Price is consolidating in the same accumulation range of $0.35–$0.65.
Key Demand Zone: $0.35–$0.65
Upside Target: ~$24.00 (5,000%+ potential)
🔻 Breakdown Level: Below $0.35 = Structure invalidation
Structure Insight:
Each macro move begins with:
🔹 Accumulation at channel support
🔹 Break of falling trendline
🔹 Aggressive expansion toward the upper boundary
The projected Wave 3 follows this same path if demand zone holds. The structure remains bullish as long as price stays above $0.35.
FET is trading at a high probability accumulation level within a valid macro trend. If history repeats, this could be the next major leg up.
✅ Favor long accumulation strategies
❌ Exit plan needed below $0.35
NFa & DYOR
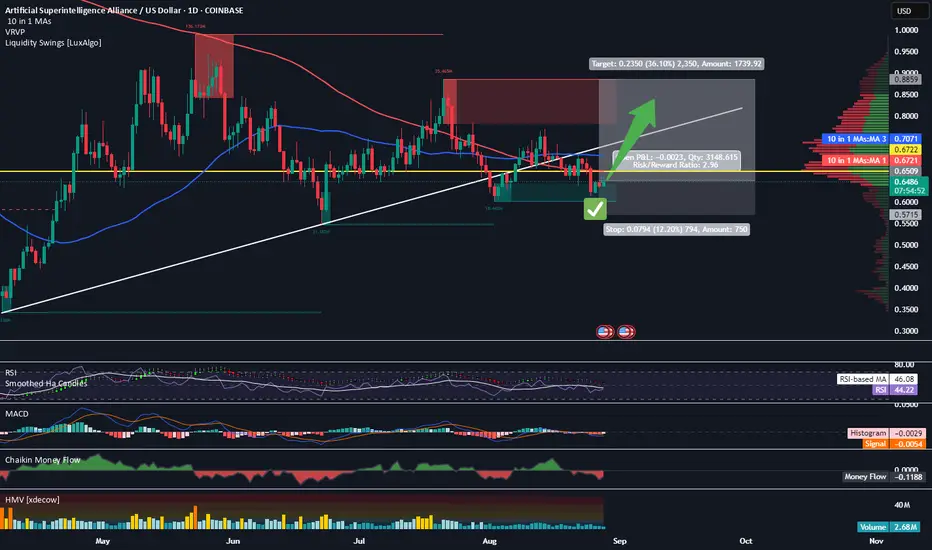
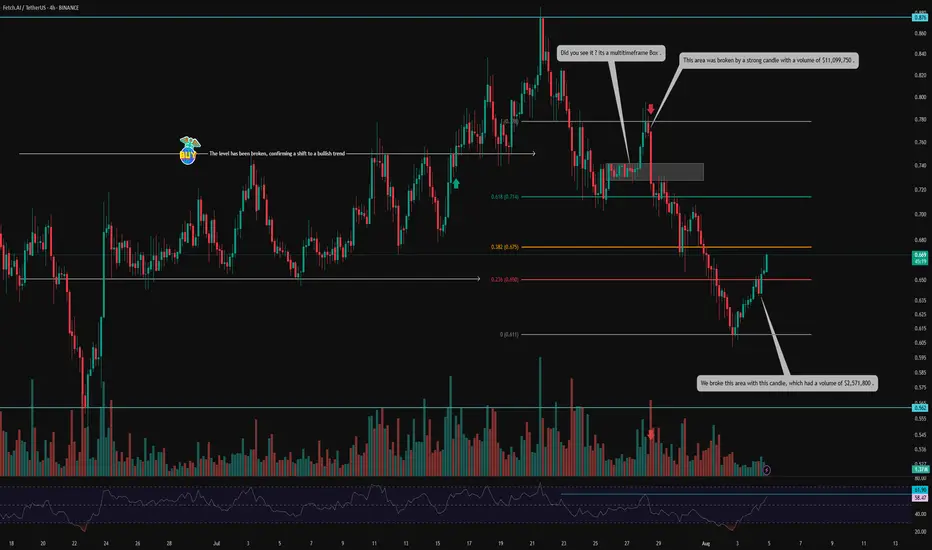
FET on Fire: Volume-Backed V-Pattern Breakout in 4H Structure💀 Hey , how's it going ? Come over here — Satoshi got something for you !
⏰ We’re analyzing FET on the 4-hour timeframe .
👀 After breaking out of its range around $0.75, FET experienced a solid upward move , reaching $0.876 . However , it was rejected from that level and faced heavy selling pressure , eventually forming a consolidation box on the multi-timeframe .
The break of this box, accompanied by rising volume and a total market structure break , led to a move toward the $0.778 resistance , where the price dropped again — this time with significant sell volume .
🎮 The Fibonacci levels in this chart are drawn based on volume-based market activity — specifically from the candle where the sell-off began to the candle where selling pressure ended and a reversal candle formed .
It may sound a bit technical , but the 0.236 Fib level acted as a key V-pattern resistance , which was beautifully broken with a strong $2,571,800 volume, and the candle closed above it .
Following that , traders showed reactions to this level , and the liquidity absorption can be seen in the form of wicks .
🔑 The next important zone is the 0.382 Fibonacci level at $0.675, where we see two possible scenarios :
Reaction and pullback , followed by a breakout .
Breakout first , then a pullback .
You can also place a buy stop at this level — just make sure to use a wider stop-loss .
⚙️ The structure is looking relatively good . The 61.9 RSI region could cause some noise in lower timeframes , but the key area is RSI 70 , which is the entrance to the Overbought zone .
🔼 Volume has been decent , especially considering today is Saturday and a weekend session . This adds more confirmation to the breakout of the V-pattern and the potential end of the correction .
🖥 Summary :
FET is one of those coins with strong recovery potential , operating in the AI sector . It tends to respect classic price action patterns , and with well-drawn Fibonacci levels , volume confirmation , and RSI moving into Overbought , it often activates buy-stop positions cleanly .
💡 Disclaimer :!!! .
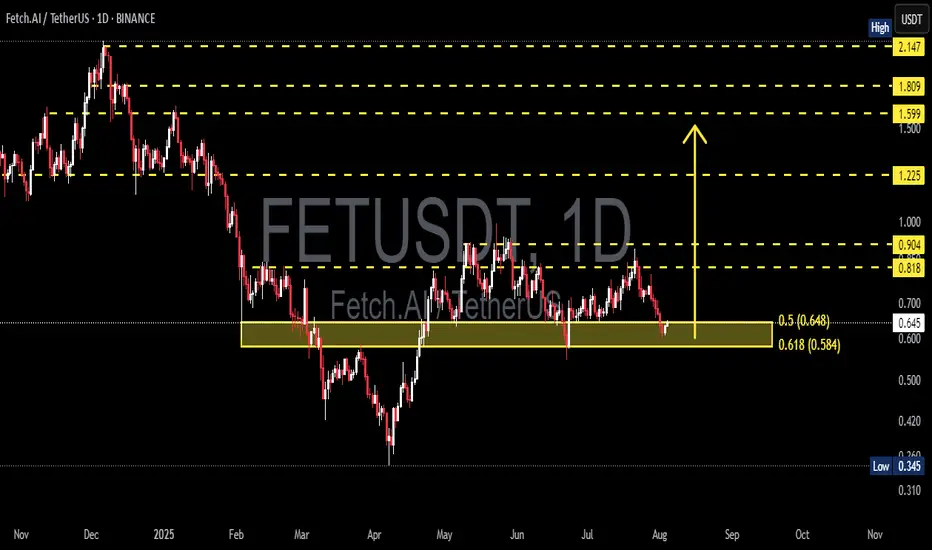
FET/USDT Testing Fibonacci – Bounce Incoming or Breakdown Ahead?📊 Technical Analysis Overview:
FET/USDT is currently testing a strong demand zone aligned with the Fibonacci Retracement 0.5 – 0.618 levels, specifically between $0.648 and $0.584. This “golden pocket” area is historically significant and often acts as a pivot zone for price reversals.
🔍 Chart Pattern:
The price formed a series of higher highs and higher lows from March to June, indicating a bullish structure.
Since July, momentum has weakened, and the price has corrected back into the key support zone that previously acted as a base for a rally.
---
📈 Bullish Scenario:
If price holds above $0.584 and forms a reversal candlestick (e.g., bullish engulfing or hammer), a strong rebound is likely.
Key upside targets:
$0.818 (minor resistance)
$0.904 (psychological level)
Potential breakout toward $1.225 if bullish volume returns.
📉 Bearish Scenario:
A decisive breakdown below $0.584 with high volume could trigger further downside toward:
$0.42 – $0.345 (next major support zone)
This move could confirm a bearish continuation pattern such as a descending triangle if resistance continues to hold.
---
🎯 Strategic Outlook:
The current zone is a make-or-break level, and the market is at a decision point. Traders should wait for a clear confirmation through price action and volume before committing to directional trades.
#FETUSDT #CryptoAnalysis #FibonacciSupport #AltcoinSetup #FetchAI #TechnicalOutlook #BullishOrBearish #SupportZone #GoldenPocket