#FET/USDT bullish momentum#FET
The price is moving in a descending channel on the 1-hour timeframe. It has reached the lower boundary and is heading towards breaking above it, with a retest of the upper boundary expected.
We have a downtrend on the RSI indicator, which has reached near the lower boundary, and an upward rebound is expected.
There is a key support zone in green at 0.2280. The price has bounced from this level multiple times and is expected to bounce again.
We have a trend towards consolidation above the 100-period moving average, as we are moving close to it, which supports the upward movement.
Entry price: 0.2440
First target: 0.2522
Second target: 0.2630
Third target: 0.2765
Don't forget a simple principle: money management.
Place your stop-loss order below the support zone in green.
For any questions, please leave a comment.
Thank you.
Fetch

FET/USDT – Long Trade Setup (Daily)FET/USDT – Long Trade Setup (Daily)
Price forming a base after a strong downtrend
Falling wedge/compression near support
Price below cloud, but selling pressure weakening
Long Plan
Entry Zone: 0.19 – 0.205
Stop Loss: 0.1840
Targets:
T1: 0.26
T2: 0.32
T3: 0.37+
DYOR | NFA

FETUSDTThe overall trend of BINANCE:FETUSDT remains bearish as long as the price stays below the major moving averages. However, a potential bullish correction could start if buyers defend the key demand zone around $0.2100. A break above $0.3400 would strengthen bullish momentum and shift focus toward higher resistance targets.
Supports
$0.2100
$0.1120
Resistances
$0.3400
$0.5500
$0.7800

FET looking more and more like a pump & dump scam.Huge engulfing candle from the oversold threshold just above the 0.786 alt-coin golden pocket.
The trend remains down despite this candle with no bullish market structure yet. The weekly 200EMA is finally turning down. Until we get above the descending trend-line, the probability is lower. The 5-wave structure down hints at no new all-time high, as this is a motif wave.
🎯 Terminal target for the business cycle could see prices as high $1.2 when momentum returns
📈 Weekly RSI tapped oversold with no divergence and can remain here for months
👉 Analysis is invalidated above the weekly pivot
Safe trading

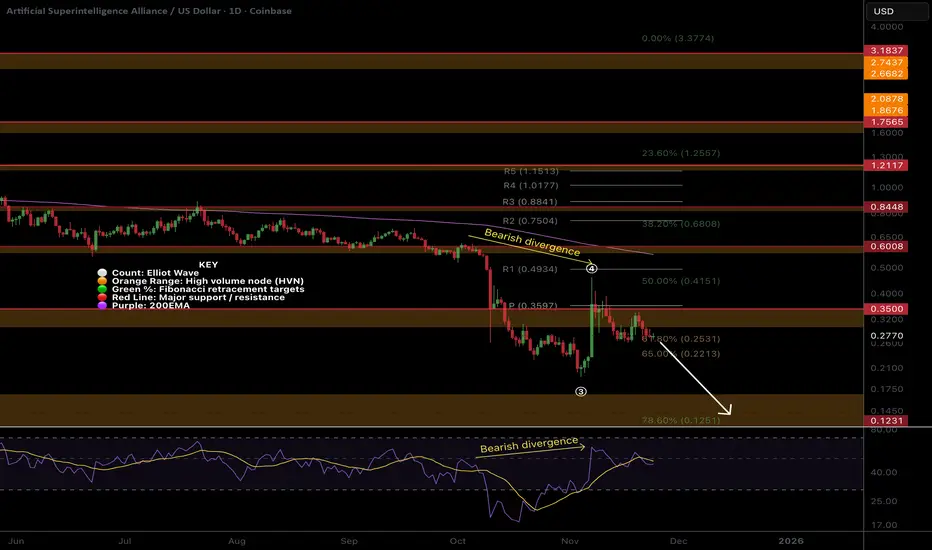
FET looks weak, more downsidePrice bounced with a one-day candle of 70% for wave (4), immediately being rejected on daily bearish divergence.
Chasing candles higher is what’s on the cards of naive investors now. Greed and FOMO immediately took over socials with much gloating, and price humbled them. This is a recipe for lower. Price has lost the High Volume Node, pivot and is well below the 200 EMA.
📈 Daily RSI went too high, too fast, and now has bearish divergence in a bear market, a strong signal.
👉 The next downside target is $0.13
Safe trading
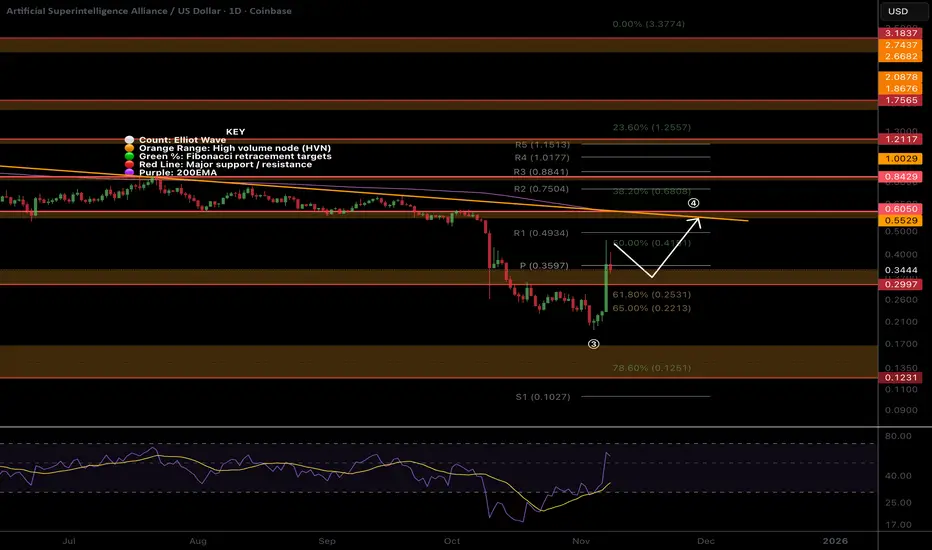
FET, Pump and dump?NYSE:FET Price bounced with a one day candle of 70% recovering the High Volume Node resistance and daily pivot from the golden pocket Fibonacci retracement.
Chasing candles higher is what’s on the cards of naive investors now. Greed and FOMO immediately took over socials with much gloating. This is a recipe for lower, humbling them.
📈 Daily RSI went too high, too fast, and now has bearish divergence in a bear market, a strong signal.
👉 Continued upside has a target of the daily 200EMA and High Volume Node resistance at $0.6.
Safe trading
FET Macro flipped long term bearish! Done and dusted?NYSE:FET has disappointed many and continues to be dumped hard. We can see 3 waves up from the very bottom as an ABC followed by a 5 wave structure down that's nearly complete, as weekly RSI hits oversold. No bullish divergence.
The wave 5 structure down resembles a motif wave which means any bullish moves are now corrective and we won't likely see all time highs again but we can still make decent profit.
Once a bottom is found, price should return to $0.6, at least, as counter trend rally / reversion to mean where it may find heavy selling.
Price needs to break $0.84 and find a higher low to flip the structure bullish again, a tough challenge.
Downside 'alt-coin golden pocket' Fibonacci, 0.786 has not been reached yet and is the highest probability area for alts to bottom, $0.13.
Safe trading

$FET is not looking good...NYSE:FET must support no lower than the macro trend line, closing and dropping below could mark the death of this asset.
Bulls need a large bid and soon and could offer incredible returns but i have my doubts at his point!
Conditions are extremely oversold on all time frames.
Safe trading

$FET bullish momentumHey traders!
It’s been a while since we last talked. This time I bring you my thoughts about FETCH.AI ( NYSE:FET ). Since all the tariff and deepseek staff its mcap valuation decreased significantly.
In my opinion, as it shown us some strenght "jumping" from 0,3$ and consolidating for almost 4 months on 0,6 - 0,9 (50% retracement from its local high) range I think it's a good opportunity to see an expansion movement.
In addition, chartism shows a clear ABC correction movement that has already finished. In my opinion ( ONLY MY OPINION NOT A FINANCIAL ADVICE) we could see a potential impulsive movement on Sept - October.
My targets -> 1,5 - 2,5 - ATH.
Stay safe!

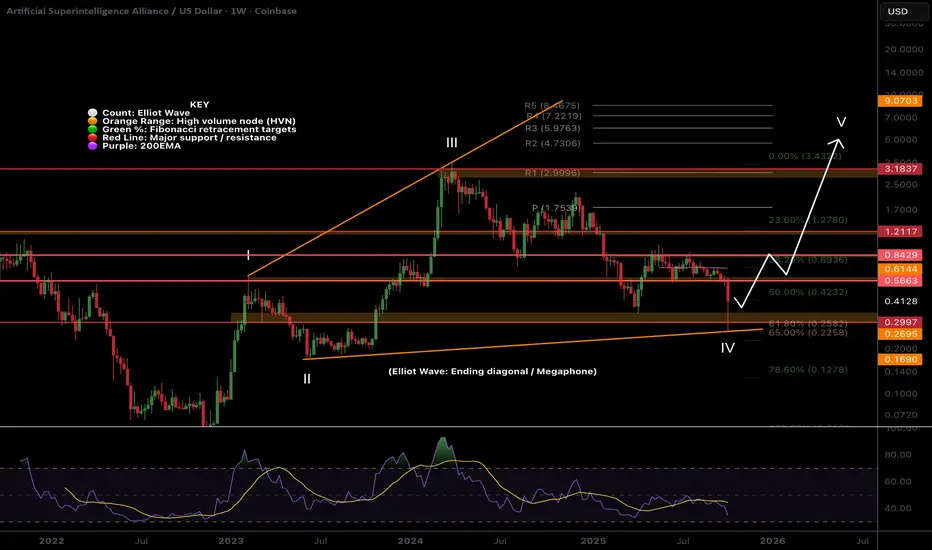
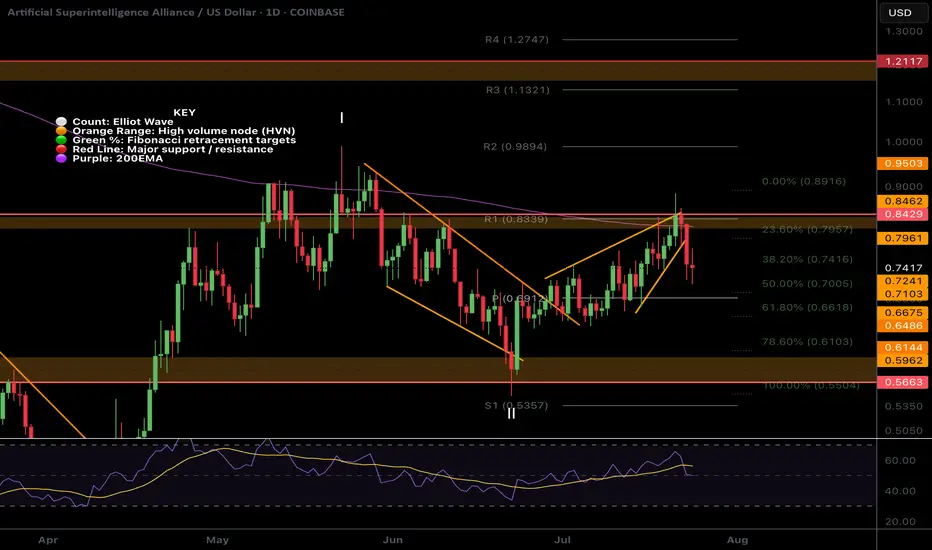
FET extreme opportunity zone!NYSE:FET wave IV megaphone pattern is still in play despite the lower low and is invalidated only if we get blow wave II at $0.1685. This is a complex Elliot wave structure where investors and traders get trapped easily!
Weekly RSI now has bullish divergence forming but is not yet confirmed. Price found support at the major High Volume Node and Fibonacci Golden Pocket, a high probability reversal area!
Wave V has an expected target of the R2 weekly pivot at $4.73 but can over-extend in an exuberant market conditions.
Fetch had one of the largest runs last year offering a 56x from a swing below the SD-3 green opportunity band zone. When an asset moves with such momentum to the SD+3 threshold (where it is expected to spend <1% of the time) momentum is found in the opposite direction and gives way to extreme undervaluation! This is were we strike!
Price has now reached the opportunity green band zone once more quickly catching a bid of 20% as of writing. Price is expected to spend <5% of the time in this zone offering investors a short window of opportunity. It can go lower of course but there is a good chance a bottom is formed in this area! I intend to buy here and I am looking out for longs which give me larger position size than buy and hold due to the nature of the risk management.
Price targets for fair value, where we expect price to return to at least, is currently at $0.60. Another irrational alt-season with backed momentum could see a new all time high towards the $5 range and I will take profits at each band threshold along the way!
FET ROADMAPTo me the view is pretty clear.
* The purpose of my graphic drawings is purely educational.
* What i write here is not an investment advice. Please do your own research before investing in any asset.
* Never take my personal opinions as investment advice, you may lose your money.

FetchAI · $3.33 · Elliott & Market WavesFetchAI is in a standard situation. Notice how small is the first bullish move. This is always wave 1. Between 7-April and 23-May.
Wave 2 would be the consolidation pattern and here is why I continue to say that the next high will not be the end of the bull market.
Wave 3 is the next advance, the one that will develop after FETUSDT breaks out of the consolidation pattern. The peak can be $3.33 or can be higher.
After this peak, we have wave 4 which is another correction similar to wave 2. The difference is that wave 2 lasted a long while while wave 4 will be quick.
Finally, wave 5 will produce the bull run and potential all-time high. Not all pairs will hit a new all-time high but the highest prices will definitely be reached within the fifth wave.
It is still early for FETUSDT. There is plenty of room left available for growth.
Namaste.

FET Wave 2 Underway, Triangle InvalidatedWave C of 2 appears to be underway for $FET. With the 1:1 extension target from wave A lines up with the golden pocket retracement and S2 daily pivot so is definitely an area to watch.
RSI has room to fall into oversold.
Price failed 2 tests of the descending daily 200EMA, we expect price to break through on the 4th.
Safe trading

Four Coins for the Longer Run – My PlanWhen it comes to crypto, I’m definitely not the “buy & hold to the moon 🚀” type of trader. I prefer realistic targets, good entries, and a clear plan.
That being said, there are a few coins where I’m willing to have more patience, aiming for a 3x or more return.
For the first three (ADA, ALGO, XDC), the ETF story could play a big role in the coming year. FET is a different case, but one I still like. Let’s go one by one.
ADAUSD
- After the ATH above 3 in 2021, ADA collapsed more than 90%, bottoming in 2023 near 0.23.
- That bottom marked the start of a long accumulation phase, followed by an upside breakout in Nov 2023.
- Each correction since then has formed higher lows (0.3 → 0.5), showing strength.
- July’s rise looks constructive, and last week price also broke the falling trendline.
📌 Plan:
Accumulate around 0.9 and below, with DCA reserve if we see 0.65–0.67 zone.
Target: 2.3 in the first phase. Above that, I’ll reassess for a possible run toward ATH.
ALGO
- ALGO’s drop was even harsher, losing more than 90% from its peak.
- Found bottom near 0.1, and despite the spike late last year, it’s mostly still sideways accumulation.
For me, this is exactly the kind of base-building I like to see before a real run.
📌 Plan:
Buy near 0.2, keep reserves for a DCA if it drops again to 0.1.
Target: at least 0.7, then I’ll evaluate if market conditions favor holding further.
XDC
- XDC is more speculative, but also more explosive.
- The structure shows that a 3x to 5x move isn’t unrealistic once momentum picks up.
- With potential ETF headlines in play, it could be a nice upside surprise.
📌 Plan:
First buy zone around 0.07, with DCA reserves at 0.045.
Target: 0.15 in the first stage.
FET – Not About ETFs, But Strong Potential
- Different case here – no ETF talks, but I like the project.
- Already holding from around 0.4.
- If price dips to 0.55, I’ll add more.
📌 Target: 2.0 USD.
Final Thoughts
I’m not aiming for x100 fairy tales. My strategy is simple:
- Enter at accumulation levels
- Use DCA wisely
- Take profits at realistic targets

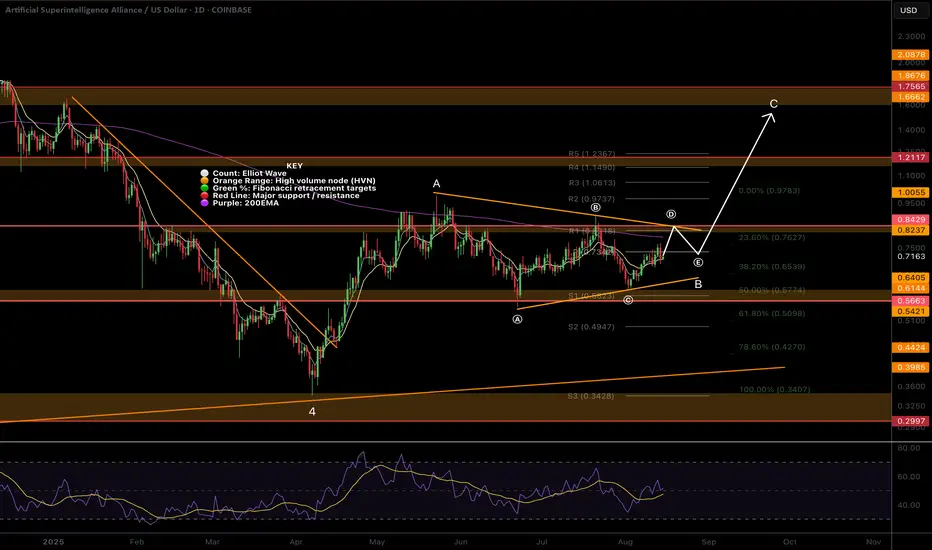
$FET Elliot Wave Updated, Triangle forming?NYSE:FET appears to be printing a triangle in a larger degree wave B of an ABC counter-bear trend correction.
Wave (D) is expected to finish at the descending resistance, poking above the daily 200EMA, while wave (e) is often shallow so expected to end at the daily pivot point. The target is $1.6 at he triangle pattern depth and major High Volume Node resistance.
An ABC corrective wave does not mean that the macro count is invalidated and may form part of larger ending diagonal series of ABCs to achieve my high degree wave 5 targets above all time high. I will update the weekly chart to reflect this shortly.
Safe trading
#FET/USDT Preparing for a Major Rally ?#FET
The price is moving within a descending channel on the 1-hour frame and is expected to break and continue upward.
We have a trend to stabilize above the 100 moving average once again.
We have a downtrend on the RSI indicator that supports the upward break.
We have a support area at the lower boundary of the channel at 0.655, acting as strong support from which the price can rebound.
We have a major support area in green that pushed the price upward at 0.650.
Entry price: 0.665
First target: 0.688
Second target: 0.716
Third target: 0.750
To manage risk, don't forget stop loss and capital management.
When you reach the first target, save some profits and then change the stop order to an entry order.
For inquiries, please comment.
Thank you.

$FET local ending Diagonal and wave 2 near completion?NYSE:FET was rejected for the 4th time at the daily 200EMA! Each time the probability of a breakout increases.
I have adjusted the High Volume Nodes for accuracy.
Locally Fetch appears to have completed a motif wave up with an ending diagonal for wave 5. Wave 2 is expected to find support at the daily pivot and .618 Fibonacci retracement before attempting a breakout of the daily 200EMA once more.
A move below wave II will invalidate this analysis.
Safe trading
$FET Does Zooming out look better?NYSE:FET has been underperforming lately and the local chart looks trash so I wanted to zoom out to give us all some context on the larger picture which hasn't really changed.
Price appears to have completed wave II at the High Volume Node (HVN) support and 0.5- 0.618 'Golden Pocket' Fibonacci retracement and wave 3 is underway but finding local resistance.
Pivots are warped due to the strength of the move last year so wouldn't count them as reliable so focusing on support and resistance. The megaphone pattern is clear and the next area of resistance when FET starts moving is the $1.2
Weekly RSI is decreasing and is attempting to cross bearishly. If Bitcoin has a significant pullback I would expect new lows for FET at this rate. I have a neutral stance at this point.
Analysis is invalidated below $0.546
Safe trading

$FET Ready for the next move up?NYSE:FET looks ready for the next move up with a similar analysis to many other alts I have shared.
It is breaking out of descending resistance after testing the .618 Fibonacci retracement and High Volume Node (HVN) as support. Price broke above the daily pivot and is now swinging below, a recovery above the local swing high will be a bullish signal to go long with a wave 3 target of the R3 daily pivot and major resistance HVN at $1.13.
Analysis is invalidated below $0.54
Safe trading

FET Wave 2 Complete?NYSE:FET (Fetch.ai) appears to have completed a wave 2 pullback and looks set for the next move up towards $1.1
Price swung below the bottom of the wedge, tested the S1 daily pivot and 61.8 Fibonacci golden pocket. It quickly recovered with a bullish engulfing daily candle negating the 3 previous days bearish price action.
A close above the top wedge line and daily pivot will be the signal to go long again.
Analysis is invalidated below $0.54 and that will bring up a downside target of $0.34 which is the ascending macro support from June 2023.
Safe trading

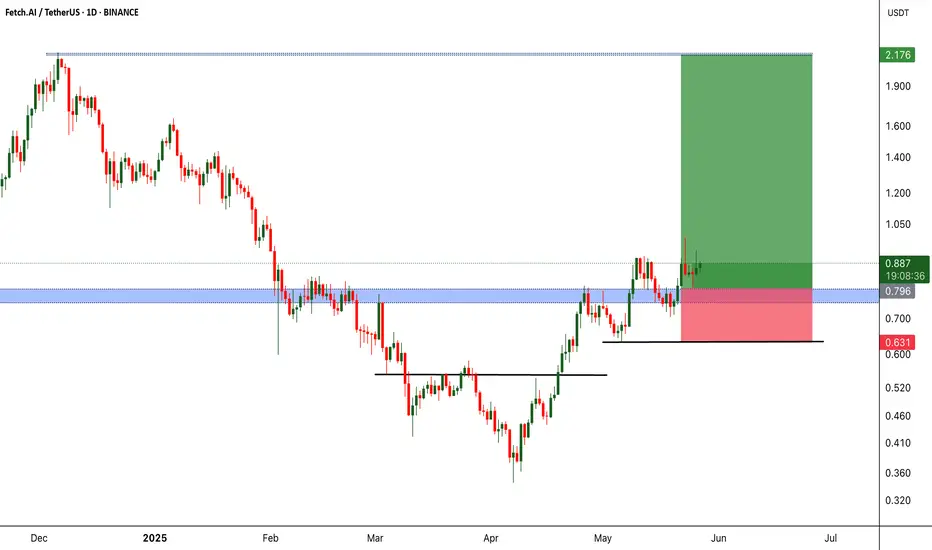
FETUSDT Major Resistance Cracked, Eyes on Sky!BINANCE:FETUSDT has recently broken out from a significant resistance level that previously acted as a strong barrier. After this breakout, the price action displayed a textbook retest of the former resistance—now turned support which held firm, confirming the bullish move.
This successful retracement signals strength in the current uptrend and opens the door for potential continuation towards higher highs. The market structure is showing signs of higher lows and increasing momentum, which could fuel a strong rally in the near term.
While the setup looks promising, it’s essential to emphasize risk management. Always use a stop-loss to protect your capital and manage your position sizing according to your trading plan. The crypto market can be volatile, and smart risk control separates long-term winners from short-term chasers.
All eyes are now on NYSE:FET for its next move. If momentum continues, we could witness a significant upward leg. Stay sharp and let the trend be your guide!
BINANCE:FETUSDT Currently trading at $0.88
Buy level : Above $0.8
Stop loss : Below $0.63
Target 1: $1.1
Target 2: $1.4
Target 3: $2.1
Max leverage 3x
Always keep stop loss
Follow Our Tradingview Account for More Technical Analysis Updates, | Like, Share and Comment Your thoughts
#FET/USDT#FET
The price is moving within a descending channel on the 1-hour frame, adhering well to it, and is heading for a strong breakout and retest.
We are seeing a bounce from the lower boundary of the descending channel, which is support at 0.814.
We have a downtrend on the RSI indicator that is about to be broken and retested, supporting the upward trend.
We are looking for stability above the 100 moving average.
Entry price: 0.823
First target: 0.866
Second target: 0.912
Third target: 0.957

#FETUSDT #4h (Bitget Futures) Falling wedge breakout and retestFetch just regained 100EMA support and looks good for bullish continuation from here.
⚡️⚡️ #FET/USDT ⚡️⚡️
Exchanges: Bitget Futures
Signal Type: Regular (Long)
Leverage: Isolated (4.0X)
Amount: 5.0%
Current Price:
0.7863
Entry Zone:
0.7806 - 0.7504
Take-Profit Targets:
1) 0.8561
1) 0.9244
1) 0.9926
Stop Targets:
1) 0.6897
Published By: @Zblaba
NYSE:FET BITGET:FETUSDT.P #4h #Fetch #AI fetch.ai
Risk/Reward= 1:1.2 | 1:2.1 | 1:3.0
Expected Profit= +47.3% | +83.0% | +118.7%
Possible Loss= -39.6%
Estimated Gaintime= 1-2 weeks
