The History of War, Gold, Fiat, and EquitiesGold vs. Equities — The 45-Year Cycle and a Pending Monetary Reset
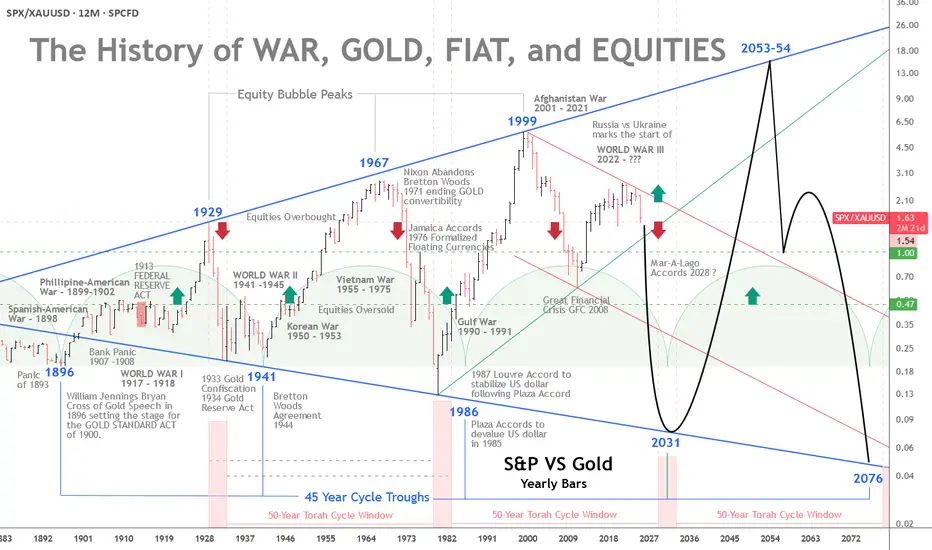
The interplay of war, gold, fiat money, and equities has long been a barometer of real wealth and economic stability. A recurring pattern emerges across modern history: approximately 45-year intervals when gold strengthens relative to equities.
From the Panic of 1893 to the present, these cycles have coincided with major monetary shifts and geopolitical shocks.
With a broadening 100-year pattern, rising geopolitical tension, and roughly $300 trillion in global debt, a monetary reset by the early 2030s is plausibly on the horizon.
The 45-Year Cycle — Gold’s Strength at Equity Troughs
The pattern’s first trough is traced to 1896, when William Jennings Bryan’s “Cross of Gold” speech preceded the Gold Standard Act of 1900. Equities were weak after the Panic of 1893, and gold gained prominence. Thirteen years later, the Federal Reserve would be created. More on the 45-year cycle later.
The 50-Year Jubilee Cycle
The Torah’s 50-year Jubilee cycle, as outlined in Leviticus 25:8–12, is a profound economic and social reset that follows seven 7-year Shemitah cycles, totaling 49 years, with the 50th year designated as the Jubilee.
Each Shemitah cycle concludes with a sabbatical year (year 7, 14, 21, 28, 35, 42, 49), during which the land rests, debts are released, and economic imbalances are addressed (Leviticus 25:1–7).
The Jubilee, occurring in the 50th year, amplifies this reset by mandating the return of ancestral lands, freeing of slaves, and further debt forgiveness, symbolizing a divine restoration of societal equity.
While built on the 49-year framework of seven Shemitahs, the 50th year stands distinct, marking a transformative culmination rather than a simple extension of the Shemitah cycle.
The five-year Jubilee windows highlighted at the base of the chart compliment the 45-year cycles previously noted. The 4 year Jubilee windows are projected from the roaring 20s peak in 1929 and the 1932 bear market low four years later.
The next Jubilee window is scheduled to occur some time between 2029 and 2031.
Returning to History and the 45-Year Cycles:
The Panic of 1907 and the Fed
The Panic of 1907 was a severe crisis, with bank runs, failing trust companies, and a liquidity crunch centered in New York. The collapse of copper speculators (F. Augustus Heinze and Charles W. Morse) triggered runs on institutions like the Knickerbocker Trust.
Private bankers led by J.P. Morgan injected liquidity (over $25 million) to stabilize the system. The shock exposed the absence of a lender of last resort and precipitated reforms.
Congress responded with the Aldrich–Vreeland Act (1908) and the National Monetary Commission, whose 1911 report recommended a central bank to supply “elastic currency.”
After debate and hearings, President Woodrow Wilson signed the Federal Reserve Act on December 23, 1913, creating a decentralized central bank with 12 regional banks.
Some alternative accounts (e.g., The Creature from Jekyll Island) argue that the panic was exploited to centralize financial control. Mainstream history, however, treats the panic as the genuine catalyst for reform.
Whatever the intent, the Fed’s creation shifted the tools available to manage crises—and, over time, central banks have played an instrumental role in financing wars and expanding Fiat currency.
The Fed and World War I
World War I began in Europe in 1914 (U.S. entry in 1917). The Fed began operations in November 1914 and later supported wartime financing by:
Marketing Liberty Bonds (~$21.5 billion raised, 1917–1919).
Providing low-interest loans to banks buying Treasury securities (via 1916-era amendments).
Expanding the money supply, which contributed to wartime inflation.
Although the Fed was created primarily to prevent panics and stabilize banking, its early role in war finance shifted expectations about central banking’s functions.
From Confiscation to Bretton Woods to the Nixon Shock
In 1933, during the Great Depression, the U.S. effectively nationalized gold—private ownership was outlawed, and the official price was later reset at $35/oz by the Gold Reserve Act of 1934. Private ownership remained restricted until President Ford legalized it again in 1974.
World War II and the Bretton Woods Agreement (1944) cemented gold’s role: the dollar became the anchor of the system, and other currencies pegged to it.
That status persisted until August 15, 1971, when President Nixon suspended dollar-gold convertibility—the “Nixon Shock”—moving the world toward fiat currencies.
The Petrodollar and Post-1971 Arrangements
After 1971, the U.S. worked to preserve dollar demand. The petrodollar system emerged in the early 1970s: following the 1973 oil shock, a U.S.–Saudi understanding (1974) helped ensure oil continued to be priced in dollars and that oil revenues were recycled into U.S. Treasuries—supporting the dollar’s global role despite its fiat status.
Devaluations, Floating Rates, and the End of Bretton Woods
Two formal “devaluations” followed the Nixon Shock:
Smithsonian Agreement (Dec 18, 1971): Raised the official gold price from $35 to $38/oz (an 8.57% change) as a stopgap attempt to stabilize fixed rates without restoring convertibility. It widened exchange banding but proved unsustainable.
On February 12, 1973, the official gold price was revalued to $42.22/oz (roughly a 10% change), a symbolic acknowledgment that Bretton Woods was collapsing. By March 1973, major economies had effectively moved to floating exchange rates, and market gold prices surged.
These moves were reactive attempts to adjust the dollar’s value amid trade deficits, inflation, and speculative pressures. They ultimately ushered in a fiat era, where market forces, not official pegs, set the price of gold.
Triffin’s Dilemma — Then and Now
Triffin’s Dilemma describes the structural tension faced by a reserve currency issuer: it must supply enough currency to ensure global liquidity (running deficits) while risking domestic instability and a loss of confidence.
Britain faced this under the gold standard; the U.S. faced it under Bretton Woods and again after 1971, albeit in a different form.
Modern manifestations include inflation, persistent fiscal and external deficits, and mounting debt. International policy coordination (e.g., the Plaza and Louvre Accords) repeatedly tried—and only partially succeeded—to manage these tensions.
The Plaza (1985) and Louvre (1987) Accords
Plaza Accord (Sept 22, 1985): G5 nations coordinated to depreciate the dollar (it had appreciated ~50% since 1980). The goal was to ease U.S. trade imbalances. The dollar fell substantially vs. the yen and mark by 1987.
Louvre Accord (Feb 22, 1987): G6 sought to stabilize the dollar after its rapid decline following the Plaza Accord, setting informal target zones and coordinating intervention. It temporarily checked volatility but did not solve underlying imbalances.
Both accords illustrate the extreme difficulty in balancing global liquidity needs with domestic economic health in a fiat system.
De-industrialization, Bubbles, and the Broadening Pattern
Orthodox history would argue that U.S. de-industrialization in the 1990s was rational at the time. Globalization and cost arbitrage provided short-term benefits, but they increased trade deficits, foreign dependency, and robbed the middle class of high-paying jobs. That loss of capacity heightens vulnerability to dollar shocks and complicates any re-industrialization efforts today.
Measured in gold, equities have experienced expanding ranges:
Equity peaks (1929, 1967, 1999) were followed by troughs where gold outperformed (1896, 1941, 1980/86).
Gold peaked in 1980, even though the cyclical trough in the broader pattern was nearer 1986—showing that cycles can shift.
The dot-com peak (1999) marked a secular low for gold relative to equities. The ensuing crashes, 9/11, and the War in Afghanistan, followed by the 2008–2009 Financial Crisis (GFC), moved markets profoundly—both nominally and in terms of gold.
From 1999, relative equity values fell until a trough around 2011 (coinciding with the European debt crisis). Quantitative easing and policy responses (2010 onward) restored growth, but frailties remained (e.g., repo market stress in 2018).
COVID produced another shock; aggressive fiscal and monetary responses engineered a V-shaped asset recovery but also higher inflation.
Relative to gold, equities peaked in 1999 and have trended lower since. As nominal stock prices register all-time-highs in dollars—fueled by AI and other themes—equities are historically overvalued. When priced against gold, the apparent bubble in nominal terms looks more like an extended bear market ready for its next down-leg.
The Broadening Pattern and the Next Trough
A broadening pattern illustrates the gold equity ratio range expanding with each major peak and trough. If we accept a roughly 45-year rhythm from the 1980/86 period, the next cyclical trough may fall between 2025 and 2031, with 2031 a focal point. Whether this manifests as a runaway gold price, a sharp equity collapse, or both remains uncertain.
If a sovereign-debt crisis or major war escalates, changes could accelerate—some scenarios even speculate about a negotiated new monetary framework (e.g., “Mar-A-Lago Accords”) in the next 5–15 years.
Geopolitics and the $300 Trillion Debt
Geopolitical tension compounds financial stress. The Russia-Ukraine war, plausibly the start of World War III, NATO involvement, and nuclear saber-rattling evoke systemic risk. Global debt—estimated at around $300 trillion (over 300% of GDP per the Institute of International Finance)—is unsustainable.
U.S. public debt (~$38 trillion) now carries interest costs comparable to defense spending.
Central bank money creation to service debt erodes confidence in fiat currencies and boosts demand for gold. Historical monetary resets (Bretton Woods, Nixon Shock) followed similar pressures of debt and conflict.
A modern reset could push gold well beyond current records—potentially into the high thousands or five-figure territory if confidence collapses.
Implications of a Pending Monetary Reset
A reset might take various forms:
A partial return to a gold-linked standard, perhaps supplemented by tokenized/digital assets.
Forced debt restructuring or coordinated global defaults.
Rapid adoption of digital currencies (including state-issued tokens—CBDCs) as part of a new settlement architecture.
Given Triffin’s Dilemma, inflated financial assets, and interconnected global linkages, a modern reset could be far larger in scale and speed than past adjustments. Assets, trade, and supply chains are far larger and more intertwined than in 1971, increasing contagion risk.
Practical takeaway: investors should consider gold’s role in portfolios; policymakers must confront debt sustainability or risk a market-driven reckoning that could disrupt global finance.
Conclusion
The Torah's 50-year Jubilee, the 45-year cycle and the century-long broadening pattern suggest we are approaching a structural turning point.
Triffin’s Dilemma, decades of accumulated imbalances, de-industrialization, and escalating geopolitical risk suggest a monetary reset is plausible between 2030 and 2035—possibly sooner under severe stress.
A modern reset would be more disruptive than past episodes because today’s global economy is larger, more integrated, and technologically complex. The question is not only whether such a reset will occur, but how policymakers and markets will manage it.
The stakes—global financial stability and the relative value of fiat versus real assets—could not be higher.
Fiat
DOW JONES TO 111 THOUSAND..in the the 2030's.
as an investor you must be thinking 2 decades down the line.
NOT 2 quarters.
They can not
stop
printing #FIAT
it's in the code.
A 8% compound rate puts the Dow Jones at 85,000 in 2034.
I'm long forever.

XRP's Rollercoaster: Institutional Moves and Market DynamicsThroughout the first part of February, XRP holders have experienced significant consolidation, prompting many retail traders to exit their positions. There are several potential reasons for this consolidation:
Institutional Influence: Large institutional players, often referred to as "whales," may have influenced the market to push retail traders out, allowing them to acquire XRP at lower prices. This strategy isn't new; historically, similar tactics have been seen with fiat currencies and even physical silver.
Let's not forget, the maximum supply of XRP is capped at 100 billion tokens. Ripple Labs, the company behind XRP, created this total supply in 2012. Currently, about 55 billion XRP are in circulation, with the remaining tokens held in escrow by Ripple Labs, set to be fully released by April 2027. Recently, Ripple Labs established a connection to the SWIFT (Society for Worldwide Interbank Financial Telecommunication) system, which has approximately 11,000 financial institutions connected to it. If we hypothetically distributed all XRP tokens evenly among these institutions, each would hold around 9 million XRP tokens. However, distribution isn't likely to be even, especially considering the immense combined assets of major institutions like JPMorgan Chase, Bank of America, BNY Mellon, HSBC, and BNP Paribas, which total $63 trillion. If these five institutions alone were to own all XRP, each XRP would theoretically be valued at $630.
The global foreign exchange (FOREX) market has an annual trading volume of approximately $2.73 quadrillion. This staggering amount highlights the potential for XRP to facilitate vast transactions and perhaps even surpass Bitcoin in value. While Bitcoin relies heavily on investor sentiment, XRP has the infrastructure to support potentially quadrillions of dollars in transactions annually.
Ripple's Stablecoins vs. USDC: Ripple has introduced several stablecoins, such as RLUSD, RLGBP, RLEUR, and RLJPY, designed to enhance the utility and liquidity of XRP. These stablecoins are pegged to major currencies and are fully regulated, backed by banks, and custodied by U.S. financial institutions. By integrating these stablecoins into the XRP ecosystem, Ripple aims to bridge traditional financial institutions with decentralized finance (DeFi) ecosystems. This dual compatibility enhances Ripple's Automated Market Makers (AMMs) and token issuance functionalities, creating a robust infrastructure for pricing Real-World Assets (RWAs) and Forex trades in USD. Additionally, Ripple's stablecoins incentivize XRP liquidity through USD-XRP trading pairs, potentially capturing yield opportunities currently monopolized by centralized exchanges.
Governments around the world have expressed concerns about transactional transparency, particularly with stablecoins like USDT (Tether). Due to its lack of transparency and regulatory compliance, USDT has faced scrutiny and restrictions. In contrast, USDC (USD Coin) emphasizes regulatory compliance and transparency through regular audits, making it a more trusted and widely accepted stablecoin. Ripple's stablecoins, with their focus on transparency and compliance, are positioned to gain favor over USDT in global markets.
Global Uncertainty: Governments and global corporations have also played a role in the recent consolidation, particularly due to uncertainties about the impact of tariffs implemented by President Trump on the global economy. Additionally, many are anxiously awaiting the outcome of the SEC lawsuit against Ripple Labs and the U.S. government's decisions regarding a potential crypto reserve and the direction of new SEC leadership and the newly appointed Crypto Czar.
What can we expect next? Regular chart analysis suggests a short-term pullback to $1.47 by late February, which could present an excellent buying opportunity. By mid-March, we might see XRP rise to $3.84, yielding a 65% gain from today, February 7, 2025.
The future of XRP is still uncertain. Will whales push XRP to rock bottom again to shake out small retail traders? Or will we see a breakthrough with the SEC lawsuit being dismissed or settled, propelling XRP beyond $3.84 towards potentially hundreds of dollars per token? The next quarter will be critical, and it promises to be an interesting time for XRP holders.

PENDLE RWA Bullish Chart prediction 2025Pendle has been excellent in 2024. The project is delivering and moving to the Top 50 is possible.
Given its market cap to be sitting around $600M only, means it can have the same upside as AAVE as PENDLE is RWA and tokenization for LINK and Axelar. If you don’t hold PENDLE in your portfolio, you can enter at $4.
Future Potential: Pendle's real-world asset (RWA) tokenization offers new opportunities for investment and liquidity. By bridging traditional finance with blockchain, PENDLE could become a key player in the evolving financial landscape.
Latest News: Pendle Expands Tokenization Services to New Markets
Usual Labs, the firm behind the DeFi protocol Usual, altered the code for its bond-like USD0++ token, reducing its fixed price from $0.995 to $0.87, causing chaos among DeFi apps that treated USD0 and USD0++ as equal in value.
The change, which Usual claims was announced and planned since October, caught many investors and developers off guard, leading to criticism over poor communication.
The price adjustment has disrupted DeFi integrations, with users of protocols like Pendle potentially facing losses due to the devaluation of USD0++ principal tokens.
USD0 is a stablecoin pegged to the dollar and backed by real-world assets, while USD0++ is a staked version locked for four years, previously redeemable at a one-to-one ratio for USD0.
Usual has updated its documentation to reflect the $0.87 redemption floor, but a conditional exit allowing one-to-one redemption for USD0 is expected next week, requiring users to forfeit some accrued yields.
Concerns remain about the profitability of holding USD0++ until maturity, with industry figures like Aave's Stani Kulechov warning of potential long-term losses.

Currency Wars: Exploring BTC/Fiat Ripple Effects on Key Markets1. Introduction
In today's interconnected financial markets, major fiat currencies like the Euro (6E) and Yen (6J) play a critical role in influencing USD-denominated assets. The relative strength between these currencies often reflects underlying economic trends and risk sentiment, which ripple across key markets like Treasuries (ZN), Gold (GC), and Equities (ES).
However, Bitcoin (BTC), a non-traditional digital asset, introduces an interesting divergence. Unlike fiat currencies, BTC's behavior during periods of significant market stress may reveal a unique relationship to USD movements. This article explores:
The relative strength between the Euro and Yen.
Correlations between fiat currencies, BTC, and USD-denominated markets.
Whether BTC reacts similarly or differently to traditional currencies during market volatility.
By analyzing these dynamics, we aim to identify how shifts in currency strength influence assets like Treasuries while assessing BTC’s independence or alignment with fiat markets.
2. Relative Strength Between 6E and 6J
To evaluate currency dynamics, we compute the relative strength of the Euro (6E) versus the Yen (6J) as a ratio. This ratio helps identify which currency is outperforming, providing insights into broader risk sentiment and market direction.
Another way to think of this ratio would be to use the RY1! Ticker symbol which represents the Euro/Japanese Yen Futures contract.
Correlation Heatmaps
The correlation heatmaps below highlight relationships between:
o Currencies: Euro (6E), Yen (6J), and Bitcoin (BTC).
o USD-Denominated Markets: Treasuries (ZN), S&P 500 (ES), Crude Oil (CL), Gold (GC), and Corn (ZC).
o Key Observations (Daily Timeframe):
The 6J (Yen) shows a positive correlation with Treasuries (ZN), supporting its traditional role as a safe-haven currency.
Bitcoin (BTC) demonstrates mixed relationships across assets, showing signs of divergence compared to fiat currencies during specific conditions.
o Key Observations (Weekly and Monthly Timeframes):
Over longer timeframes, correlations between 6E and markets like Gold (GC) strengthen, while the Yen's (6J) correlation with Treasuries becomes more pronounced.
BTC correlations remain unstable, suggesting Bitcoin behaves differently than traditional fiat currencies, particularly in stress periods.
3. BTC Divergence: Behavior During Significant Moves
To assess BTC's behavior during stress periods, we identify significant moves (beyond a predefined threshold) in the Euro (6E) and Yen (6J). Using scatter plots, we plot BTC returns against these currency moves:
BTC vs 6E (Euro):
BTC returns show occasional alignment with Euro movements but also exhibit non-linear patterns. For instance, during sharp Euro declines, BTC has at times remained resilient, highlighting its decoupling from fiat.
BTC vs 6J (Yen):
BTC's reaction to Yen strength/weakness appears more random, lacking a clear pattern. This further underscores BTC’s independence from traditional fiat dynamics, even as Yen strength typically aligns with safe-haven asset flows.
The scatter plots reveal that while fiat currencies like the Euro and Yen maintain consistent relationships with USD-denominated markets, Bitcoin exhibits periods of divergence, particularly during extreme stress events.
4. Focus on Treasury Futures (ZN)
Treasury Futures (ZN) are among the most responsive assets to currency shifts due to their role as a safe-haven instrument during economic uncertainty. Treasury prices often rise when risk aversion drives investors to seek safer assets, particularly when fiat currencies like the Yen (6J) strengthen.
6E/6J Influence on ZN
From the correlation heatmaps:
The Yen (6J) maintains a positive correlation with ZN prices, particularly during periods of market stress.
The Euro (6E) exhibits a moderate correlation, with fluctuations largely dependent on economic events affecting Eurozone stability.
When relative strength shifts in favor of the Yen (6J) over the Euro (6E), Treasury Futures often attract increased demand, reflecting investor flight-to-safety dynamics.
Forward-Looking Trade Idea
Given the above insights, here’s a hypothetical trade idea focusing on 10-Year Treasury Futures (ZN):
Trade Direction: Long Treasury Futures to capitalize on potential safe-haven flows.
Entry Price: 109’29
Target Price: 111’28
Stop Loss: 109’09
Potential for Reward: 126 ticks = $1,968.75
Potential for Risk: 40 ticks = $625
Reward-to-Risk Ratio: 3.15:1
Tick Value: 1/2 of 1/32 of one point (0.015625) = $15.625
Required margin: $2,000 per contract
This trade setup anticipates ZN’s upward momentum if the Yen continues to outperform the Euro or if broader risk-off sentiment triggers demand for Treasuries.
5. Risk Management Importance
Trading currency-driven assets like Treasury Futures or Bitcoin requires a disciplined approach to risk management due to their volatility and sensitivity to macroeconomic shifts. Key considerations include:
a. Stop-Loss Orders:
Always use stop-loss levels to limit downside exposure, especially when markets react sharply to currency moves or unexpected news.
b. Position Sizing:
Adjust position size to match market volatility.
c. Monitor Relative Strength:
Continuously track the 6E/6J ratio to identify shifts in currency strength that could signal changes in safe-haven flows or BTC behavior.
d. Non-Correlated Strategies:
Incorporate BTC into portfolios as a non-correlated asset, especially when fiat currencies exhibit linear correlations with traditional markets.
By implementing proper risk management techniques, traders can navigate the ripple effects of currency moves on markets like Treasuries and Bitcoin.
6. Conclusion
The relative strength between the Euro (6E) and Yen (6J) provides critical insights into the broader market environment, particularly during periods of stress. As shown:
Treasury Futures (ZN): Highly sensitive to Yen strength due to its safe-haven role.
Bitcoin (BTC): Demonstrates unique divergence from fiat currencies, reinforcing its role as a non-traditional asset during volatility.
By analyzing correlations and BTC’s reaction to currency moves, traders can better anticipate opportunities in USD-denominated markets and identify divergence points that signal market shifts.
When charting futures, the data provided could be delayed. Traders working with the ticker symbols discussed in this idea may prefer to use CME Group real-time data plan on TradingView: www.tradingview.com - This consideration is particularly important for shorter-term traders, whereas it may be less critical for those focused on longer-term trading strategies.
General Disclaimer:
The trade ideas presented herein are solely for illustrative purposes forming a part of a case study intended to demonstrate key principles in risk management within the context of the specific market scenarios discussed. These ideas are not to be interpreted as investment recommendations or financial advice. They do not endorse or promote any specific trading strategies, financial products, or services. The information provided is based on data believed to be reliable; however, its accuracy or completeness cannot be guaranteed. Trading in financial markets involves risks, including the potential loss of principal. Each individual should conduct their own research and consult with professional financial advisors before making any investment decisions. The author or publisher of this content bears no responsibility for any actions taken based on the information provided or for any resultant financial or other losses.

The TREND is your FRIEND 21 $Trillion incoming. #Fiat #dxyM2 is a classification of money supply. It includes M1 – which is comprised of cash outside of the private banking system plus current account deposits – while also including capital in savings accounts, money market accounts and retail mutual funds, and time deposits of under $100,000.
Governments are not shying away from negative rates and printing money.
This is akin to a Financially Transmitted Disease.
As a result of this incredible money printing in the United States, the U.S. dollar is under siege.
Commercial traders are net short nearly 26 thousand contracts
the most since 2019.
This means that investors are betting against the US Dollars at levels not seen in years.

EURUSD to 1.1 per dollar??Another one for the forex traders or fiat currency traders.
EURUSD is bullish on weekly as we are currently at Entry for Long Orders,
Then based on this Timeframe, you can execute long orders at current price, i took my entries early but market might correct a bit back to entry.
We have just finished or completed correction, and about to continue going up from here, Initial target is 1.1 dollars, then lock and let the big boy run to new Highs.
NFA as always, awesome trading, Enjoy.

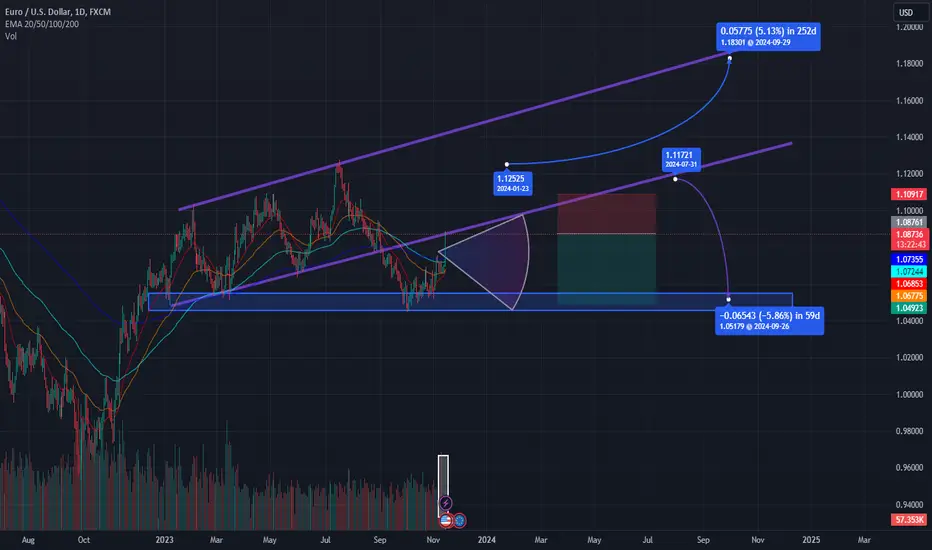
Analyzing Potential EUR Movements: Channel Pattern SVM OverviewD ear Esteemed TradingView Community,
I trust this idea finds you well. In the intricate world of trading, where decisions are often rooted in data and analysis, I'd like to share my recent findings regarding the EURUSD market. Please note that this is not financial advice but rather a reflection of my analytical perspective.
In October, my focus zeroed in on a noteworthy development in the EUR market: the emergence of a demand zone around the $1.05 level. Leveraging advanced tools like AI and Kernel SVMs, I identified this zone as pivotal support, opening the door to intriguing possibilities for both short and long positions.
The demand zone, acting as a robust support, fueled a successful long trade as the price reached the projected target. However, the current scenario introduces the prospect of a short position, with potential entry points highlighted by the bottom purple line, a resistance level identified by SVMs.
As we navigate the intricate dance between support and resistance, it's crucial to acknowledge the uncertainty inherent in market dynamics. The potential breakout from the resistance is not guaranteed, and the price might trace its steps back, especially if it encounters resistance at the identified purple line. In the event of a reversal, the previous long entry point (demand zone) could serve as a short target.
Bearish scenarios envision the price consolidating below the resistance, possibly entering a downtrend. Yet, the journey to the demand zone may not be immediate, as additional chart patterns could manifest between the resistance and the demand zone, either reinforcing or challenging the short thesis.
A significant surge in sell volume on 13-14 November raises the probability of a bearish scenario. This surge, aligned with the preceding rally, suggests a potential exit strategy for investors capitalizing on heightened market activity. The existence of a parallel resistance trendline, derived from historical peaks, adds another layer of complexity to the analysis.
While indications of a breakout are not definitive, the possibility of the price returning to the rising channel between trendlines cannot be dismissed, especially considering the impact of unforeseen news events. Though technically less probable, the practice of markets often defies technical norms.
In conclusion, I've marked this analysis as 'short,' considering the potential bearish patterns associated with rising channels. However, it's essential to approach these insights with a discerning eye, recognizing the dynamic nature of financial markets. Your attention to these nuances is greatly appreciated.
Kind Regards,
Ely
Keep an eye on USDT/USD pair I have been checking USDT/USD pair since last weeks, and already had some thoughts that something is coming, before the news came out about Huobi. Honestly, I was expecting that something will happen to Binance, but...
Currently, Important price level on USDT is 0.9898$
Breaking below, may lead the price lower.
Ofcourse this will affect negative on Crypto Market.
FTX crash dropped USDT to 0.97$
I believe that it will be another negative move to scare people.

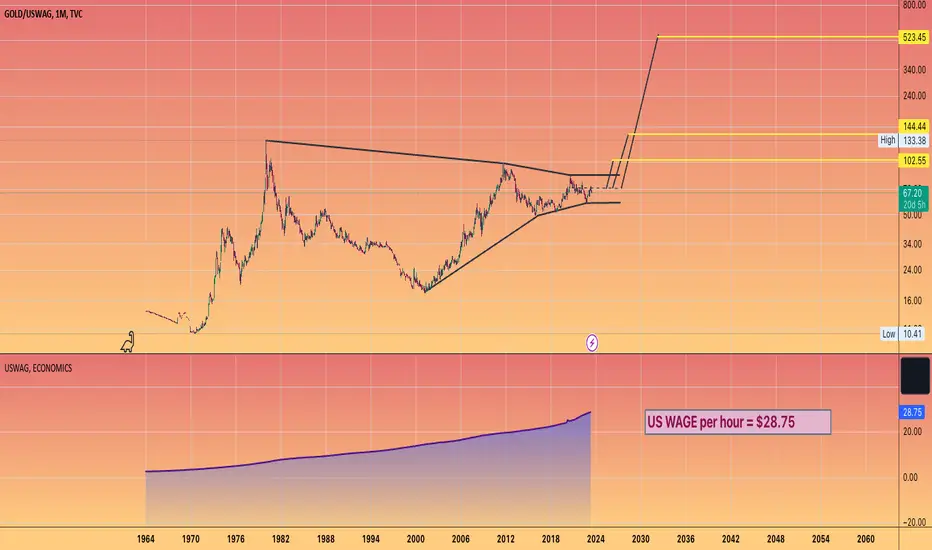
BEFORE 1971 u could acquire 1 #Gold Oz for 10 hours of labourThe erosion of wealth via #fiat debasement is clear for you to see on this chart
With the price of gold denominated us avg salary per hour
* The BLS actually has a higher number of $32 ... but the data on that price has less historical data.
NOW it takes nearly two weeks of labour to acquire 1 oz
(pre tax and living expenses obviously)
But this chart also perilously points how painful the end of US dollar dominance could be.
Pointing to an astronomical level of over 500 hours of work to get one gold ounce.
Clearly adding #PreciousMetals to your portfolio could be one the great wealth builders in the coming years.
Dollar / Real (Brazil) possible targetting higher levelsTarget one is reached. Usually after a beautiful cup and handle like this one, we see further upward price actions. Fundamentally, I don't think Real will sustain this trend of being valued, since the current president is a former prisioner charged for corruption and recently has been seen in Dubai with his 30y younger spouse in a hotel costing 60,000 reais per person by night, using public money to afford the expenses. Taxation is going nuts all over the country again, the previous president had cut them all, and now they are all being reinstalled. Inflation will hit and it's interesting to watch the DXY chart. I am keeping my earning in dollars as long as I follow the continuation here.

#BITCOIN about to pop IMHO..and tag the upper trend channel
Higher high's
Higher lows's
The trend is your friend
#Bankingcrisis
#GetOutOfFIAT
#DXY
#USD

DXYHey everyone waaaSUP,
so here is another idea on the DXY.
1 hr timeframe suggests to me that the dxy could hit the 200 SMA at around 101.4 range, it may grab the liquidity in them red vectors at around 101.6 maybe even 102.00
This would hit the trendlines coming down to then grab the liquidity below and major dump to either a double bottom or dump.
There is probability of breaking out but we will see.
Stoch Rsi is curling down for a retrace, i reckon wont reach no where near the bottom bounce up then drop.
MACD looks like it wants to roll over.
Peace and love everyone

DXY - Inflation means weak fiat Why would an eroding purchasing power of fiat currencies be considered bullish?

BTC USDT Bearish Bias to 15,000we see big bearish signals as we see a bearish gartley from 47,200.
If Bitcoin crashes, it will be a the greatest buying opportunity.
This may play out from 10-99 Days.
and we may see a slow but sustained reversal.
Bearish Target: 24,000-14,999
Bull Target 54,000-69,000.
Trade Safe.
Mad Love to all.

#DXY How the FED will end... Central bank FIAT is almost DEAD...Time to END the central bank Ponzi...
Bring back US Gov backed treasury notes backed by Gold...
100 year repeat button...

Market Valuation Adjusted for Money SupplyBearish Divergence on monthly RSI
Will you be able to out pace inflation over the course of your lifetime?

EURUSD & DXY: A BEAUTIFUL INVERSE RELATIONSHIP / FIAT / FIBDESCRIPTION: In the chart above I have included a MACRO analysis & side by side comparison of EURUSD & DXY.
POINTS:
1. DEVIATION of 0.075, found with HIGHEST HIGH & LOWEST LOW & then dividing by 2 to find a MEDIAN & so on for remaining points in between.
2. EURUSD price action is in a current downtrend getting ready to test 1ST TARGET.
3. NOTICE how TARGETS for DXY & EUROUSD coincide.
4. RSI is currently over extended for EUROUSD & has seen its squeeze from previous oversold levels.
*IMPORTANT: When both price actions come to touch they either float in same channel before separating again or completely blow through one another.
SCENARIO: With DXY's current bearish momentum this can be a bullish factor for EURUSD as they have a clear inverse behavior and vice versa.
FULL CHART LINK : www.tradingview.com
FOREXCOM:EURUSD
TVC:DXY

B I T C O I NThese are levels that I'll be keeping an eye on when dealing with BTC, and I'll revise as price action progresses.
I adapt to the change in money flow.
I'' just say that I'm anticipating for price action to break below the $10K price point.
We all shall see..

For Crypto to "Win", it Has to Solve its Own ProblemsThe idea of "smart investing" comes with the assumption that the market rewards reason and punishes irrationality in the long-term. What they don't tell you, though, is that the opposite is often true in the short-term. If you want to make money, more often than not you do have to have the discipline to move contrary to what most are doing.
It's been almost a decade since I started getting into this stuff but the above still seems to hold true. Crypto has been mostly flat for about 6 months now, but has stayed mostly stable. The last bull run had a similar pattern where it climbed to new highs (BTC $4000→$16000, ETH $100→$1400) then went back down to where it was prior. (And stayed that way for a few years.)
The projects that were diligently working on their product even after the dip ended up reaping the rewards of the 2020 rally and did very well for themselves. The rivalries between Bitcoin, Ethereum, Dogecoin, Tezos, Cardano, Ripple, EOS, etc. were there even back in 2018, but the arguments were mostly about technical differences and felt less “personal”. This time, a lot of arguments you see on social media have more personal, political, ideological slants - a sign of the irrationality of mainstream money having arrived, perhaps.
For what it’s worth, despite the FTX scandals and the very negative media coverage of crypto in recent weeks, the price hasn't really moved all that much. Chances are good that the ones that were going to leave are already gone and we're only left with the ones who are in it for the long-haul. While the talking heads gripe about their losses in public, the builders will continue to build, pushing the industry where it needs to be for the future to come. That is the hope, anyway.
--
Long-term strategies only work if you're willing to wait at least one market cycle since the system needs time to work itself out - and I haven’t seen any exceptions to this rule, thus far. But having been through 3 crypto winters already, I’m starting to wonder what’s really taking so long for us to get to where we need to be - the “big ideas” in crypto (transparency, accountability, partnership automation) can already be done with distributed ledgers, but the industry has been slow to adapt to it, to say the least. The problem is that we're not really utilizing blockchain technologies the way we should be: case in point, when you look at all the people in the media and social media talking about how much money they’re making, how do we know if what they’re saying is actually true? We have no idea - we’re just taking their word for it, and now we’re finding out that many of them we’re just trying to lie and grift their way to the top. Whatever happened to "verify, not trust"?
Having gotten too used to low interest rates, the fiat markets are poised to be in big trouble over the next few years - if not more. The trends do say that when an economic system goes into disarray, crypto adoption tends to go up. But in order for that to happen, the crypto community does need to convince the world that it's safer to park their money in coins rather than fiat - which, if we're being honest - we're not quite there yet.
But unlike fiat institutions that are saddled with legacy and protectionist frameworks, crypto has the tools to fix itself if it wanted to - the advantage of being a new industry that has the energy and flexibility to adapt. The current irony is that crypto is suffering from the very problems it poised to solve - but a lot of it is holdovers of bad habits from Web2 and traditional fiat. You could probably argue the SBF's actions was a product of the fiat world, not crypto - there's a reason why there are those on the “inside” trying to protect him now. But FTX is also a preview, in a way, of what's to come to the fiat worlds as we head further into the recession - what they do to SBF could be them next - which is why they feel like they need to protect him at all costs, despite the blatancy of his misdeeds.
In a way, SBF did the industry a favor in getting the skeletons out of the closer earlier than later. For fiat, the tide is only just starting to pull. Crypto will either set the new standards for transparency, accountability, and decentralized governance - or it’s going to fall into old habits again and go to 0. (There is no reason for people to use crypto if it’s just going to be Web2.1 - the incumbents have that covered already.) It’s going to be an interesting ride over the next few years, either way.

November 1 BTCUSD BingX Chart Analysis and Today's HeadlineBingX’s Bitcoin Chart
According to the latest CoinShares report, digital asset investment products saw a net inflow of $6.1 million last week. Bitcoin is down 0.68% over the last 24 hours and fell to an intraday low of $20,240.00. The volatility of Bitcoin has reduced since Saturday, as markets prepared for the latest U.S. Federal Reserve policy meeting. The Fed is expected to hike rates by 75 basis points this week, as core inflation remains at historical highs. Investors will look for any signals the Fed may be considering a deceleration in interest rate hikes in the future. If the Fed pivots from its hawkish interest rate hikes, we could witness all risk assets rise in the future.
Today’s Cryptocurrency Headline
Singapore Pilots Tokenized Fiat with Smart Contract Capabilities
Singapore-based financial services group DBS is partnering with Open Government Products, a tech team within the Singapore government, to pilot the tokenization of the digital Singapore dollar. The pilot is part of the MAS-led CBDC technology exploration project “Project Orchid” launched last year to enable a programmable digital Singapore dollar. DBS will issue digital Singapore dollars, while Open Government Products will enable smart contract capabilities in the future.
Disclaimer: BingX does not endorse and is not responsible for or liable for any content, accuracy, quality, advertising, products, or other materials on this page. Readers should do their own research before taking any actions related to the company. BingX is not responsible, directly or indirectly, for any damage or loss caused or alleged to be caused by or in connection with the use of or reliance on any content, goods, or services mentioned in the article.

Weakness in DXY ---> Strength in crypto, or no?| Your time is precious so I write concise and precise, feel free to ask for more |
We see good weakness sign in DXY which gives great signal for cryptocurrencies TO UP!
So let's keep eye if the resistance does its job or not
| Your time is precious so I write concise and precise, feel free to ask for more |

BTC OutlookBitcoin will eventually hit $30 billion by the year 2064, according to my estimation. There is an enormous passion behind the blockchain technology. Many laugh, some underestimate and some enter. The ones who enter (for long, not short) will win. If one Bitcoin reaches $30 billion, its market cap will be $400 quadrillion which comes against the total amount of current fiat by $29 trillion. Some people then invalidate the idea of Bitcoin hitting that number; but, the question is: Why is there even that $29 trillion? Why not more or less? For many centuries, govts did what they wanted. Printing an unlimited amount of notes. Now, the decentralised system of blockchain is here.
