AUDUSD: Weekly Uncertainty AUDUSD has failed to break the so called resistance and a trendline is forming thus we will wait for a 3rd touch to form and possibly sell on it's break downward. Moreover, fibonacci levels are precisely respected. Will it succeed in breaking the uptrend ? Remember that this one could be in a corrective wave before the storm as the USD can possibly be failing following a bad economy management.
If you like the idea, support us with a like and a follow
Trade safe !
MacroForex
Fib

[EW] XAUUSD (GOLD) correction incomplete.The correction beginning the August 7th 2020 high is nearly complete. I believe it was a running flat, and the final downwards impulse is in wave iv, awaiting a final wave (v).
The target for wave iv is approximately 1775 (61.8% of wave iii), where it should terminate and then the next target is 1617 for wave (v), which is 61.8% of the previous run.
Plenty of other Elliott Wave practitioners have the current downtrend labelled as a high degree wave 4, which means after the movements described we'll be in a high degree bullrun! Hopefully wave 5 lasts a while.
NFA, DYOR

AUD/USD Short Swing trade current price : 0.77480
M/ resistance 0.77500 price touch it failing to brake it ( brake but came back under 0.77500)
W/ forming a pattern head and shoulder mean a reversal
D/ same has weekly but I draw a trend line seeing a brake of trend line, waiting for a candle closer under the resistance (0.77500) to go for a Sell Long term Swing trade
4h/ was forming nice HH and HL brake the trend line and I see price going for a sell and reject the blue resistance multiple time
1h/ Is forming HL and LL brake the small up trend re-test the trend line under resistance I see price is most likely to go down
15m/ seeing consolidation
over all sell to next support


RejectedShort to support, stop yourself if it goes over the resistance.
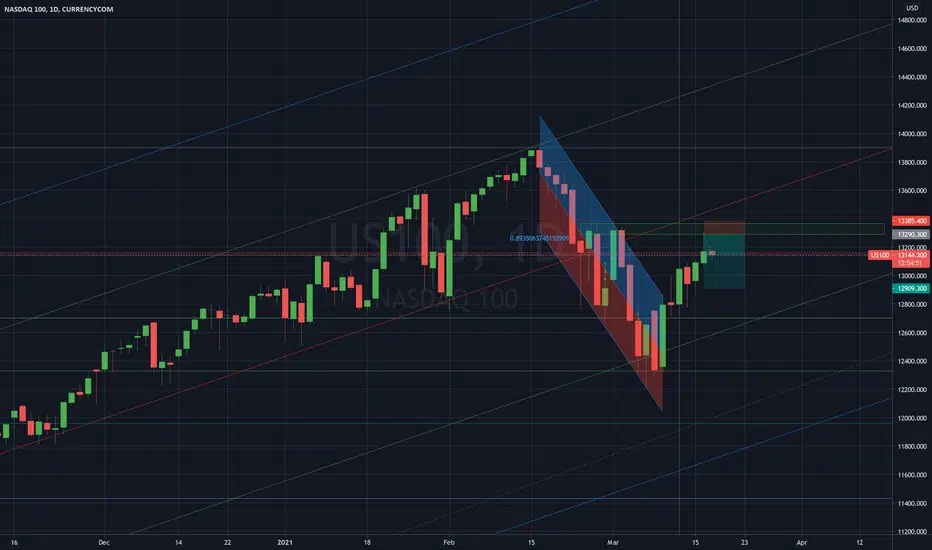
Powell needs to announce more market support, but likely no changes will be announced.
Dems planning new wealth taxes, so people may continue to liquidate in fear.
It's also just below a long term fib extension, Fork drawn from march crash last year.
Could go down to 12700.
GoldenEye VRA/BTC #Verasity $VRA #VRAHere we see our VRA 3 day chart which had a great couple of days pumping well past my previous target of 48 sats !! Of course it's cooling off a bit now sitting at 32 sats . That's expected after a large pump, there will always be a retrace and cooling off before more continuation . But what is our mid-term target here for VRA ? Where can it hit in the next couple of months for instance ? Well... if you look at my chart you will see a green dotted line . That line sits at the level of our .618 fib . Also sometimes called the Golden fib , this sits near 125 sats . I'm thinking this is a probable target and would be about 4x up from where we sit now or 400 % . Now we can definitely dump more- this isn't necessarily our bottom (though it could be. ) And we can definitely pump way more than 125 sats too ( as you can see from the recent crazy pump !! ) Will VRA go to Binance this year ?? That's a wild card . And if it happens VRA could have an unstoppable year .

Target Practice FET/BTC #FetchAI #FET $FET Here we see our FET BTC weekly chart from Binance . You can see our colorful fib levels on the right side of the chart - and our possible price targets have check marks next to them . FET just had an AMA talk earlier today in their chat group and their chart looks great - now sitting over 900 sats . I predicted we would be hitting this area and that our next stop up will probably be 1550 - marked by the blue line with pink checkmark on our chart - because of course this was our high from last summer. And we should be revisiting 1550 fairly soon in my opinion . After we gain that level I would expect our targets to hit at the fib levels above us which should be as follows =
3420 - that's our .236 fib - I would say there is a very high probability of hitting this fib
5443 - that's our .382 fib
7077 - that's our .5 fib
8712 - that's our .618 fib and in a Bullrun year I would expect us to get here but that could be later in the year . Of course , our targets can also
go higher than this but let's take this one stage at a time. FET has a Mainnet end of March - so less than 3 weeks from today - everything looks great here !

NEAR// Near New ATHs!Nothing complicated...break & retest...following volume along with riding the BTC momentum.
Got a good rejection from the broken resistance now support. Would be best to wait on a second bullish candle and then look for entries. As of right now, everything is bullish.

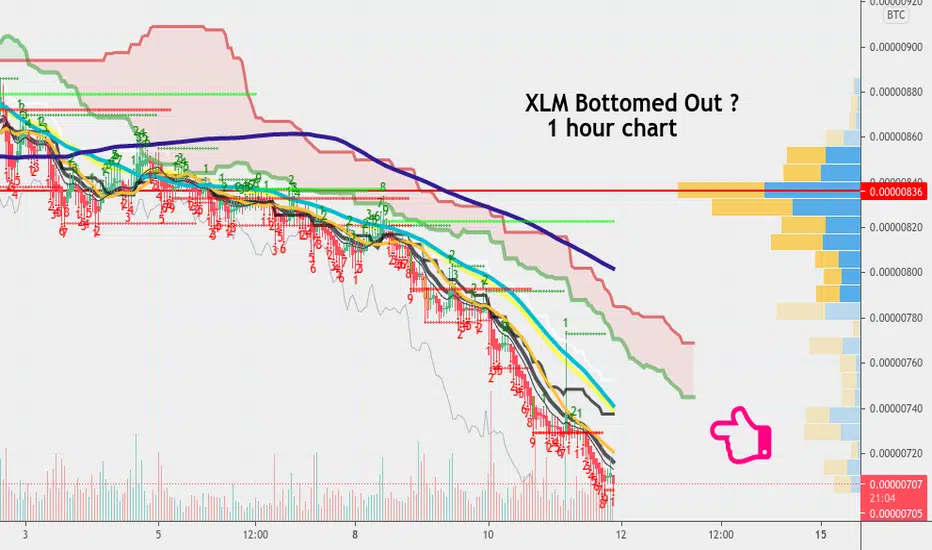
Digging Deep XLM/BTC #Stellar #XLM $XLM Here we see our XLM Btc 1 hour chart on Binance . As you see we have dipped way down here into the 700 area. We have hit another TD Sequential 9 in red here and should really see a turnaround come soon . I'd wait for confirmation but a target above us seems to be 836 - which would be that red line above us. That's part of our VPVR indicator and the red line is an area of confluence and should be a target above us where we will be going at some point. I still think there is a large Cup and Handle structure forming on this XLM chart on the higher timeframes but here we see the chart is bottomed out . When this finally turns up the targets above should be our fibs which are =
1926 - that's our .236 fib
2862 - that's our .382 fib
3619 - that's our .5 fib
4375 - that's our .618 fib
4939 - that's our .786 fib
there may be a pullback somewhere near 37xx since that could be the lip of the cup - but Xlm can see returns to All Time Highs this year . Thank you.
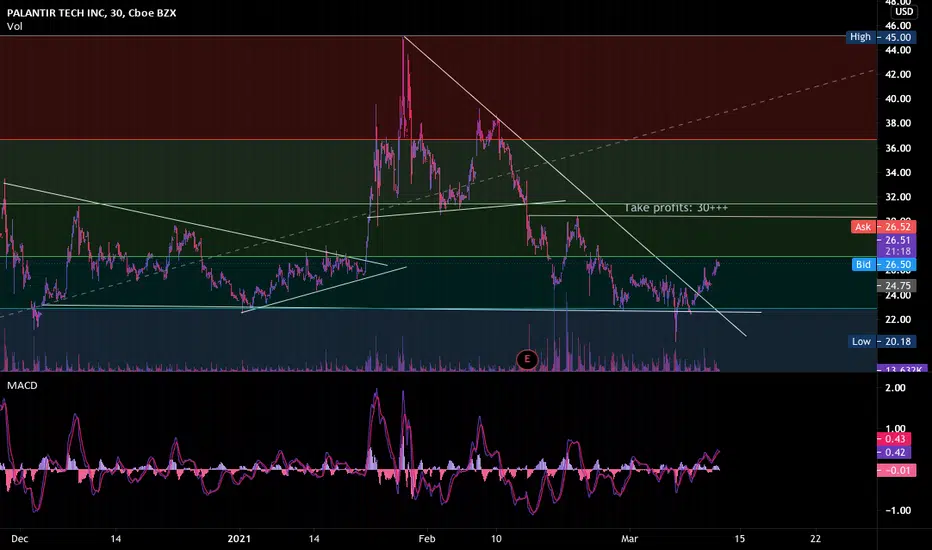
PLTR Coming up on Fib LevelLast time PLTR was in a wedge at this Fib level, we saw huge gains. I am looking for the same thing to happen. If the market is good I think this stock can keep running. Always remember to do your own research. Happy trading!!
Mid-day Play on APREAPRE is hitting resistance at Fib levels again, I it breaks through, I can see a large upside. This trade is mostly for today or within the next 3 days. Keep an eye on it. Good Luck


BTC-USD still waiting to complete measured move fib short setupFib measured move short setup still intact and waiting to hit its target at 41,657.73.
This will be valid until the 61.8% fib is broken at 53,193.92.
Short setup target also should be support for the retest of the recent all time high at 42,000

Anticipation ... VRA/BTC #Verasity #VRA $VRAHere we see our VRA BTC daily chart from Kucoin. RIght on track our light blue 50 MA is going to cross up into our dark blue 200 MA . That's the Golden Cross we've been talking about. I'll link the related chart below . This is still very Bullish for our chart and as you see we wicked up to touch that red line ( that's the VPVR indicator .) If Altseason is starting then what are the possible targets here for VRA ? Well , our fibs could be the targets and next one above us is this :
4827 - that's our .236 fib
7728 - that's our .382 fib
10072 - that's our .5 fib
12416 - that's our .618 fib
Let's see how this does in 2021 - thank you for reading !


26x Possible in One Year ? GVT/BTC #GenesisVision #GVT $GVTHere we see our GVT weekly chart and after that massive downside during the bearmarket it could be looking up now. You see there is a massive Ichimoku cloud above us ( the top of which is 13500 sats .) That's 13x up from where we are now - 13 times ! That's already a good result but let's look at the fibs to see other possible targets . Our fib targets on the way up could go like this =
10300 - that's our .236 fib
13500 - that's our top of cloud target , remember
16500 - that's our .382 fib
21400 - that's our .5 fib
26400 - that's our .618 fib
that last one is about 26 times up from where we are now , but that could take a year to get there . In my opinion that might be possible in early 2022 if the Bullmarket carries this up .

Dollar Dreams VRA/USDT #Verasity $VRA #VraHere we see our Vra weekly chart from Kucoin with a tether pairing . You'll notice we are at a third of a cent now . On our fib extension you can see the target for end of 2021 or early 2022 appears to be 1 and a half cents or about 5x up from where we are now on the 4.236 extension . But this is a Bullrun year and the Moonboys want their 1 dollar target ! That would be 300x from where we are now and in my opinion won't happen . But sometimes insane runs happen in crazy bullish scenarios so I won't rule anything out for VRA ! Especially since Twitter gurus also love this project. But $1 may have to wait . See my related chart for VRA BTC pair below . Thank you .

LLKKFLake broke down, I sold at .33c entry was .22c so nice win & this trade strayed up through the entire stock market correction. This was my only profitable trade over the stock market correction I used the funds to. buy every dip down to 3780. I think Lake will come back from here and I would buy at these levels and look for .49c

BTC is about to BOOMThere will be selling opportunities at the confluence zones marked. But don't get this mistaken for an exit strategy. The bulls are clearly taking control and we will be seeing a surge this weekend.

/ES Possible Buy PointJust a chart on where I think /ES might go based on Elliot waves. and fibonacci levels.

GBPNZD// Head & Shoulders 🤷🏾♂️Potential H/S Pattern. Currently retesting strong support and showing price rejection at 61.8%.

Pitchforks Ready BAT/BTC #basicattentiontoken $BAT #BAT Here we see our BAT BTC weekly chart from Binance . You can see BAT had a massive downside here from last summer. But it's recovering nicely and looks great for upside . You see we have drawn a large pitchfork indicator on this chart and it seems to fit. The top of that first pitchfork line up seems to be near 2600 and that also is where you see that long red line . That's an indicator called a VPVR and there's an obvious area of confluence near 2598 , so this appears to be a target in the near future. You can see our first target area - it's where the black arrow is pointing . The target above that appears to be the .382 fib near 3687 . Above that is our middle pitchfork line near 4600 . Above that is very bullish and targets would be
5859 - that's our .618 fib
6669 - that's our .706 fib
7405 - that's our .786 fib
8700 - that's the top of the pitchfork end of year 2021
thank you for having a look ! And fyi this is technically a Schiff pitchfork , it's one of the free indicators in your left side panel on Trading View.

Make It Rain ZIL/BTC #ZilliqaCommunity #ZIL $ZILHere we see our weekly ZIL BTC chart from Kucoin with that big pink Ichimoku cloud on it . As you can see we have closed weekly candles inside this cloud since the start of the year . This is extremely bullish in my opinion because once a coin enters into the weekly Ichimoku cloud it is almost certainly going to continue up to the top of that cloud and probably eventually break though it ( and maybe continue upside from there . ) Now you see that red line on my chart ? That's an area of big resistance on the weekly chart near 713 . It's also right above the .236 fib line. So this seems like a near term target for Zil .But obviously having broken through the cloud at that point it would be bullish for more upside. Potential targets above that would be our fibs at
1067 - that's our .382 fib
1376 - that's our .5 fib
1684 - that'sour .618 fib
1915 - that's our .706 fib
obviously Zil can continue higher after that too, but let's see ! Also thank you to any Zilliqa Community members who see this .
