XAUUSD – Post FOMC | ChumTrades Daily PlanXAUUSD – Post FOMC | ChumTrades Daily Plan
Market Context
• Strong rejection at 4245 → buyer momentum weakening.
• Prefer selling at premium zones, buying at lower demand zones.
• Expect gold to continue ranging within 4245 ⇆ 4180.
🔻 SELL Zones
1) Main SELL Zone: 4238–4245
Entry: 4238–4245
SL: 4255
TP1: 4225
TP2: 4204
TP3: 4180
2) SELL SCALP: 4230–4233
TP: 4218–4210
SL: 4237
🟢 BUY Zones
1) BUY SCALP: 4188–4190–4192
TP: 4210 → 4218 → 4230 → 4240
SL: 4278
2) Main BUY Zone: 4163
SL: 100 pips
TP: 100 / 200 / 300 pips
RR: 1 : 3
🎯 Bias
• Below 4245 → market favors sideway–down movement.
• Only a breakout above 4265 signals a potential bullish shift.
If you find this plan helpful, please leave a like and follow ChumTrades for daily plans & realtime updates!
Feel free to drop your own market view in the comments so we can discuss together.
Fibonacci

ChumTrades XAUUSD M15 intraday outlook Market Context
Price is currently ranging in a very tight consolidation.
Momentum is weak → market favors intraday range trading rather than chasing breakouts.
Short-term structure remains intact; focus on price reaction at key levels.
Daily Strategy
Main approach: trade the range, trade the reaction.
Buy at predefined support / Fibonacci zones, sell at clear resistance.
If a breakout occurs, wait for a retest before following the move.
Avoid entries in the middle of the range.
Key Buy Zones
4246 – 4244 (Fibo 0.5)
4236 – 4233 (Fibo 0.618)
4210 – 4208 (deep support reaction)
❌ Bullish structure invalidation:
M15 close below 4200
Key Sell Zones
4300 – 4305 (psychological resistance)
4310 (Fibonacci extension – reaction sell)
Special Notes (Friday)
No major economic news today, but it is Friday – end of week.
Price action may become choppy and unpredictable, especially during the US session (a pattern seen in recent weeks).
Risk management is key:
Focus on short-term trades
Take profits early
Avoid holding positions over the weekend.
Good luck bro!

CRM watch $262-265: Major Fib zone Break should _POP_ off BOTTOMCRM trying to paint a bottom after getting destroyed.
Testing a well proven dual fib zone at $262.54-265.36
Zone includes Golden Genesis and a semi-major Covid.
.
See "Related Publications" for previous plots such as this EXACT BOTTOM CALL:
Hit BOOST and FOLLOW for more such PRECISE and TIMELY charts.
========================================================
.

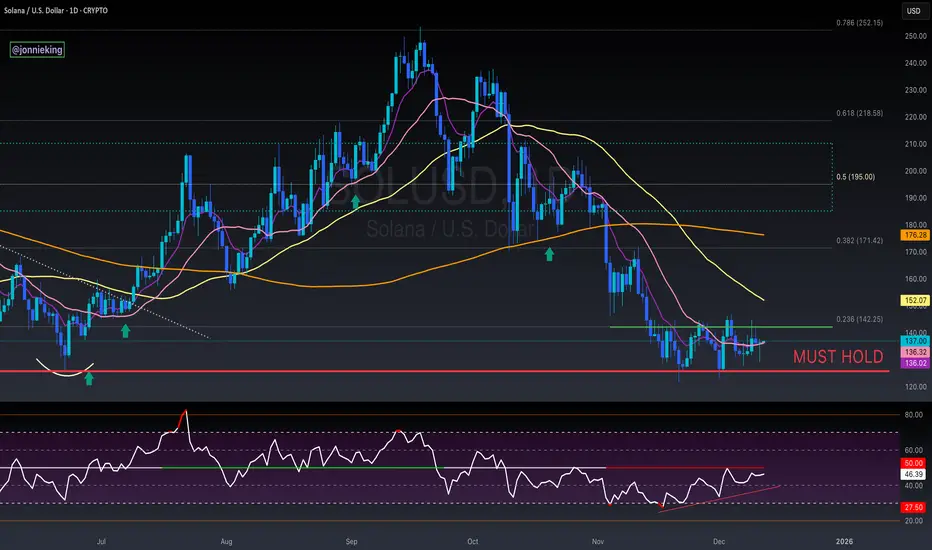
$SOL Stuck In ConsolidationSolana has been stuck in this consolidation range the past month ~$125 - 145
Truly an infliction point for CRYPTOCAP:SOL
a break in either direction should be massive upside or downside.
HOPIUM: bullish divergence appears to be forming on the RSI
Solana Breakpoint just kicked off today, but the market showed very little interest.
Bulls need a huge injection here.
ETH Broke Parallel Daily Channel - Retracement Complete?BINANCE:ETHUSDT has finally broken out of a bearish parallel channel after trading in it for over 2 months! ETH found support at the 0.618 fib level from the April low, which saw price surging from $1400 to $4900.
It will be interesting to see how long the current bullish rally continues for, since this could very well be the low before we start testing the all time highs of $5000!

BTC Pullback: Buying 50-78.6% Discount LevelsAfter the aggressive internal liquidity grab on December 1st, which subsequently manifested as a Daily Bullish Order Block , Bitcoin continued its local bullish structure from the global 78.6% level, which I analyzed in my global overview: Bitcoin: The ATH Was a Trap. Here's the Real Roadmap.
Currently, the asset is correcting on the 4H structure and has reached the top of the Order Block. However, to obtain a better Risk/Reward (RR) in the trade and for general entry feasibility, I always wait for a more favorable price in the Discount Zone , which is located below the 50% Fib level.
No one can know exactly how deep Smart Money needs to return the asset into the manipulation zone to close losing positions used to execute this aggressive liquidity grab. Therefore, I will consider a reversal reaction from each level: 50%, 61.8%, and 78.6% .
✅ Entry Conditions:
The condition for entry will be reaching one of these levels, price finding acceptance above it, and the initiation of bullish order flow on a lower timeframe (1m-5m).
❌ Invalidation:
The invalidation of the long scenario will be a break of the local 78.6% level . In that case, the Bitcoin reversal from the global 78.6% level in continuation of the global uptrend will be in question, though still possible, as this is a level from the highest timeframe, and the second monthly candle could also close with its body above this level.
🎯 Target:
The minimum target in case of a long setup formation from the Discount Zone will be the SUPPLY zone . To confirm that the bull cycle is not over and the asset can potentially form a new ATH, it will first have to overcome this resistance zone.
~~~~~~~~~~~~~~~~~~~~~~~~~~~~~~~~~~~~~~~~~~~~~~~~~~~~~~~~~~~~~~~~~
The principles and conditions for forming the manipulation zones I show in this trade idea are detailed in my educational publication, which was chosen by TradingView for the "Editor's Picks" category and received a huge amount of positive feedback from this insightful trading community. To better understand the logic I've used here and the general principles of price movement in most markets from the perspective of institutional capital, I highly recommend checking out this guide if you haven't already. 👇
P.S. This is not a prediction of the exact price direction. It is a description of high-probability setups that become valid only if specific conditions are met when the price reaches the marked POI. If the conditions are not met, the setups are invalid. No setup has a 100% success rate, so if you decide to use this trade idea, always apply a stop-loss and proper risk management. Trade smart.
~~~~~~~~~~~~~~~~~~~~~~~~~~~~~~~~~~~~~~~~~~~~~~~~~~~~~~~~~~~~~~~~~
If you found this analysis helpful, support it with a Boost! 🚀
Have a question or your own view on this idea? Share it in the comments. 💬
► Follow me on TradingView for timely updates on THIS idea (entry, targets & live trade management) and not to miss my next detailed breakdown.
~~~~~~~~~~~~~~~~~~~~~~~~~~~~~~~~~~~~~~~~~~~~~~~~~~~~~~~~~~~~~~~~~

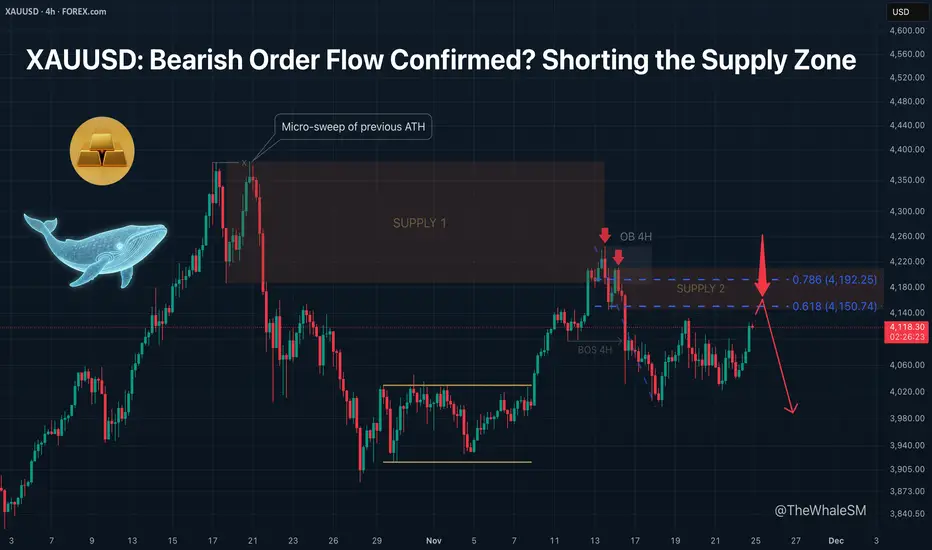
XAUUSD: Bearish Order Flow Confirmed? Shorting the Supply Zone.After updating the All-Time High (ATH), Gold performed a micro-sweep of liquidity from the previous ATH. This move was engineered via a Supply Zone . Following the sweep, this zone was mitigated, initiating a bearish order flow that broke the 4H structure to the downside (BOS 4H).
After the structural break, the price began approaching a second Supply Zone . A reversal is possible from this area to continue the bearish order flow, targeting an update of the structural low at $4000 . A full break of this low would indicate a high probability of a deeper correction on the higher timeframe.
✅ Short Setup Conditions:
Aside from the mitigation of the Supply Zone, I am looking for a reversal reaction from the 61.8% Fibonacci retracement level . The price must find acceptance below this level upon reaching it.
❌ Invalidation:
The short scenario is invalidated if the 61.8% level is broken. In that case, Gold will face further resistance at the 78.6% Fib level , but forming a short setup there is less probable than from the 61.8%.
~~~~~~~~~~~~~~~~~~~~~~~~~~~~~~~~~~~~~~~~~~~~~~~~~~~~~~~~~~~~~~~~~
The principles and conditions for forming the manipulation zones I show in this trade idea are detailed in my educational publication, which was chosen by TradingView for the "Editor's Picks" category and received a huge amount of positive feedback from this insightful trading community. To better understand the logic I've used here and the general principles of price movement in most markets from the perspective of institutional capital, I highly recommend checking out this guide if you haven't already. 👇
P.S. This is not a prediction of the exact price direction. It is a description of high-probability setups that become valid only if specific conditions are met when the price reaches the marked POI. If the conditions are not met, the setups are invalid. No setup has a 100% success rate, so if you decide to use this trade idea, always apply a stop-loss and proper risk management. Trade smart.
~~~~~~~~~~~~~~~~~~~~~~~~~~~~~~~~~~~~~~~~~~~~~~~~~~~~~~~~~~~~~~~~~
If you found this analysis helpful, support it with a Boost! 🚀
Have a question or your own view on this idea? Share it in the comments. 💬
► Follow me on TradingView for timely updates on THIS idea (entry, targets & live trade management) and not to miss my next detailed breakdown.
~~~~~~~~~~~~~~~~~~~~~~~~~~~~~~~~~~~~~~~~~~~~~~~~~~~~~~~~~~~~~~~~~
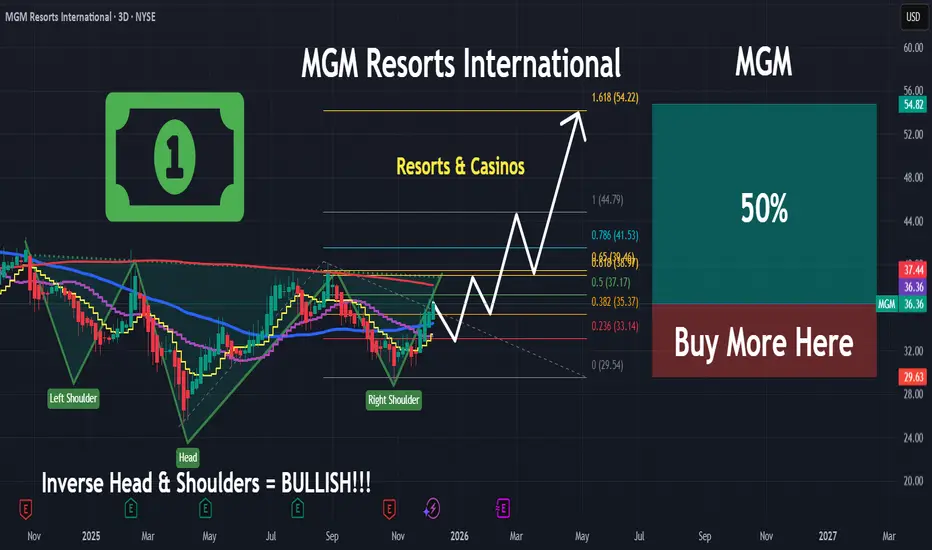
MGM | The Next Casino To Rise Higher | LONGMGM Resorts International is a holding company, which engages in the ownership and operations of casino resorts. The firm's casino resorts offer gaming, hotel, convention, dining, entertainment, retail, and other resort amenities. It operates through the following business segments: Las Vegas Strip Resorts, Regional Operations, MGM China, and MGM Digital. The Las Vegas Strip Resorts segment operates the following casino resorts: Bellagio, MGM Grand Las Vegas, Mandalay Bay, The Mirage, Luxor, New York-New, Excalibur, Park MGM, and Circus Las Vegas. The Regional Operations segment consists of the following casino resorts: MGM Grand Detroit in Detroit, Michigan, Beau Rivage in Biloxi, Mississippi, Gold Strike Tunica in Tunica, Mississippi, Borgata in Atlantic City, New Jersey, MGM National Harbor in Prince George's County, Maryland, and MGM Springfield in Springfield, Massachusetts. The MGM China segment includes MGM Macau and MGM Cotai. The MGM Digital segment focuses on the online gaming portfolio, which consists primarily of Leo Vegas, which is headquartered in Sweden and Malta. The company was founded by Kerkor Kerkorian on January 29, 1986 and is headquartered in Las Vegas, NV.
MU - Continuing CorrectionWe are evaluating the chart from a technical perspective.
The correction is still in progress, and the structure suggests that wave C should begin forming.
Targets:
• First target: 225.5
• Second target: 192.5
---
Please subscribe and leave a comment.
You’ll get new information faster than anyone else.
---

TECHNICAL ANALYSIS BNB/USDT1️⃣ Market Structure and Trend
The chart shows a long-term uptrend, confirmed by a very clean ascending trendline (orange), which has been acting as dynamic support for over a year.
After a strong breakout to ~1380, the price began a correction but still hasn't broken the higher low structure → the uptrend is intact.
2️⃣ Key Levels (exactly from your chart)
🟢 Resistance Levels (green):
~1018 USDT
~1150 USDT
~1249 USDT
These are potential targets for a renewed uptrend.
🔴 Support Levels (red):
~879 USDT – the closest important support
~838 USDT – a key defensive level
~683 USDT – deep support / last HTF trendline
The price is currently trading directly above the first support level.
3️⃣ Trendline (orange)
Your trendline is:
strong, multi-point
drawn on the D1 timeframe
currently around 850–880 USDT
➡️ If the price falls, the trendline perfectly aligns with the 838–879 zone, strengthening this zone as a "must defend."
4️⃣ Oscillators – Stoch RSI (bottom)
Currently:
The oscillator is in a high zone (above 80) → indicating local overbought
However, there is no clear downward crossover yet.
Meaning:
👉 Upward momentum is still active, but we are closer to a local high than a low.
5️⃣ Scenarios
🟢 Upside scenario (more likely as long as the trendline holds)
Condition: Maintaining the 879/838 levels and the trendline.
Targets:
1018 USDT – first resistance
1150 USDT – important medium-term resistance
1249 USDT – main HTF target
The longer the price consolidates above the orange trendline, the greater the chance of a renewed attack on 1150–1249.
🔴 Downside scenario (less likely, but crucial)
Condition: Downside breakout of 838 USDT and closing of the D1 candle below the trendline.
Then:
the market could enter a deeper correction phase
the target would be the 683 USDT level – this is also the main support level, where reactions were previously strong
This is a "capitulation" scenario, but it doesn't seem to be dominant given the current price action.
6️⃣ What can we see on the chart "here and now"?
✔️ The price has rebounded from the local low
✔️ It is still between support at 879 and resistance at 1018
✔️ The uptrend is intact
✔️ A potential HTF higher low has formed
✔️ The Stoch RSI shows momentum, but caution is warranted
➡️ The market is consolidating within the uptrend, with a high chance of a breakout upwards – provided support is maintained.

Euro Surges After Fed Decision as Bulls Eye BreakoutThe post-Fed rally is now extending nearly 1.5% off the December low. The advance is testing confluent resistance, and the focus is on today’s close with respect to the upper bounds of the late-November channel.
Confluent resistance stands with the October high-day close and the 61.8% retracement of the decline off the yearly high at 1.1731/47. A daily close above this threshold is needed to keep the bulls in control with subsequent resistance objectives eyed at 1.618% extension of the late-November rally and the 2025 high-day close (HDC) at 1.1794-1.1813 and the yearly high-close at 1.1866. Both represents regions of interest for possible top-side exhaustion / price inflection IF reached.
Initial support now rests with the 100% extension at 1.1679 with near-term bullish invalidation now raised to the November HDC and the weekly open at 1.1634/41. A daily close below this threshold would be needed to suggest a more significant high is in place and that a larger trend reversal is underway toward the December low / open at 1.1590-1.16 and the October swing low at 1.1542.
Bottom line: The outlook for the EUR/USD remains constructive with the immediate focus on a reaction into near-term uptrend resistance. From a trading standpoint, losses should be limited to 1.1679 IF price is heading higher on this stretch with a close above 1.1747 needed to fuel the next leg of the advance.
-MB

$SPY Rally?AMEX:SPY Is this the target price for today or for tomorrow 1.618? Are we finishing what we started yesterday when price surged out of nowhere? Let's see!
Alerts Set, Happy Trading

What's up with Nokia? Bullish PredictionNYSE:NOK
Nokia is predicted to continue the positive market response confirmed by bullish flag pattern.
If the analysis is relevant, Nokia should be hit on target $8.70 at the end of January 2026

Bullish Continuation for Newmont CorporationNYSE:NEM
Newmont Corporation is predicted to bullish following the increment of gold price projection.
We'll see if Newmont can achieve the target $150 until April 2026.

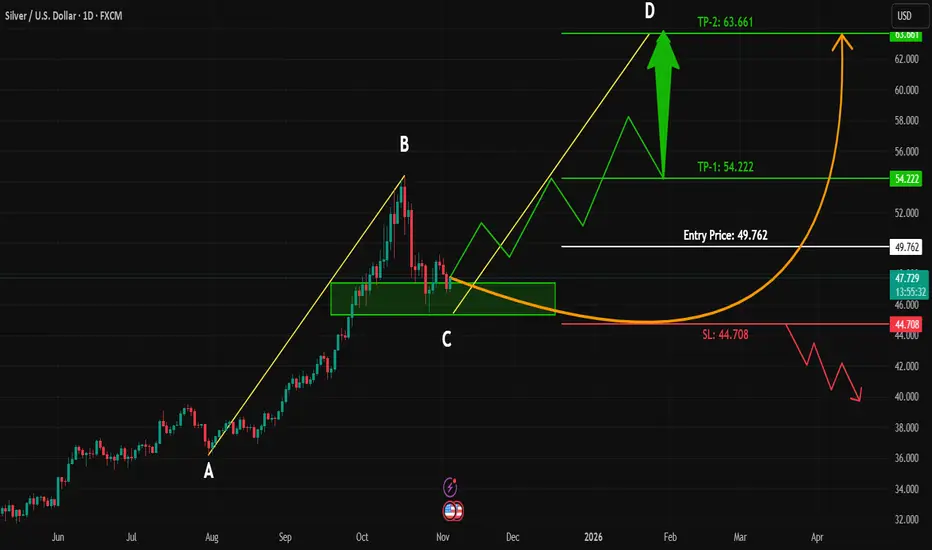
SILVER | Forming AB=CD Pattern | Strong Buy Zone Ahead!#SILVER is currently moving in a correction phase and has reached the Fib retracement zone between 0.382 – 0.5, which historically acts as a strong buying area for long-term investors.
At this zone, no major bearish signs are visible, and the structure suggests a possible formation of a bullish AB=CD pattern.
Trading Plan:
Wait for a clear breakout above the 0.5 level and resistance zone around 49.765.
On the break and retest, we’ll look for long entries with proper risk management.
Key Takeaways:
Correction phase nearing completion
Possible AB=CD bullish pattern
Watching for breakout confirmation before entry
Stay patient — the next bullish leg could start soon if confirmation aligns.
What’s your view on #SILVER? Do you think this zone will hold or break deeper? Drop your analysis below!
#SILVER #XAGUSD #TradingView #Fibonacci #ABCDPattern #TechnicalAnalysis #BuyTheDip #Commodities
NIFTY Analysis for 12th Dec '25: IntraSwing Spot levelsNIFTY Analysis for 12th Dec '25: IntraSwing Spot levels
Follow GIFTNIFTY Post for NF levels
FED Rate-Cut Impact
US Fed rate cuts are generally positive for Indian equities in the short to medium term, mainly via better global risk sentiment, softer dollar, and the possibility of stronger FII flows into India. The impact is not uniform though; rate‐sensitive, export‑oriented, and high‑valuation sectors usually benefit more than others.
Immediate market reaction
After the latest 25 bps Fed cut, GIFT Nifty and domestic benchmarks were indicated or seen opening higher, with sentiment supported by lower US yields and hopes of reduced foreign outflows. On the day after the decision, Sensex and Nifty traded with a positive bias, helped by buying in large financials and cyclicals as global risk appetite improved.
Mechanism: Flows, Rupee, Valuations
Lower US rates reduce the relative attractiveness of US bonds, encouraging global investors to look at higher‑yielding EMs like India, which can slow FPI outflows or even trigger fresh inflows if the Fed sounds dovish. A softer dollar and potential rupee stability or appreciation ease imported inflation and support Indian macros, which in turn helps equity valuations, especially in growth and consumption themes.
Sector‑wise effects
Historically, Fed cuts that support US demand and weaken the dollar tend to benefit Indian IT and pharma exporters through better client spending and currency stability. Domestic rate‑sensitives such as banks, autos, real estate, and NBFCs can also do well because expectations of easier global liquidity often reinforce the case for a benign or accommodative stance from RBI over time.
Risks and when it can be negative
If the Fed cuts but delivers a very hawkish outlook (signaling higher‑for‑longer later), markets can react risk‑off with FPI selling, rupee weakness, and pressure on high‑beta sectors despite the cut itself. Similarly, if cuts come alongside fears of US recession, global growth concerns can drag cyclicals, commodities, and export names even if liquidity is easy.
Summary for trading approach
For an Indian trader, Fed cuts with a dovish or balanced guidance usually support:
Short‑term long bias in Nifty/Sensex and high‑quality large caps as flows and sentiment improve.
Overweight stance on IT, financials, autos, and select cyclicals, while closely tracking FPI flow data, dollar index, and USDINR for confirmation
[ Level Interpretation / description:
L#1: If the candle crossed & stays above the “Buy Gen”, it is treated / considered as Bullish bias.
L#2: Possibility / Probability of REVERSAL near RLB#1 & UBTgt
L#3: If the candle stays above “Sell Gen” but below “Buy Gen”, it is treated / considered as Sidewise. Aggressive Traders can take Long position near “Sell Gen” either retesting or crossed from Below & vice-versa i.e. can take Short position near “Buy Gen” either retesting or crossed downward from Above.
L#4: If the candle crossed & stays below the “Sell Gen”, it is treated / considered a Bearish bias.
L#5: Possibility / Probability of REVERSAL near RLS#1 & USTgt
HZB (Buy side) & HZS (Sell side) => Hurdle Zone,
*** Specialty of “HZB#1, HZB#2 HZS#1 & HZS#2” is Sidewise (behaviour in Nature)
Rest Plotted and Mentioned on Chart
Color code Used:
Green =. Positive bias.
Red =. Negative bias.
RED in Between Green means Trend Finder / Momentum Change
/ CYCLE Change and Vice Versa.
Notice One thing: HOW LEVELS are Working.
Use any Momentum Indicator / Oscillator or as you "USED to" to Take entry.
⚠️ DISCLAIMER:
The information, views, and ideas shared here are purely for educational and informational purposes only. They are not intended as investment advice or a recommendation to buy, sell, or hold any financial instruments. I am not a SEBI-registered financial adviser.
Trading and investing in the stock market involves risk, and you should do your own research and analysis. You are solely responsible for any decisions made based on this research.
"As HARD EARNED MONEY IS YOUR's, So DECISION SHOULD HAVE TO BE YOUR's".
Do comment if Helpful .
Do Comment for In depth Analysis.
Follow notification about periodical View

Avalanche AVAX price analysisCRYPTOCAP:AVAX right on the bottom of the 2-year channel!
The price of CRYPTOCAP:AVAX is once again touching the lower boundary of a massive channel that has been forming for more than 24 months.
And what’s interesting — #Avalanche has strong fundamentals, active development, and a “starting” market cap of $5.5B 💰
📈 So… is it finally time for OKX:AVAXUSDT to move up?
🔹 Conservative target: +100% → $26
🔹 Ambitious but realistic: upper channel → $41–42 (+225%)
Looks juicy, right? 🤔
Do you think CRYPTOCAP:AVAX is gearing up for a breakout — or are we in for another round of accumulation?
______________
◆ Follow us ❤️ for daily crypto insights & updates!
🚀 Don’t miss out on important market moves
🧠 DYOR | This is not financial advice, just thinking out loud

DowJones (DJI) IntraSwing Level for 11th - 12th Dec '25(2:30 amFED Rate Cut impact in Indian Financial Market:
Trading approach in NSE BSE
For an Indian trader, Fed cuts with a dovish or balanced guidance usually support:
Short‑term long bias in Nifty/Sensex and high‑quality large caps as flows and sentiment improve.
Overweight stance on IT, financials, autos, and select cyclicals, while closely tracking FPI flow data, dollar index, and USDINR for confirmation
The US Federal Reserve has just delivered its third consecutive rate cut, taking the federal funds target range down to about 3.5%–3.75%, the lowest since 2022. It is also signaling that the pace of further cuts will likely slow, with only very limited easing projected over the next couple of years.
Latest Fed move
The Fed reduced rates by 25 basis points at its December 2025 meeting, following similar cuts in September and October. This “hawkish cut” pattern reflects concern about a softer labor market while still being cautious because inflation is only gradually moving toward the 2% target.
Future cut expectations
Fed projections currently point to only one additional cut in 2026 and another in 2027, implying a very shallow easing path compared with what markets had been pricing in. Officials have stressed that further moves will depend heavily on incoming data on inflation and employment, so the path is explicitly data‑dependent rather than pre‑committed.
Market and global impact
US equities initially rallied on the latest cut, as investors welcomed lower discount rates and a still‑decent growth outlook for 2026. For emerging markets like India, the lower Fed rate tends to ease pressure on the dollar, supports currencies, and can give local central banks more room to consider their own rate cuts if domestic inflation allows
[ Level Interpretation / description:
L#1: If the candle crossed & stays above the “Buy Gen”, it is treated / considered as Bullish bias.
L#2: Possibility / Probability of REVERSAL near RLB#1 & UBTgt
L#3: If the candle stays above “Sell Gen” but below “Buy Gen”, it is treated / considered as Sidewise. Aggressive Traders can take Long position near “Sell Gen” either retesting or crossed from Below & vice-versa i.e. can take Short position near “Buy Gen” either retesting or crossed downward from Above.
L#4: If the candle crossed & stays below the “Sell Gen”, it is treated / considered a Bearish bias.
L#5: Possibility / Probability of REVERSAL near RLS#1 & USTgt
HZB (Buy side) & HZS (Sell side) => Hurdle Zone,
*** Specialty of “HZB#1, HZB#2 HZS#1 & HZS#2” is Sidewise (behaviour in Nature)
Rest Plotted and Mentioned on Chart
Color code Used:
Green =. Positive bias.
Red =. Negative bias.
RED in Between Green means Trend Finder / Momentum Change
/ CYCLE Change and Vice Versa.
Notice One thing: HOW LEVELS are Working.
Use any Momentum Indicator / Oscillator or as you "USED to" to Take entry.
⚠️ DISCLAIMER:
The information, views, and ideas shared here are purely for educational and informational purposes only. They are not intended as investment advice or a recommendation to buy, sell, or hold any financial instruments. I am not a SEBI-registered financial adviser.
Trading and investing in the stock market involves risk, and you should do your own research and analysis. You are solely responsible for any decisions made based on this research.
"As HARD EARNED MONEY IS YOUR's, So DECISION SHOULD HAVE TO BE YOUR's".
Do comment if Helpful .
Do Comment for In depth Analysis.
Follow notification about periodical View

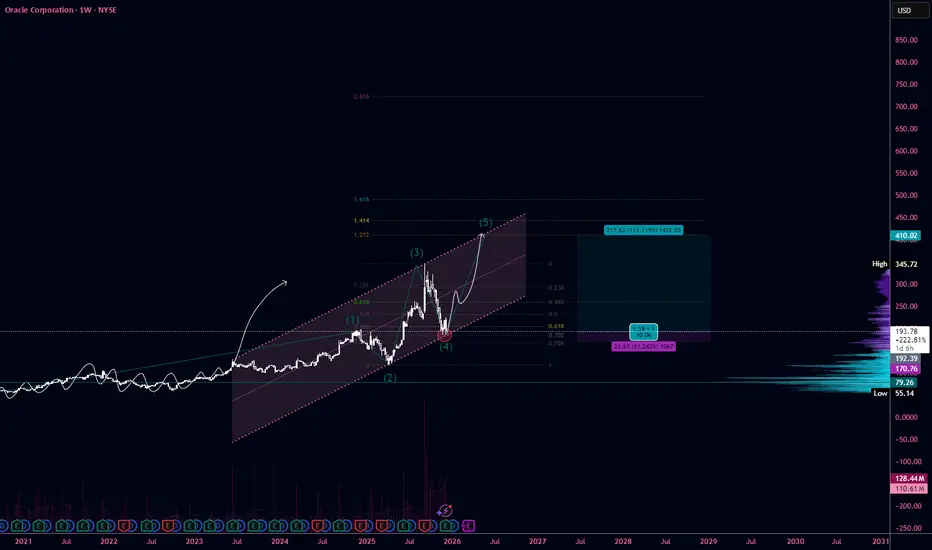
#ORCL R:R 1:10 The start of the fifth wave target $400NYSE:ORCL
TF: 1W
Oracle continues to move within a well-defined ascending channel, forming a clean 5-wave impulsive structure. The price is currently coming out of a completed wave (4) correction, which perfectly tapped into the key retracement zone:
• 0.618–0.786 Fibonacci retracement
• High-volume node on VPVR
• Lower boundary of the rising channel
This creates a strong technical cluster that supports a bullish continuation.
••Main Idea
I expect a full development of the final wave (5), which may extend further as Oracle continues to benefit from cloud growth, AI infrastructure demand, and corporate IT spending.
•••Why This Looks Like Wave (5)
1.Wave (3) was strong and impulsive with a clear vertical expansion.
2.Wave (4) formed a prolonged and corrective pullback — typical for large caps.
3.VPVR shows a dense demand cluster at the correction bottom.
Price respected the long-term trendline and re-entered the channel.
Double Top and Dump simulation (Bearish With Time) Here's a double top scenario slight run to 680. forecasted CMF, MACD, and price action. fits within retracement and time for your Fibonacci nerd.
~$630 11/20/25
~$680 12/30/25
1. Santa rally
2. Gov Shutdown over probably at the 11/20 mark
3. Taco Rally on 11/20 as well
~$650 1/7/25
~$675 2/25/26
~$620 4/16/26
~$600 7/6/26
~$630 7/30/26
~$600 8/21/26
~$550 10/16/26
Just an alternative theory to my blow off top idea.
SP:SPX AMEX:SPY

S&P 500 Breakdown Alert — Rising Wedge Reversal in Play!Today I want to share an S&P 500 index( SP:SPX ) analysis, as this index plays a major role in guiding correlated markets—especially crypto, and particularly Bitcoin( BINANCE:BTCUSDT ).
The S&P 500 index entered the Potential Reversal Zone(PRZ) and resistance zone($6,902_$6,875), where it began to fall.
The S&P 500 index also failed to form new Higher Highs(HH) and Higher Lows(HL), which signals weakening bullish momentum over the past 7 trading sessions.
From a classical technical-analysis perspective, it appears that the S&P 500 index has broken below the lower line of its rising wedge pattern, which is considered a bearish reversal pattern. The index is currently in the process of completing a pullback/retest of the broken structure.
My expectation is that the S&P 500 index may decline at least toward $6,823, and if important support lines break, we could see a deeper correction toward the measured move (target) of the rising-wedge pattern.
What’s your outlook on the S&P 500 index and the U.S. stock market?
First Target: $6,823
Second Target: $6,803
Stop Los(SL): $6,889(Worst)
------------------------------------------------
We should also keep in mind that several important US economic indicators will be released this week, which could significantly impact market direction. So be extra cautious with your positions, especially during data releases:
JOLTS Job Openings➡️09 December
Federal Funds Rate➡️10 December
FOMC Statement➡️10 December
FOMC Press Conference➡️10 December
Unemployment Claims➡️11 December
------------------------------------------------
💡 Please respect each other's opinions and express agreement or disagreement politely.
📌S&P 500 Index Analyze (SPX500USD), 1-hour time frame.
🛑 Always set a Stop Loss(SL) for every position you open.
✅ This is just my idea; I’d love to see your thoughts too!
🔥 If you find it helpful, please BOOST this post and share it with your friends.

MBOX to $0.56MBOX is playing inside a falling channel and it is very close to the bottom , in the coming months it can rise about 4000% to about $0.56 IMO

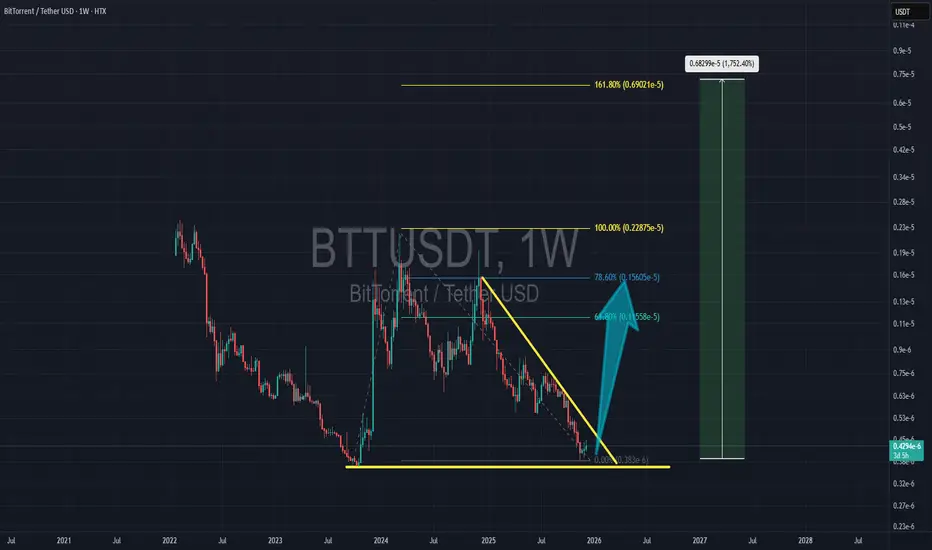
BTT can Rise againBTT is at very bottom price again and it can rise in the coming months to the previous ATH