1:2000Today’s plan was based on separating analysis from execution.
Price reacted strongly from the higher-timeframe 61.8–78.6% Fibonacci demand zone, aligned with a high-volume area, confirming acceptance and interest from buyers. The broader context suggested a potential continuation to the upside, but no trade was taken until structure confirmed it.
Execution trigger:
• Break of the descending structure
• Formation of a clear Higher Low (HL)
• Retest of that HL with rejection
• Momentum confirmation (RSI holding above 50, MACD turning up)
Entry: After HL retest and bullish confirmation
Stop-loss: Below the validated HL (structure-based, not emotional)
Invalidation: Loss of the HL
The focus was not on predicting the move, but on waiting for the market to prove itself.
Patience first, execution second.
Fibonnacci


XRP makes big moves -LONG-DAILY-VIEW-Hello all 🌍😀🙋♂️🙋♀️
Thank you so much for coming today 🌞
Let's dive right in 🏄♂️🏄🌊⏬👇🐼
I am and have been extremely bullish on XRP
🐮🙋♀️🙋♂️WHY?☮️💡🤯
FUNDAMENTALLY:
💠Deflationary in nature🍃 the more XRP that is burned (every transaction, results in a very small fraction of burned token) the more it pushes price of XRP up naturally -supply and demand-
💠XRP is ranked top 5 fastest transaction times of all cryptocurrencies (3-5 seconds)
💠The SEC tried to sue XRP's creator Ripple in 2020 for selling XRP to institutional investors, the lawsuit ended in a 'permanent' injunction against XRP selling to institutions. This could be considered good and bad
💠August 2025 SEC dropped the case and both parties dismissed their appeals
💠 The lawsuit of 2020 didn't stop XRP from outperforming, XRP is currently top 5 cryptocurrencies market cap rating, sitting at 💲130 Billion total (not circulating)
Let's dive in, to the next look 🔍🤸🤸♂️💭⏬🐼
TECHNICALLY:
NOVEMBER 3rd 2023 , XRP price went from .48 cents to 2.9 on DECEMBER 3rd
a 490 percent 💲price increase in just 1 month 🤯 That's a bullish and QUICK🏃♀️🏃♂️💨 jump ⏬⏬🔽👇
⭐👀📍
We have currently made a break from a bearish🐻 descending triangle📐 and it is a strong break at that 💥
If we can continue to gain support 💪 and turn these resistances into fuel ⛽ without getting rejected, XRP price could see some of our bullish 🐂🎯 targets, listed above 📈📉
Let's see!
⌚⌛👀🐶📌😀
Thank you for stopping by and always remember 👇👇
🫡🐴🐲🐸🤖👻👽🙍♂️🙍♀️🫡
🛑🛑🛑This is not financial advice🛑🛑🛑 Above are approximate targets based on fibs and major trend lines etc. I always recommend looking at multiple charts when making a big investment. Always have a stop loss ✋🛑💲 set🆗
Any thoughts 💭💡, questions 🙋♀️🙋♂️❓, good 👍, bad👎, happy 😄 or sad 😥, in the comments always welcome.
Jazerbay 🌠

How to Read Volume Profile + AVWAP — A Complete GuideVolume Profile is one of the most underutilized tools in technical analysis. This guide breaks down how to read it and combine it with AVWAP for a complete market structure framework.
VOLUME PROFILE BASICS
Most traders use volume over time (the bars at the bottom). Volume Profile shows volume at price — where buyers and sellers actually agreed.
Point of Control (POC)
The price with the highest volume. The market's "fair value." Price above POC = bullish bias. Price below = bearish.
Value Area (70%)
The range where most trading occurred. Inside = balance. Outside = imbalance seeking new value.
High Volume Nodes (HVN)
Heavy volume zones. Expect slowdown or reversal. Positions were built here — traders defend them.
Low Volume Nodes (LVN)
Thin volume zones. Price rejected these levels. When price returns, expect fast movement.
ADDING AVWAP
Anchor VWAP to the last significant swing. This shows the average cost basis for everyone who entered during this move.
Price above AVWAP = longs in profit, dips get bought
Price below AVWAP = longs underwater, rallies get sold
The confluence:
POC + AVWAP alignment = high-probability zone
POC + AVWAP divergence = expect reversion
THE FRAMEWORK
Identify POC, VAH, VAL
Mark nearest HVN/LVN above and below
Anchor AVWAP to the swing that started the current move
Determine regime: price above or below AVWAP?
Now you have:
Structure (where will price react?)
Bias (which direction is favored?)
APPLYING THIS DAILY
This is the framework I use every day in my market analysis.
I publish a daily newsletter that applies Volume Profile, AVWAP, and regime analysis to real markets — with specific levels and scenarios for the session ahead.
Happy trading!

USD Index - Potential Bearish Reversal Following ABCD Pattern1. Technical Context:
The USD Index has rallied for four consecutive sessions, recovering from a prior swing low. This recovery has formed a clear harmonic pattern.
2. Pattern & Fibonacci Analysis:
A bullish ABCD pattern is identified on the lower time frame, with its terminal point (D) completing at the exact 0.618 Fibonacci retracement of the preceding down leg. This constitutes a classic pattern completion signal.
The subsequent rally from point D is now testing a Fibonacci resistance cluster at the 0.382 extension level .
3. Interpretation & Bias:
While momentum is currently near-term bullish, the confluence of a completed harmonic pattern at a key Fibonacci retracement provides a compelling potential reversal map. The structure suggests the rally may be corrective (wave B), increasing the probability for a resumption of the prior downtrend (wave C). The setup favors monitoring for bearish price action at the noted resistance for a short entry opportunity.
4. Key Levels:
Resistance Zone: 0.382 Fib Extension
Pattern Invalidation: A sustained break above the 0.618 extension level.
Confirmation: Requires bearish reversal candlesticks or momentum divergence at resistance.

BTC Big Direction is Sell Side At Time BTC move is consolidation Not Found Clear up and Down Move ,Wait for Clear Move for BUY side in GREEN Line & SELL side for a RED Line

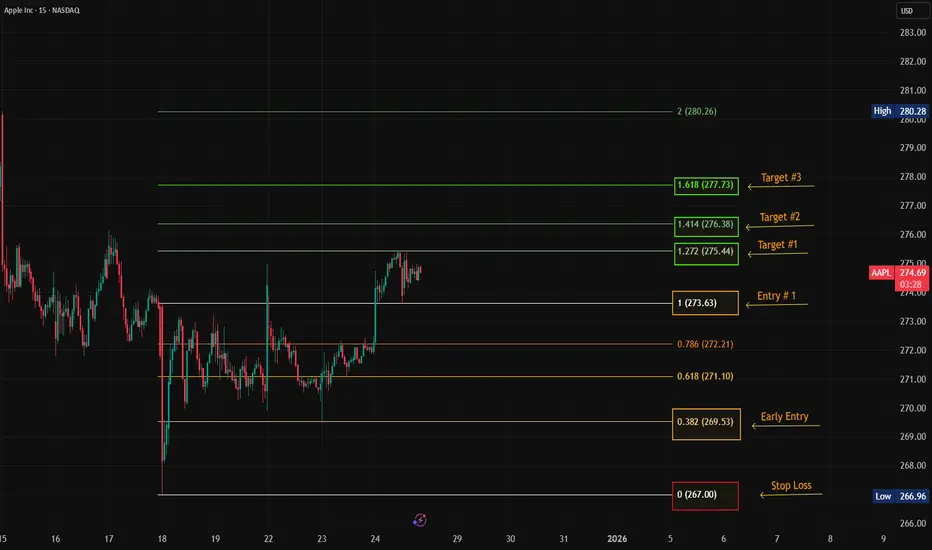
Update On $AAPLGreat Entry! Stop Loss never Triggered. 275 Calls did well this week! NASDAQ:AAPL is priming up for a bigger MOVE! Price rejected the 1.272 level HARD and went back to the 1 level and now attempting the 1.272 again. It wouldn't be surprising if price wanted to go to .786 or 0.618 to find liquidity before proceeding, so keep that in mind as well.
P.S. Do not insult what you lack understanding of. Its not a good look. Tradingview dont let you delete hatin' ahh comments. Its a Stain on your name LOL.
Also, there is nothing bad in being wrong, how else will one learn? Stay positive and optimistic!
Happy Trading Alerts Set!
Platinum’s Nuclear Breakout Is Loading | The Chart Doesn’t LiePlatinum (XPTUSD) — Long-Term Structural Analysis Integrating Elliott Framework, Institutional Order Flow, and Macro Cycles
Platinum’s multi-decade price behavior continues to display a well-ordered impulsive structure consistent with classical Elliott Wave theory, supported by recurring institutional accumulation patterns and strict adherence to Fibonacci geometry. The asset has progressed through a full secular cycle, characterized by deep corrective retracements into high-probability value zones and expansions that consistently terminate at key Fibonacci extension thresholds—behavior typical of markets driven by institutional liquidity flows rather than retail speculation.
Elliott Structure & Fibonacci Alignment
The historical impulse demonstrates strong proportionality across waves.
The initial secular Wave 1 advanced precisely into the 1.618 extension , confirming a minimum impulse threshold.
Wave 2 retraced cleanly to the 0.618 retracement , an area frequently associated with long-horizon institutional repositioning.
The subsequent Wave 3 extended toward the 2.618 level , consistent with the most statistically probable long-cycle expansion target.
Wave 4 repeated the symmetrical 0.618 retracement , reflecting renewed accumulation in a structurally discounted region .
The current multi-year breakout sequence is consistent with an emerging Wave 5 , with a macro-projection aligning toward the 3.618 extension , a historically validated termination zone for commodities in late-cycle impulsive phases.
Macro Market Structure
Platinum has spent an extended period in re-accumulation following a prolonged distribution phase that began after the prior secular peak. Internal structure has now transitioned from compression to early expansion, evidenced by successive breaks of multi-year structural highs and sustained acceptance above formerly capped liquidity zones. This structural shift suggests the market is transitioning from long-term value consolidation into a new secular markup phase.
Institutional Order Flow & Smart Money Dynamics (ICT/SMC Framework)
Price behavior across multiple cycles reveals consistent liquidity targeting:
Corrective waves repeatedly returned to deep discount regions within the 0.618–0.786 “golden pocket,” an area historically associated with institutional accumulation and mitigation of long-horizon order blocks.
Liquidity sweeps above major multi-year highs followed by sustained displacement signal a structural shift in institutional intent.
Current price action demonstrates displacement from an extended accumulation base, confirming that the dominant flow is now upward, with liquidity pools above the historical consolidation range serving as primary targets.
Price Action Context
The market has decisively exited its multi-year equilibrium, printing higher-high/higher-low structures consistent with early-stage impulsive behavior. Breaks of internal liquidity layers reinforce the expectation of continued expansion toward higher-order liquidity pools, aligning with the projected Wave 5 trajectory.
Fundamental Alignment
Underlying fundamentals - including tight supply dynamics, structural deficits within the PGM basket, and tailwinds tied to hydrogen economy applications - reinforce the technical outlook. The confluence of cyclical tightening, inventory compression, and strategic industrial demand supports a durable long-term appreciation phase.
What do YOU think happens next?
Breakout or fake-out? Drop your prediction below!
👇 We are replying to every comment - let’s talk charts .
Smash the 👍 if this helped, hit 🔔 to catch the next setup,
and FOLLOW for more high-probability wave + SMC plays.
⚠️ Disclaimer
This content is for educational and informational purposes only and does not constitute financial, investment, or trading advice. All analyses reflect personal opinions based on publicly available data and chart structures. Markets involve risk, and you should always perform your own research or consult a licensed financial professional before making any trading decisions. Past performance does not guarantee future results.
#Platinum #XPTUSD #CommodityTrading #Breakout #Wave5 #ElliottWave #SmartMoney #SMC #ICT #PriceAction #ParabolicMove #BullishSetup #MarketCycle #Fibonacci #Metals #Macro #TechnicalAnalysis #ChartAnalysis #TradingSignals #TraderCommunity #Investing

$MSTR - Houston, we may have a problem...NASDAQ:MSTR is sitting at a very important spot on it's daily chart. It's important to monitor and consider the moves CRYPTOCAP:BTC makes when doing any sort of analysis on $MSTR. For this chart I have a CRYPTOCAP:BTC chart linked as well and it's also not looking the prettiest .
You'll see my fibonacci set up from the March 2025 lows > July 2025 highs for NASDAQ:MSTR here.
NASDAQ:MSTR broke below the 1.272 fib-extension and attempted to get back above it over the last ~7 trading days but open and closed below it on every daily candle, the weekly candle opened below that level and looks like the chances are ever-growing that it will close below that level as well. This is not a good indicator for a bullish thesis.
There is some possible positives for bulls though, many gaps have been made along the way down to the levels we are at. There are some descending RSI wedges on a few times frames that could result in a nice breakout to the upside if this recover or reverse here.
I'll be watching these levels closely to close out the year.
If there is a break below $153 I anticipate NASDAQ:MSTR will continue to dive down more with the Next Most Likely Reversal/Support Levels being at the 1.618 extension. This could be catastrophic for NASDAQ:MSTR based on their business model and the assumption here would be that CRYPTOCAP:BTC has not reversed either.
If there is a reclamation of the 1.272 fib level along with some CRYPTOCAP:BTC support you could expect some volatile moves to the upside.

GBPUSD 1H Buy Direction , Find Buy Entry Now at this time Price Moving at 1.33950 , Price Struggling to move Down Possible at 1.33704 where have Fibonacci GOLDEN ZONE Area ,1H Order Block that , up side Trend-Line also showing Clear Buy Direction But one more you must to be know 1.33566 is SUPPORT Area May be Possible hit and goes down and hits ALL SL Because this is a Liquated area and then Price GOES UP a BUY Side ,these all possible points where you want to BUY

NIFTY | BANKNIFTY | S&P 500 – Weekly Outlook & Key LevelsNifty closed the week at 25,966, down 80 points from the previous week. The index made a high of 26,047 and a low of 25,726. As discussed earlier, Nifty once again failed to sustain above 26,150 and continues to trade within the broader 26,500–25,700 range.
The 25,700 zone remains a strong support, tested three times in the last two weeks, clearly indicating demand at lower levels. On the daily timeframe, Nifty is showing signs of a bullish “W” pattern, which keeps the bullish bias intact as long as support holds.
Upside Levels (Bullish Confirmation):
Consecutive daily close above 26,150
Targets: 26,325 → 26,492 (important Fibonacci level) → 26,575
Downside Risk (Support Breakdown):
Below 25,700, downside can accelerate towards 25,500 / 25,400
India VIX is currently at its support zone, which increases the probability of a volatility bounce. Expect higher swings and faster moves in the coming sessions.
Key Nifty Levels:
Resistance: 26,150
Support: 25,700
A breakout or breakdown can keep Nifty volatile within the 26,500–25,400 range.
BANKNIFTY WEEKLY ANALYSIS
Bank Nifty closed above the psychological 59,000 level, around 300 points lower on a weekly basis. The index has formed an indecisive doji candle, signaling uncertainty.
Below 58,712 (this week’s low): Downside towards 58,000 / 57,800
Above 59,713 (previous week’s high): Upside resistance at 60,092 / 60,300
S&P 500 – WEEKLY VIEW
S&P 500 closed at 6,834, just 7 points higher than last week, forming an indecisive doji candle. With the Christmas week ahead, major directional moves look unlikely.
The monthly close will be crucial. The current monthly candle is much smaller compared to average candles since Nov’24, indicating compression.
Monthly high breakout: Fresh bullish momentum
Monthly low breakdown: Fast correction likely due to aggressive profit booking
📌 Trade Management: Trail profits strictly and avoid over-leveraging.

Gold (4H) — Supply is holding… for nowContext
On the left of the chart, Gold reached the higher-timeframe C target .
That was a valid place for sellers to take control — and they didn’t.
Price absorbed selling pressure and kept moving.
Now we’re at a different level.
The red zone is the all-time-high supply.
Sellers are active here. Price is being held.
That part matters and shouldn’t be ignored.
What formed under supply
Instead of a dump, price built structure:
A clear base
Liquidity sweep
MSS
A fresh ABC sequence
B held.
B broke A.
That tells me buyers are still participating, even with supply overhead.
Expectation
I’m not expecting an immediate breakout.
What makes sense here is a pullback first.
A revisit into the continuation breaker , clearing inducement and resetting positioning.
If that zone holds and price flips back up, then a break of supply opens the path toward C .
If the structure fails, I step aside.
No forcing it.
Watching how price behaves — not guessing the outcome.
SmellyTaz — decoding chaos.
Not financial advice. Shared for educational purposes only.

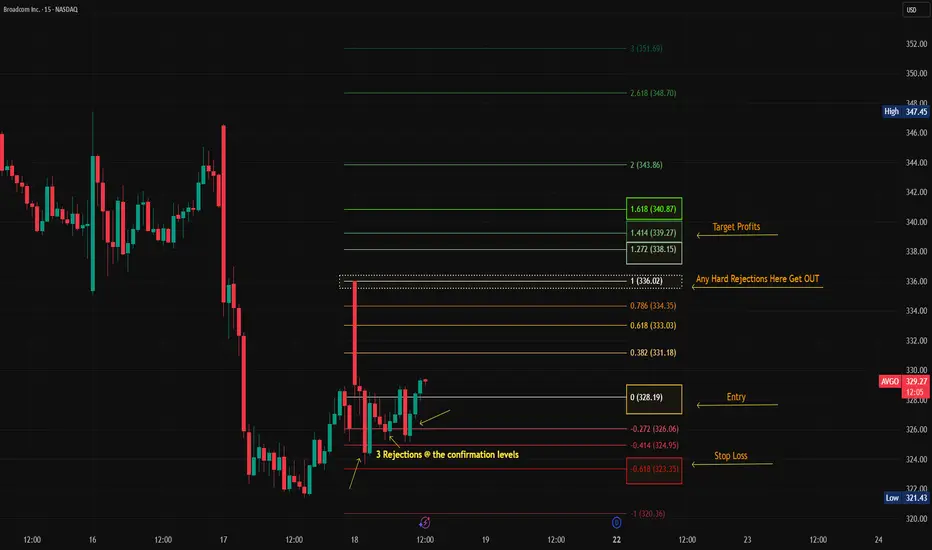
$AVGO there it Go, Go, GONASDAQ:AVGO Pull back candle stopped out 3 times @ the confirmation levels: -0.272 &-0.414. Which leads me to believe that it wants to test the upper Fibs. If price rejects hard at the Level 1 then ill reconsider the target profit levels.
Happy Trading, Alerts Set!
$AAPLNASDAQ:AAPL you owe Me. Lets Get it. Big Bounce back candle is being ENGULFED by green buy candles, so 1.272, 1.414 & 1.618 are all target for this Light show.
Happy Trading, Alerts Set!

$NFLX its showtime!What it dew yall?! So NASDAQ:NFLX came out the gates steaming this morning but has reduce some of its spark as the day has progressed. Price is still in a semi uptrend on the 15 min TF. Price rejected at Level 0. Technically Buyers lost control after we closed below the 0.382, However it's not over until we're under the 0 and because this is an early spot, I have set my S/L at the -.0272 (CLOSE below this level). Where price is right now this would be considered an early Entry, (As long as the EMA's don't flip/ Side note, I use 8/14/21 EMA's). The R:R is Crazyyyyy. Not too much to lose and everything to gain. Plus, Tomorrow is CPI. What could get more crazier right before Christmas? LOL.
Once I learn how to publish my indicators correctly, Ill let yall know.
Happy Trading, Alerts Set!

AUDUSD — Counter-Trend ABC Breathing Inside a Bearish HTF WCLPrice is currently trading inside a fresh bearish higher-timeframe WCL , so any upside here is treated as corrective, not a trend flip.
Within that context, a clean bullish ABC has formed.
B held structurally, displacement followed, and the move left behind a breaker block + FVG , which defines my area of interest.
The idea is simple:
If price revisits this zone and respects it, the path of least resistance is a continuation of the correction toward the ABC C-target , before deeper HTF supply comes into play.
Invalidation is clear.
A break below B kills the sequence entirely.
This is a location-first setup —not a prediction, not a signal.
Always wait for confirmation and trade in alignment with higher-timeframe context.
Not financial advice.

GBPAUD — BC Entry Inside Weekly WCL, Invalidation Below BPrice is trading inside a Weekly WCL after a weekly bearish ABC sequence completed . At that point, momentum fades and location takes control .
Within this context, a bullish ABC formed, and price retraced into the BC / order-block zone .
Entry is mechanical, with invalidation below B , the sequence failure point.
Expectation is simple:
B holds → rotation higher toward the bullish ABC target
B breaks → idea invalidated
Note : when time allows, always wait for confirmation inside the level (sweep, displacement, CISD, etc.).
Structure over prediction.
— SmellyTaz
Disclaimer : This is not financial advice.

Chumtrades XAUUSD Trading Plan NF today🧠 Market Psychology
Expect price to range sideways before a clear breakdown.
Market is waiting for NFP, smart money stays cautious → focus on range trading (4330–4280).
🔴 Resistance (Key Resistance)
4335 – 4340
4318 – 4322
🟢 Support (Key Support)
4260 → Short-term lower range
424X → Swing BUY zone
4204 → Deep pullback, strong swing BUY area
🎯 Trading Expectation
Before news:
Trade the range
Sell high – Buy low
Avoid FOMO in the middle
After news / Breakdown:
Look for deep BUY entries
Focus on 424X – 4204

Nifty, Bank Nifty & S&P 500 Wkly Outlook, Key Levels, Trend. Nifty Weekly Analysis:
Nifty ended the week at 26047, slipping 140 points from the previous close. The index formed a long-legged candle, clearly indicating strong demand emerging from lower levels, even as persistent selling pressure attempted to drag the market down.
As highlighted last week, Nifty largely respected the broader range of 26650–25750. Although the index briefly breached 25750, bulls managed a strong recovery and weekly close above this crucial support, reinforcing its importance.
What’s next for Nifty?
To resume the upward momentum, Nifty needs a consecutive daily close above 26150. Once achieved, the index can move higher to test the following key resistance zones:
26325
26492 (important Fibonacci level)
26575
On the downside, 25700 remains a strong support. A sustained breakdown below 25700 could open the gates for 25600 and 25500.
🔍 Expected Nifty Range for Next Week:
➡️ 26500 – 25700
➡️ 25600 / 25500 only if Nifty sustains below 25700
Bank Nifty Outlook:
Bank Nifty closed at 59389, nearly 400 points lower on a weekly basis and was a major contributor to Nifty’s weakness.
If Bank Nifty manages to sustain above 59600, a recovery towards 60092 (important Fibonacci level) is likely.
A consecutive daily close above 60092 can further extend the rally towards:
60400
60681
On the downside, a break below 58700 may invite a deeper correction towards 58100.
Expected Bank Nifty Range for Next Week:
60500 – 58100
S&P 500 Technical View:
The S&P 500 ended the week at 6827, down nearly 50 points, once again failing to sustain above the strong resistance at 6882.
For the index to restart its upward journey, a consecutive daily close above 6882 is essential. If that happens, upside targets include:
6930
7009
7026 (important Fibonacci level)
On the downside, key support levels to watch are:
6795
6729
6600
Market sentiment will also be influenced by Trump’s announcement regarding a potential attack on Venezuela, making global cues extremely important.
Bonus Tip for Nifty Traders:
In case of a positive opening on Monday, keep a close watch on 26192 — this will act as a crucial intraday and positional level.

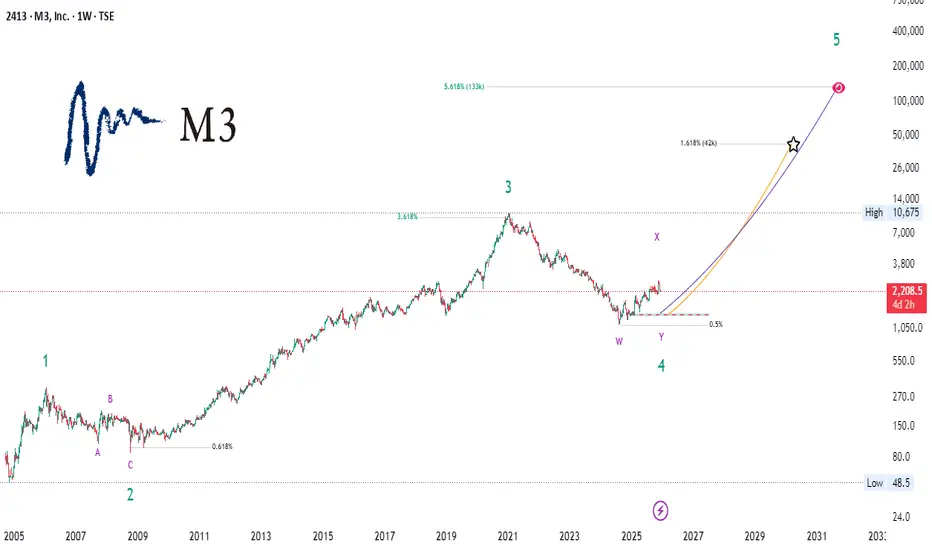
M3 (2413) — Wave 4 Completion and Long-Term StructureM3 (2413) — A Decade-Long Correction May Have Ended | The Architecture of a Potential Supercycle Wave 5
This study examines M3 (TSE:2413) through a deep-time structural lens, highlighting what may be the most technically significant inflection point in the stock’s modern history. By contextualizing the price evolution since 2005 within an Elliott Wave framework, this analysis aims to illuminate the broader architecture that could guide the next multi-year phase.
🔹 Why This Moment Matters
For nearly a decade, M3 has been navigating an extended W–X–Y corrective structure following its major Wave 3 peak. This was no ordinary pause—it was one of the longest and most complex retracements ever recorded in this symbol.
Despite its depth, the correction respected the higher-timeframe trend impeccably:
Termination at the 0.5–0.618 Fibonacci cluster
Structure consistent with a completed higher-degree Wave 4
Price stabilization occurring precisely where long-term cycles often reset
Such convergence across timeframes is rare and often meaningful.
🔹 A Framework for What Comes Next
If Wave 4 has indeed completed, M3 may be entering the foundational phase of Supercycle Wave 5 , historically the most structurally powerful leg in an established growth trend.
This chart outlines two macro trajectories:
Primary Path (Institutional Scenario)
A measured, sustainable advance toward the 1.618 Fibonacci extension , aligning with classical Wave 5 proportion and long-term market symmetry.
Extended Path (Innovation Cycle Scenario)
A more ambitious arc projecting into the 3.618–5.618 zone , reflecting behavior seen in past secular expansion phases—particularly in companies whose growth reaccelerates after prolonged consolidation.
Both paths are illustrated with curvature rather than straight-line projections to better represent the non-linear acceleration patterns commonly observed in late-cycle impulsive structures.
🔹 What the Chart Shows
The completed W–X–Y pattern marking the Wave 4 trough
A multi-year prior impulse (Wave 3) whose Fibonacci relationships remain intact
Historical highs and structural inflection zones for orientation
Two potential long-term trajectories, color-coded for clarity
A convergence of geometry, momentum stabilization, and structural completion—all aligning at the current price region
This confluence forms a compelling technical environment rarely seen on high-timeframe charts.
🔹 Strategic Perspective
This analysis does not make deterministic predictions.
Instead, it provides a macro-structural framework for institutions, portfolio strategists, and long-horizon investors seeking to understand where M3 may be positioned within its secular growth cycle.
Episodes of prolonged corrective unwinding often precede decisive shifts in trend character. If this framework proves correct, M3 may be transitioning from one of its largest consolidations into one of its most expansionary cycles.
🔹 Final Note
This chart is for educational and analytical purposes only.
It does not constitute financial advice.
If you found this useful, feel free to comment with your interpretation of the Wave 4 structure.
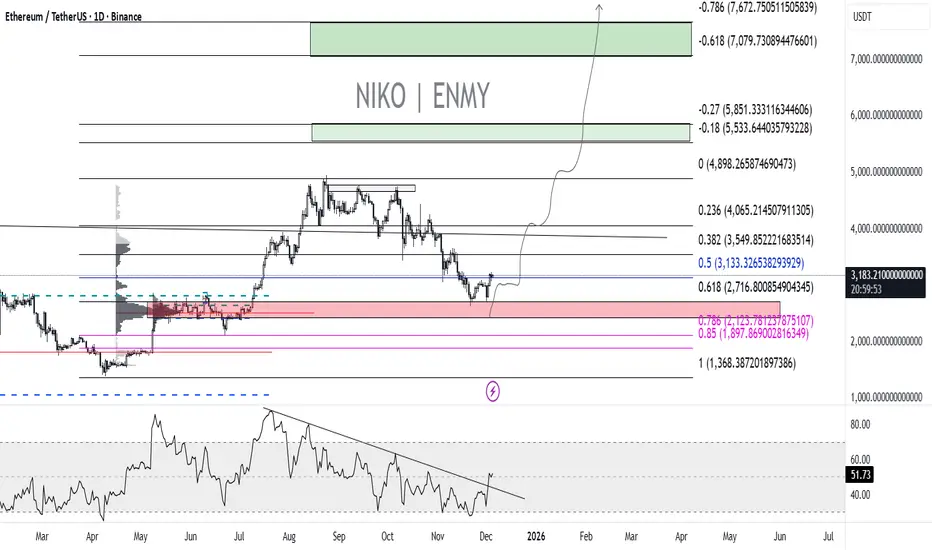
ETH probaly has got the last correctionThe vast majority of traders really expect prices to continue falling, not only for ETH, but across the entire cryptocurrency market. It seems to me that everyone is already disappointed and devastated by all this, so they are not expecting a new ATH. I'm not even talking about unrealistic goals, such as 11-13 thousand for 1 ETHEREUM, not because I'm afraid to say it, not at all, I just want to show the lowest, absolutely logical goals that I see without any special equipment. The first is $5,601, the second is $7,001, and when we get there, we'll keep talking about it.
I believe that everything is much simpler than people try to distinguish and understand. We have a strong bullish trend from 1381 to 5006 with a solid and very valuable imbalance zone of 2301-2830, which is also the 0.618 FIBO level of the entire trend. A perfect correction and reaction from this level. Moreover, we have a breakout of the daily trend line on the RSI. Whatever happens, don't follow me, this is just another opinion. Time will tell who is right.
New ATH Inbound?November delivered a decisive breakout from a ~3‑year consolidation range, confirmed by increased volume and a wide‑spread candle. The breakout shows signs of sustainability, with volume gradually building as price advances toward the upper boundary of the range.
Some caution is warranted: price still needs to clear the all‑time high (ATH), and the nearby LVN zone could present short‑term resistance before continuation.
Entry
• Position: Enter now, aligned with the breakout momentum.
Take Profit Zones
• Primary Target: A straightforward 100% range extension. Given the prolonged reaccumulation, there’s a strong probability price slices through this level.
• Strategy: Trail the stop loss beneath new monthly swing lows to maximize capture of the move.
Invalidation
• Clear invalidation: A break below the November low.

$ADBE — WEEK 49 TREND REPORT NASDAQ:ADBE — WEEK 49 TREND REPORT
Ticker: NASDAQ:ADBE — 12/02/2025 @ 323$
Timeframe: WEEKLY
This is a reactive structural classification of NASDAQ:ADBE based on the weekly chart as of this timestamp. Price conditions are evaluated as they stand — nothing here is predictive or forward-assumptive.
⸻
1) Current Trend Condition
• Trend Duration: +6 weeks (bearish)
• Trend Reversal Level (Bullish): 337.64$
• Trend Reversal Level (Bullish Confirmation): 365.70$
• Structural Support (38.2%): 424.90$
⸻
2) Structure Health
• Retracement Phase:
Breakdown (establishing price beneath 38.2%)
• Position Status:
Unstable (price below both structural layers)
⸻
3) Temperature
• Cooling Phase
⸻
4) Momentum
• Bearish
⸻
5) Market Sentiment
• Bearish
⸻
Author’s Note
This analysis is fully reactive, not predictive. Market conditions, trend structure, and behavior are classified as they appear in real time. The objective is to identify where directional shifts first occurred, where structural integrity remains intact, and where it would begin to weaken if key levels were breached.
Predictive analysis projects outcomes that do not exist yet. Without price confirmation, prediction is built on baseless assumptions. This framework avoids that entirely by responding only to verified structural changes and live conditions.
The levels shown simply identify where the current trend structure first shifted and where it would begin to lose integrity if breached. Recognizing these boundaries allows for clearer interpretation of market behavior without relying on forward guarantees, speculative projections, or unsupported assumptions.
⸻
Methodology Overview
This classification framework evaluates directional conditions using internal trend-interpretation logic that references price behavior relative to its structural layers. These relationships are used to identify when price movement aligns with the framework’s criteria for directional phases, transition points, or regime shifts. Visual elements or structural labels reflect these internal interpretations, rather than explicit trading signals or preset indicator crossovers. This framework is observational only and does not imply future outcomes.
