XRP — Mapping Out the Next High-Probability Long SetupXRP continues to respect key levels, delivering clean setups and strong technical reactions.
📉 Recent Price Action Recap
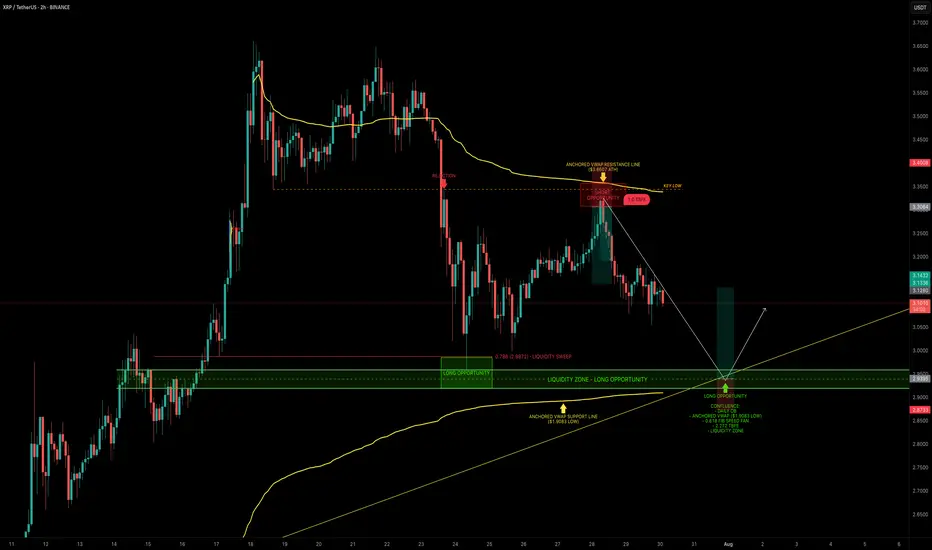
After the flush from $3.65 into the $3.00 support zone, XRP printed a solid bounce back toward the $3.30 resistance area, forming a clean short setup between $3.30–$3.35.
Price is now trading mid-range within the 6-day consolidation.
🟢 Next High-Probability Long Setup
A prime long opportunity lies between $2.96 and $2.9175 sitting within a key daily order block.
Confluence at this zone includes:
Liquidity pool just below the $2.9555 swing low
Anchored VWAP from the $1.9083 swing low resting just under the block
0.618 Fib Speed Fan lining up as dynamic support (July 30 – Aug 2)
2.272 Trend-Based Fib Extension at $2.9297
📈 Long Trade Setup
Entry Zone: $2.96 – $2.9175
Stop Loss: Below anchored VWAP (clear invalidation)
Target: $3.1/$3.13+
R:R: ~1:3+
💡 Educational Insight
This setup is a great example of how multiple tools layered together (like Fibonacci levels, VWAPs, order blocks and liquidity zones) can significantly increase the probability of a trade playing out.
When structure, volume-based tools and time alignment all point to the same area, it creates a high-confluence trade zone. These are the areas where risk is most defined and reward is most favourable, a principle every technical trader should anchor their strategy around.
_________________________________
💬 If you found this helpful, drop a like and comment!
Want breakdowns of other charts? Leave your requests below.
Fibspeedfan
BNX Breakdown: The Next Trade SetupBNX has recently been testing a key resistance zone around the $1 level. After hitting the 0.618 Fibonacci retracement at $1.10, the market shifted into a downtrend. Let's analyse where our next trade opportunity might arise.
Market Structure & Confluence Zones
$1 to $1.1: BNX encountered robust resistance between $1 and $1.1, where the 0.618 Fib retracement aligns perfectly with the fib speed fan (0.618-0.65). Additionally, the anchored VWAP taken from the high at $1.1 aligns beautifully with the $1 mark, adding another robust layer of resistance. This convergence reinforces the strength of this zone and signals potential continuation of the downtrend.
Recent price action shows that BNX has repeatedly bounced off the 0.618/0.666 levels during small downward corrections.
Moving Averages on the 1-Hour Chart: The 21 EMA/SMA on the 1-hour timeframe is clustering between $0.97 and $1, providing additional confirmation of the resistance and offering an ideal entry region for short trades.
Primary Short Trade Setup
Given the multiple confluences around the resistance zone, our main focus is a short trade with a well-defined laddering strategy:
Entry Strategy (Laddering): Initiate short positions with staggered entries between $0.97 and $1.019. This dollar-cost averaging (DCA) approach allows for flexibility and optimises your entry as price tests the resistance zone.
Stop Loss (SL): Place your stop loss around $1.0375, just above the Point of Control (POC) or the previous high in this range to effectively manage risk.
Target: Aim for a profit target at $0.8. This target is supported by multiple technical indicators.
Risk/Reward Ratio: With these levels, you are looking at an approximate risk/reward ratio of 4:1 or better, depending on your specific DCA weighting.
Confirmation: As always, await confirmation through order flow analysis and the appearance of rejection candles at key levels before entering the trade.

WARNING: Most won't see this coming nextIn typical crypto twitter speak, "bears will get rekt", comes to mind.
This is a interesting set of similarities playing out on ETH.
ETH has been incredibly deflationary lately due to the meme coin mania.
This could be the next hyper narrative for ETH and rally a lot sooner than people expect.
