FICO and the FedNow that NYSE:UNH has started to pick up due to the shares acquired by many large names, we need to turn our attention to companies not yet in the news cycle. One of these companies is NYSE:FICO , which handles credit worthiness scores. But why, in a time where home buyers and consumers are being crushed at every turn, would a credit solutions agency be a good buy? The answer is because it is forward looking, and we are looking toward a time of, more likely than not, lower interest rates.
First let’s look at the charts...
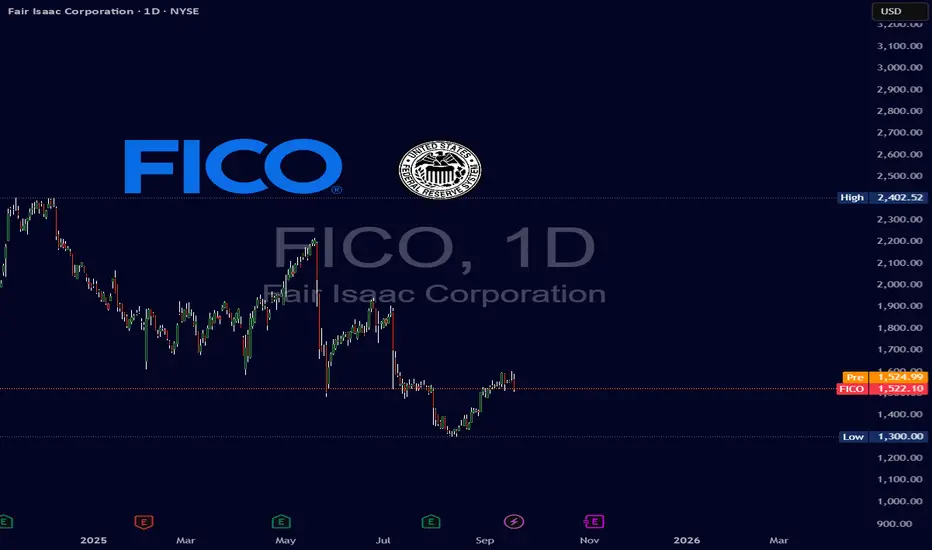
As you can see, from the all-time high, FICO is at a 40% discount. So, we are following the universal rule of buying low. Now all we must do is sell high. Based on Powell's speech at Jackson Hole, we can see that the Fed is gearing up to cut interest rates. You can also see this is the case with the amount of debt-buying taking place in the bond market...
So, the problem is not IF they'll cut rates, but WHEN and by how much. In agreement with what most people see coming, expect the next meeting to lead to a 25 bps drop in the $FRED:FEDFUNDS. When this happens, you can also expect the credit agencies to blast off onto the horizon. (Written before Sep 16-17 meeting)
Before we get to the exit plan, we do have some housekeeping. It should be noted that FICO, in the practical sense, is no longer a monopoly. Equifax has been approved for its rating system by the government, so this trade does not come without risk. The good news is that as rates get lowered we can expect more people to take on more debt (because it is cheaper), which will boost the demand for FICO's rating abilities. We should aim for a timeframe before the next earnings call to get out of this trade, but the usual target of 3 to 6 months remains as the timeframe for holding this position. A longer period can be justified based off any unusual performance. The price target will be set at $2,000.
FICO
FICO's Monopoly: Cracks in the Credit Kingdom?For decades, Fair Isaac Corporation (FICO) has maintained an unparalleled grip on the American credit system. Its FICO score became the de facto standard for assessing creditworthiness, underpinning virtually every mortgage, loan, and credit card. This dominance was cemented by a highly profitable business model: the three major credit bureaus—Equifax, Experian, and TransUnion—each paid FICO for independent licenses, generating a significant percentage of revenue per inquiry and establishing a seemingly unassailable monopoly.
However, this long-standing reign now faces an unprecedented challenge. The Federal Housing Finance Agency (FHFA) Director, Bill Pulte, recently signaled a potential shift to a "2-out-of-3" model for credit bureaus. This seemingly technical adjustment carries profound implications, as it could render one of FICO's three bureau licenses redundant, potentially evaporating up to 33% of its highly profitable revenue. Director Pulte has also publicly criticized FICO's recent 41% increase in wholesale mortgage score fees, contributing to significant declines in FICO's stock price and drawing broader regulatory scrutiny over its perceived anti-competitive practices.
This regulatory pressure extends beyond FICO's immediate revenue, hinting at a broader dismantling of the traditional credit monopoly. The FHFA's actions could pave the way for alternative credit scoring models, like VantageScore, and encourage innovation from fintech companies and other data sources. This increased competition threatens to reshape the landscape of credit assessment, potentially leading to a more diversified and competitive market where FICO's once-unchallenged position is significantly diluted.
Despite these formidable headwinds, FICO retains considerable financial strength, boasting impressive profit margins and robust revenue growth, particularly within its Scores segment. The company's Software segment, offering a decision intelligence platform, also presents a significant growth opportunity, with projected increases in annual recurring revenue. While FICO navigates this pivotal period of regulatory scrutiny and emerging competition, its ability to adapt and leverage its diversified business will be crucial in determining its future role in the evolving American credit market.
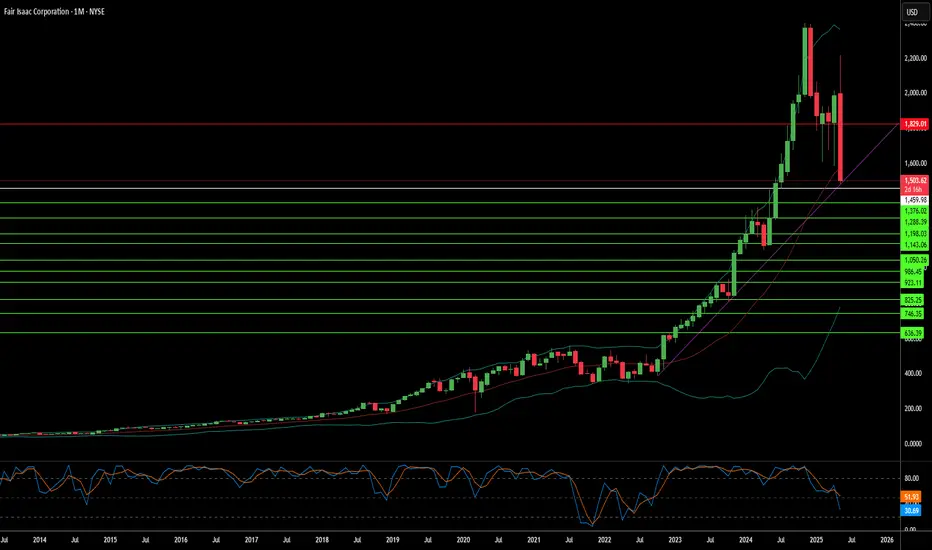
Will $FICO continue its ascend? After the bottom in May of 2022, the price gapped up and broke through its resistance in $550.
Then formed a base to digest this move before continuing its trend up, this was my signal to buy as it broke out above $636. After that it didn't follow through and its RSI signaled weakness so I sold.
I don't like to hold positions that aren't going anywhere even if I'm on profit.
Still, its relative strength againts its benchmark ( AMEX:IJH ) shows leadership and the price is still near highs so, I'll wait and see if it can breakout this base-over-base.
The RS ratio already broke out, the price could follow.
If not, I won't buy it again.

What Are Fibonacci Retracements and Fibonacci Ratios?How Fibonacci Ratios Work
Before we can understand why these ratios were chosen, let's review the Fibonacci number series.
The Fibonacci sequence of numbers is as follows: 0, 1, 1, 2, 3, 5, 8, 13, 21, 34, 55, 89, 144, etc. Each term in this sequence is simply the sum of the two preceding terms, and the sequence continues infinitely. One of the remarkable characteristics of this numerical sequence is that each number is approximately 1.618 times greater than the preceding number. This common relationship between every number in the series is the foundation of the ratios used by technical traders to determine retracement levels.
The key Fibonacci ratio of 61.8% is found by dividing one number in the series by the number that follows it. For example, 21 divided by 34 equals 0.6176, and 55 divided by 89 equals about 0.61798.
The 38.2% ratio is discovered by dividing a number in the series by the number located two spots to the right. For instance, 55 divided by 144 equals approximately 0.38194.
The 23.6% ratio is found by dividing one number in the series by the number that is three places to the right. For example, 8 divided by 34 equals about 0.23529.
Fibonacci Retracement and Predicting Stock Prices
For unknown reasons, these Fibonacci ratios seem to play a role in the stock market, just as they do in nature. Technical traders attempt to use them to determine critical points where an asset's price momentum is likely to reverse.
Fibonacci retracements are the most widely used of all the Fibonacci trading tools. That is partly because of their relative simplicity and partly due to their applicability to almost any trading instrument. They can be used to draw support lines, identify resistance levels, place stop-loss orders, and set target prices. Fibonacci ratios can even act as a primary mechanism in a countertrend trading strategy.
Fibonacci retracement levels are horizontal lines that indicate the possible locations of support and resistance levels. Each level is associated with one of the above ratios or percentages. It shows how much of a prior move the price has retraced. The direction of the previous trend is likely to continue. However, the price of the asset usually retraces to one of the ratios listed above before that happens.
The following chart illustrates how a Fibonacci retracement appears. Most modern trading platforms contain a tool that automatically draws in the horizontal lines. Notice how the price changes direction as it approaches the support and resistance levels.
Fibonacci Retracement Pros and Cons
Despite the popularity of Fibonacci retracements, the tools have some conceptual and technical disadvantages that traders should be aware of when using them.
The use of the Fibonacci retracement is subjective. Traders may use this technical indicator in different ways. Those traders who make profits using Fibonacci retracement verify its effectiveness. At the same time, those who lose money say it is unreliable. Others argue that technical analysis is a case of a self-fulfilling prophecy. If traders are all watching and using the same Fibonacci ratios or other technical indicators, the price action may reflect that fact.
The underlying principle of any Fibonacci tool is a numerical anomaly that is not grounded in any logical proof. The ratios, integers, sequences, and formulas derived from the Fibonacci sequence are only the product of a mathematical process. That does not make Fibonacci trading inherently unreliable. However, it can be uncomfortable for traders who want to understand the rationale behind a strategy.
Furthermore, a Fibonacci retracement strategy can only point to possible corrections, reversals, and countertrend bounces. This system struggles to confirm any other indicators and doesn't provide easily identifiable strong or weak signals.
The Bottom Line
Fibonacci trading tools suffer from the same problems as other universal trading strategies, such as the Elliott Wave theory. That said, many traders find success using Fibonacci ratios and retracements to place transactions within long-term price trends.
Fibonacci retracement can become even more powerful when used in conjunction with other indicators or technical signals. Investopedia Academy's Technical Analysis course covers these indicators as well as how to transform patterns into actionable trading plans.

American Express suggests continuation of downtrendThanks for viewing,
I'll give my technical and fundamental view briefly;
Technical;
- After the sharp drop from February highs AMEX has under-performed the market - dipping ~51%,
- This compares to an over 80% drop in 2009,
- The dip was followed by the formation of a rising wedge, which normally indicates continuation of the trend preceding the pattern (which is down),
- Elliot Wave seems to also suggest continuation - with wave (5) down possible,
- The 55 EMA showing resistance,
- I see potential support below at $60, $57, and the $50 - but if the stock equals its 2008-9 drop in % terms we are looking at sub-$25.
Fundamental;
- Credit Card (and charge card) Companies have a licence to print money, all payments made on credit expand the monetary supply (inflationary) - until debt is extinguished (deflationary). Over the past 10 years, they have been able to borrow at negative real rates and pocket the spread. But when the economy turns down, these Companies are hit hard by defaults,
- Even in good times, retailers balk at being charged 6% per charge card transaction,
- What are air miles gained on transactions worth these days when no-one is flying?,
- From the last recession, I read one consumer credit exec talking about the increase in defaults in terms of MULTIPLES of the rise in unemployment www.forbes.com). They didn't say what multiple, but If the multiple is just 1, then the default rate (which would impact shadow banking, consumer credit, and unsecured lenders first and worst) could jump to 20-25% of all outstanding debt balances (pre-crisis unemployment below 4% and estimated to exceed 30% by Goldman Sachs). Even a 1.5 multiple would yield 35% default rates. Who knows how things will shake out,
- It will all depend on the underwriting standards over the past few years, if newly signed-up customers are among the most credit-worthy, then things won't be so bad (data suggests that default rates even among CC customers with FICO scores above 740 have tripled recently www.forbes.com). If, when times were good cards were sent to anyone with a pulse then things won't be as great,
- The Fed is buying distressed ABS and MBS securities, apparently without regard for the creditworthiness of the underlying security, it is feasible that all this credit card debt packaged up and sold as an asset backed security has/will be been sold to the Fed at 100 cents on the dollar as it started to show signs of rising defaults in the underlying assets. This is a positive factors for the Company - I have doubts if it is positive for the economy down the line,
- CC Companies are offering repayment holidays - possibly in part to defer incurring defaults - this will of course impact on profitability.
- It all depends how you see this crisis - as being better or worse than 2008-9. My view is that this is many times worse, but that is just me. There are many reasons to expect higher defaults as compared to 2008-9 in an economy that has stopped on a dime,
- Today's dividend yield of 1.79% seems insufficient to compensate investors for the higher risk associated with holding equities - considering the stock is down over 30% from Feb highs. This is my view in general as well, a lot of stocks are "growth" stocks, which do not pay (in my view) a high enough risk-adjusted dividend to be worth owning. This is all gravy when the stock is rising, but when the dividend is below inflation AND the stock is losing value, there is less incentive for an investor to hold firm. If you combine this with a tendency of this stock to significantly underperform the market in recessions then you understand the basis for my bearish view.
So, overall, this stock rides high when times are good and has a history of being impacted more than the average. I don't see why that wouldn't still apply.
Cheers, and protect those funds
