$AVAX: Avalanche – Snowballing Gains or Melting Away?(1/9)
Good evening, everyone! 🌙 CRYPTOCAP:AVAX : Avalanche – Snowballing Gains or Melting Away?
With AVAX at $23.07, is this blockchain beast a sleeper hit or a slippery slope? Let’s avalanche into it! 🔍
(2/9) – PRICE PERFORMANCE 📊
• Current Price: $ 23.07 as of Mar 25, 2025 💰
• Recent Move: Up from $18, below $40 highs, per data 📏
• Sector Trend: Crypto volatile, AVAX rides the waves 🌟
It’s a rollercoaster—hold tight for the drop! ⚙️
(3/9) – MARKET POSITION 📈
• Market Cap: Approx $9.56B (414.78M tokens) 🏆
• Operations: Scalable L1 for DeFi, dApps, subnets ⏰
• Trend: $1.121B DeFi TVL, whale buys, per posts on X 🎯
Firm in L1 race, but market’s a blizzard! 🚀
(4/9) – KEY DEVELOPMENTS 🔑
• Whale Action: 500K tokens moved, per posts on X 🌍
• DeFi Strength: $1.121B TVL holds firm, per data 📋
• Market Vibe: Bearish Fear Index (34), yet resilient 💡
Snowballing quietly amid crypto storms! ❄️
(5/9) – RISKS IN FOCUS ⚡
• Market Correction: Bearish pressure could sink it 🔍
• Competition: Solana, Ethereum vie for dApps 📉
• Macro Woes: Trade tensions, rates shake things ❄️
It’s a chilly slope—brace for ice! 🛑
(6/9) – SWOT: STRENGTHS 💪
• Scalability: 4,500 TPS, beats rivals 🥇
• DeFi Base: $1.121B TVL, solid ecosystem 📊
• Adoption: Enterprise use grows, per data 🔧
Got a snowy peak of potential! 🏔️
(7/9) – SWOT: WEAKNESSES & OPPORTUNITIES ⚖️
• Weaknesses: Volatility, high off $59 peak 📉
• Opportunities: Whale buys, subnet growth 📈
Can it snowball or melt under pressure? 🤔
(8/9) – POLL TIME! 📢
AVAX at $23.07—your take? 🗳️
• Bullish: $30+ soon, whales fuel it 🐂
• Neutral: Steady, risks balance out ⚖️
• Bearish: $18 looms, correction hits 🐻
Chime in below! 👇
(9/9) – FINAL TAKEAWAY 🎯
AVAX’s $23.07 price tags a volatile gem 📈, with DeFi strength but market risks 🌿. Dips are our DCA jackpot 💰—buy low, ride high! Gem or bust?
Finance

Why we think SBC Medical Group is set for a rebound soon.Executive Summary:
SBC Medical Group Holdings Incorporated has emerged as one of the more compelling names in the post-SPAC public company landscape. Having successfully completed its business combination with Pono Capital Two, Inc. on 17 September 2024, the Japan-based aesthetic medical services provider now trades on Nasdaq under the ticker “SBC”. The SPAC merger valued the company at approximately USD1 billion and provided it with over USD11.7 million in net proceeds; capital that SBC intends to deploy strategically for international growth and asset diversification.
Key Investment Pointers:
At the heart of SBC Medical’s proposition is its extensive network of franchised and managed clinics in Japan, with forays into Vietnam and the United States. The company offers management services to cosmetic surgery and aesthetic dermatology clinics under the renowned “Shonan Beauty Clinic” brand, covering procurement, HR, customer loyalty, and more.
The SPAC listing has provided it with both visibility and liquidity at a time when demand for aesthetic healthcare continues to rise across Asia and globally.
The Group’s third-quarter results, covering the period ended 30 September 2024, underscore its operational strength. SBC posted total net revenues of USD53.1 million for Q3, a 12.3% year-on-year increase. Gross profit surged to USD43.2 million, yielding a gross margin of over 81%, reflective of the company’s high-margin service model.
While operating income dipped compared to the prior year due to a one-off non-cash stock-based compensation expense of USD12.8 million, net income for the nine-month period still rose to USD40.1 million, a 60% increase compared to the same period in 2023.
Its balance sheet tells a story of disciplined financial management and scalability. As of 30 September 2024, SBC held USD137.4 million in cash and cash equivalents, up from USD103 million at the end of 2023.
The company also saw a significant reduction in total liabilities from USD115 million to USD91 million, while shareholder equity rose to over USD205 million. These figures point to a solid capital base capable of absorbing strategic investments and macroeconomic volatility.
In a move that has drawn considerable market attention, SBC Medical has also initiated a diversification of its corporate treasury into Bitcoin.
With the cryptocurrency having rebounded strongly to the USD86,000 level, SBC’s entry appears both timely and calculated. While the exact volume of the acquisition has yet to be disclosed publicly, the Group has indicated that its Bitcoin holdings are part of a broader strategy to preserve purchasing power in a globally inflationary environment and align itself with digital-native investors. The decision places SBC in the company of firms like MicroStrategy and Tesla, which have similarly sought value preservation through Bitcoin.
The strategic trifecta of a successful SPAC listing, strong underlying financials, and an asset diversification play into Bitcoin positions SBC Medical favourably in the eyes of institutional investors. With Q4 results expected soon and a bullish cryptocurrency market supporting sentiment, SBC could well be on the cusp of a re-rating by the market.
If its fundamentals remain sound—as recent filings suggest—they may indeed ride the same momentum wave currently lifting digital assets and new-age healthcare stocks alike.

CAKEUSDT (PancakeSwap): Sweet Gains or Stale Trade?(1/9)
Good afternoon, everyone! ☀️ CAKEUSDT (PancakeSwap): Sweet Gains or Stale Trade?
With CAKE at $2.599, is this DEX token a tasty treat or a flat pancake? Let’s flip the details! 🔍
(2/9) – PRICE PERFORMANCE 📊
• Current Price: $ 2.599 as of Mar 25, 2025 💰
• Recent Move: Consolidating $2.6-$2.8, up from $2.34, per data 📏
• Sector Trend: Crypto steady, DeFi mixed amid trade tensions 🌟
It’s a flip-flop—value might be cookin’! ⚙️
(3/9) – MARKET POSITION 📈
• Market Cap: Approx $760M (292M circulating) 🏆
• Operations: Leading BNB Chain DEX, yield farming, staking ⏰
• Trend: Deflationary model burns 102% minted, per data 🎯
Firm in DeFi, but volatility’s the spice! 🚀
(4/9) – KEY DEVELOPMENTS 🔑
• Recent Surge: Up 45% earlier in March, per X posts 🌍
• Platform Updates: Expanded NFT marketplace, per web data 📋
• Market Reaction: High volume ($230M daily), showing interest 💡
Adapting to DeFi trends, cooking up growth! 🍳
(5/9) – RISKS IN FOCUS ⚡
• Regulatory Risks: Crypto scrutiny could hit DEXs 🔍
• Market Volatility: Crypto swings could drag price down 📉
• Competition: Other DEXs like Uniswap challenge, per data ❄️
It’s a risky recipe—watch the heat! 🛑
(6/9) – SWOT: STRENGTHS 💪
• DEX Leader: Top on BNB Chain, strong user base 🥇
• Deflationary Model: Burns tokens, potentially boosts value 📊
• High Volume: $230M daily, per data, shows activity 🔧
Got a sweet spot in DeFi! 🏦
(7/9) – SWOT: WEAKNESSES & OPPORTUNITIES ⚖️
• Weaknesses: Price volatility, regulatory fears 📉
• Opportunities: DeFi adoption, new features like lending 📈
Can it rise or get burned? 🤔
(8/9) – POLL TIME! 📢
CAKE at $2.599—your take? 🗳️
• Bullish: $3+ soon, DeFi booms 🐂
• Neutral: Steady, risks balance gains ⚖️
• Bearish: $2 drops, market sours 🐻
Chime in below! 👇
(9/9) – FINAL TAKEAWAY 🎯
CAKE’s $2.599 price reflects consolidation, with strengths in its platform and deflationary model, but risks from market volatility and competition persist. DCA-on-dips could be a strategy to average in over time, banking on long-term growth. Gem or bust?

$XAUUSD (Gold): Golden Rally or Gilded Pause?(1/9)
Good morning, everyone! ☀️ XAUUSD (Gold): Golden Rally or Gilded Pause?
With gold at $3,020.82, is this safe-haven surge a treasure or a tease? Let’s sift through the shine! 🔍
(2/9) – PRICE PERFORMANCE 📊
• Current Price: $ 3,020.82 per ounce as of Mar 25, 2025 💰
• Recent Move: Near $3,057 high from Mar 20, per data 📏
• Sector Trend: Precious metals up on tension, per posts on X 🌟
It’s a golden glow—let’s see if it holds! ⚙️
(3/9) – MARKET POSITION 📈
• Global Role: Top safe-haven asset ⏰
• Drivers: Central bank buying, geopolitical risks 🎯
• Trend: Bullish near $3,000, per data 🚀
Firm as a refuge, shining in uncertainty! 🏦
(4/9) – KEY DEVELOPMENTS 🔑
• Geopolitical Boost: Trade tensions linger, per data 🌍
• U.S. Data: PMI strength supports USD, caps gold, per posts on X 📋
• Market Reaction: Consolidating near $3,020-$3,030 💡
Simmering in a tense market! 🌩️
(5/9) – RISKS IN FOCUS ⚡
• Profit-Taking: Post-$3,000 sales loom 🔍
• U.S. Rates: Policy shifts could hit, per data 📉
• Oil Prices: CAD link affects broader forex ❄️
It’s a shiny tightrope—watch your step! 🛑
(6/9) – SWOT: STRENGTHS 💪
• Safe Haven: Thrives in chaos, per posts on X 🥇
• Central Banks: Steady buying props it up 📊
• Green Demand: Key in renewables, per data 🔧
Got a golden backbone! 🌟
(7/9) – SWOT: WEAKNESSES & OPPORTUNITIES ⚖️
• Weaknesses: Volatility from profit-taking 📉
• Opportunities: More tensions, rate cuts 📈
Can it gleam higher or dim out? 🤔
(8/9) – POLL TIME! 📢
Gold at $3,020.82—your take? 🗳️
• Bullish: $3,100+ soon, rally rolls 🐂
• Neutral: Steady, risks balance out ⚖️
• Bearish: $2,950 looms, correction hits 🐻
Chime in below! 👇
(9/9) – FINAL TAKEAWAY 🎯
Gold’s $3,020.82 price tags a safe-haven rally 📈, but volatility’s in the mix 🌿. Dips are our DCA jackpot 💰—buy low, ride high! Gem or bust?

$USDCAD – Dollar Dominance or Canadian Comeback?(1/9)
Good evening, everyone! 🌙 USDCAD – Dollar Dominance or Canadian Comeback?
With USDCAD at 1.43180, is the US dollar’s reign continuing, or is the Canadian dollar poised for a resurgence? Let’s dive into the currency markets! 🔍
(2/9) – PRICE PERFORMANCE 📊
• Current Rate: 1.43180 as of Mar 24, 2025 💰
• Recent Move: Up from 1.3700 in Apr 2024, showing US dollar strength 📏
• Sector Trend: Currency markets volatile, driven by economic indicators and policies 🌟
It’s a dynamic market—let’s see what’s driving the dollar’s dominance! ⚙️
(3/9) – MARKET POSITION 📈
• Exchange Rate: USDCAD reflects USD value against CAD 🏆
• Coverage: Influenced by interest rates, economic growth, commodity prices ⏰
• Trend: US dollar strengthening, CAD weakening, per price movement 🎯
Firm in its position, but can the CAD make a comeback? 🚀
(4/9) – KEY DEVELOPMENTS 🔑
• Interest Rates: US rates higher than Canada’s, attracting investment to USD 🌍
• Commodity Prices: Potential drop in oil prices weakening CAD, per data 📋
• Economic Growth: US economy outperforming Canada, per reports 💡
These factors are stirring the pot! 🛢️
(5/9) – RISKS IN FOCUS ⚡
• Interest Rate Changes: Fed or BoC policy shifts can alter the landscape 🔍
• Commodity Market: Volatility in oil and other commodities affects CAD 📉
• Global Economy: Economic slowdowns or recoveries impact currency values ❄️
It’s a risky dance—watch your steps! 🛑
(6/9) – SWOT: STRENGTHS 💪
• US Dollar: Higher interest rates, safe haven status, strong economy 🥇
• Canadian Dollar: Supported by commodity exports, diversified economy 📊
Both have their strengths, but the balance tips towards USD currently! 🏦
(7/9) – SWOT: WEAKNESSES & OPPORTUNITIES ⚖️
• US Dollar Weaknesses: Potential overvaluation, trade tensions 📉
• Canadian Dollar Opportunities: Rising commodity prices, tech sector growth 📈
Can CAD turn the tables or will USD continue to dominate? 🤔
(8/9) – POLL TIME! 📢
USDCAD at 1.43180—your take? 🗳️
• Bullish on USD: 1.50+ soon, dollar’s dominance continues 🐂
• Neutral: Sideways movement, risks balance out ⚖️
• Bullish on CAD: 1.40 below, Canadian dollar rebounds 🐻
Chime in below! 👇
(9/9) – FINAL TAKEAWAY 🎯
USDCAD’s 1.43180 price reflects US dollar strength 📈, but CAD has its own aces up its sleeve. Strategic trading could be key to navigating this pair. Gem or bust?

Ion Beam Applications S.A. (IBAB) 1WTechnical Analysis
The chart shows a breakout of the weekly ascending trendline and the formation of a "rising wedge", indicating a potential decline.
Key Levels:
- Support: 11.46 EUR, 9.00 EUR
- Resistance: 13.06 EUR, 14.01 EUR
Fundamental Analysis
Ion Beam Applications is a leader in radiation therapy and medical accelerators.
Factors influencing the stock:
- Financials: Revenue growth but high volatility.
- Macroeconomics: Interest rate impact on the tech sector.
- Competition: Rivalry with Varian and Elekta.
A breakdown below 11.46 EUR could open the way to 9.00 EUR. To regain an uptrend, the stock needs to reclaim 13.06 EUR.

Crown Castle Inc. (CCI) 1WTechnical Analysis
- The weekly chart of Crown Castle Inc. (CCI) shows a potential reversal after a prolonged downtrend.
- A breakout above the descending trendline and consolidation above $110.85 (0.786 Fibonacci) could signal the start of an upward movement.
- Key Resistance Levels: $132.06 – $146.95 – $161.85 – $180.28 – $210.07.
- Key Support Zone: $83.83 - $90.
- CCI and RSI indicators confirm improving sentiment.
A sustained breakout above $110-112 could lead to mid-term growth.
Fundamental Analysis
Crown Castle is one of the largest telecommunications infrastructure operators in the US.
- Stable revenues due to long-term contracts with telecom providers.
- Dividend yield of ~6%, making it attractive for long-term investors.
- 5G expansion and IoT growth create long-term opportunities.
Risks: High debt burden, interest rate impact, and competition with American Tower.
CCI has growth potential if it breaks above the $110-112 zone. However, macroeconomic risks remain relevant.

ATPC’s Selling Pressure Eases an Shows Signs of AccumulationAgape ATP Corporation (NASDAQ: ATPC) has seen a noticeable shift in its trading dynamics in recent weeks, as technical indicators point to a subsiding of selling pressure and early signals of possible fund accumulation. Following a volatile start to 2025, the stock is now displaying signs of base-building that could pave the way for a potential recovery.
From Capitulation to Consolidation
The counter experienced sharp declines earlier in the year, with a significant drop towards the $0.90 level in early March – a move that bore hallmarks of panic selling or capitulation. However, since hitting this low, the stock has stabilised and is now trading steadily within the $1.04–1.05 range. This stabilisation, coupled with narrower daily candle ranges and subdued volume, suggests that the worst of the selling pressure may now be behind.
Adding to this view are recent candlesticks with extended lower wicks – a classic signal of buying interest emerging on dips. The price action appears to be forming a technical base, potentially supported by buyers absorbing selling flows at lower levels.
Signs of Institutional Interest
While the price remains below its longer-term moving averages (MA120 at $1.38 and MA250 at $2.69), the flattening of shorter-term moving averages – MA5 ($1.034), MA10 ($1.031), and MA20 ($1.045) – is worth noting. These moving averages are now converging, hinting at a possible shift in momentum from bearish to neutral, or even bullish, if confirmed by subsequent price action.
A spike in volume observed in late February also lends credence to the idea of accumulation. Unlike speculative volume surges that tend to be followed by erratic moves, the stock’s ability to retain its gains and enter into consolidation territory suggests that stronger hands may be quietly positioning themselves.
The relatively modest turnover reading of 0.007 also supports this theory, indicating that accumulation may be occurring under the radar, without triggering undue volatility – a method often employed by institutional participants.
Key Levels to Monitor
The $1.00 level has emerged as a psychological and technical support zone, holding firm despite previous attempts to break lower. On the upside, traders and investors alike should watch for a clean break above the MA20 at $1.045, which could invite further momentum. A decisive move beyond the $1.10–1.15 resistance range, ideally accompanied by a pick-up in volume, would strengthen the bullish outlook and likely confirm fund-backed buying interest.
Conclusion
ATPC is currently at an interesting technical juncture. With selling pressure appearing to ease and signs of quiet accumulation beginning to surface, the stock may be transitioning from a downtrend into a potential recovery phase. Investors looking for early positioning may wish to monitor upcoming volume and price movements closely, particularly as the stock tests its short-term resistance levels.

Dow Jones Industrial Average ($US30): Market Mover or Stumbling?(1/9)
Good afternoon, everyone! ☀️ Dow Jones Industrial Average ( BLACKBULL:US30 ): Market Mover or Stumbling Block?
With the Dow at $42,407.80, is this blue-chip index a steady climber or a shaky step? Let’s chart the course! 🔍
(2/9) – PRICE PERFORMANCE 📊
• Current Price: $ 42,407.80 as of Mar 24, 2025 💰
• Recent Move: Up 0.8% from $41,985.35 on Mar 21, per data 📏
• Sector Trend: Mixed with tech, aerospace gains 🌟
It’s a bumpy climb—let’s see what’s driving it! ⚙️
(3/9) – MARKET POSITION 📈
• Composition: 30 U.S. blue-chip firms, all sectors but transport, utilities 🏆
• Trend: Volatile but up 1.2% weekly as of Mar 21, per data ⏰
• Sentiment: Cautious optimism amid trade tensions 🎯
Firm but tested by macro winds! 📊
(4/9) – KEY DEVELOPMENTS 🔑
• Fed Update: Rates steady, economic uncertainty up, per data 🌍
• Sector Gains: Boeing up 7% on Air Force deal, per data 📋
• Market Reaction: Dow up after tariff reprieve hopes 💡
Navigating a stormy market! 🌪️
(5/9) – RISKS IN FOCUS ⚡
• Trade Tensions: U.S.-China tariffs spark inflation fears 🔍
• Economic Slowdown: Consumer sentiment at 2022 lows 📉
• Policy Shifts: Trump tariffs add uncertainty ❄️
It’s a rocky path—watch the curves! 🛑
(6/9) – SWOT: STRENGTHS 💪
• Blue-Chip Base: 30 industry leaders 🥇
• Sector Gains: Tech, aerospace lift index 📊
• Resilience: Up 12.7% from 52-week low 🔧
Got a sturdy engine under the hood! 🏦
(7/9) – SWOT: WEAKNESSES & OPPORTUNITIES ⚖️
• Weaknesses: Volatility, 5.9% off peak 📉
• Opportunities: Rate cut hopes, tech rebound 📈
Can it climb higher or stall out? 🤔
(8/9) – POLL TIME! 📢
Dow at $42,407.80—your take? 🗳️
• Bullish: $44,000+ soon, rally resumes 🐂
• Neutral: Steady, risks balance out ⚖️
• Bearish: $40,000 looms, correction deepens 🐻
Chime in below! 👇
(9/9) – FINAL TAKEAWAY 🎯
Dow’s $42,407.80 price shows cautious gains 📈, but volatility’s in the air 🌿. Dips are our DCA fuel 💰—buy low, ride high! Gem or bust?

Wingstop Inc. (WING) 1WTechnical Analysis 1W
The chart shows a breakout of the weekly uptrend line, signaling potential further downside.
Key Levels:
-Support: 206.49 USD (0.382 Fib), 152.93 USD (0.236 Fib), 66.36 USD (0 Fib)
- Resistance: 249.78 USD (0.5 Fib), 293.07 USD (0.618 Fib), 354.70 USD (0.786 Fib)
Indicators suggest weakness.
Fundamental Analysis:
Wingstop specializes in chicken wings.
Key Factors:
- Financials: Revenue growth, but high valuation increases correction risk
- Macroeconomics: Interest rates impact consumer spending
- Competition: Pressure from McDonald's and KFC
Conclusion: A break below 152.93 USD could lead to 66.36 USD. Bulls need a recovery above 249.78 USD for trend reversal.

4081 Naifat Finance (TADAWUL)📊 Trade Idea Overview – Weekly Timeframe
✅ Key Technical Levels:
Demand Zone: Clearly marked between 12.00 – 13.00, showing strong historical buyer interest.
Current Price: 13.38
Fibonacci Retracement Levels: Price is reacting near the 0.705 - 0.79 zone, which often acts as a bullish reversal area.
Target Price: 18.40 — Identified as Buy-Side Liquidity Zone (BSL) and a previous significant high.
Resistance Zone: Around 18.40, where liquidity is likely to get captured by smart money.
📌 Narrative & Market Context:
Price has shown a bullish reaction from the Demand Zone, indicating accumulation or potential bottom formation.
Fibonacci confluence with demand strengthens the bullish setup.
Once price breaks above 14.00, a bullish market structure shift will be confirmed.
The chart also visualizes a projected path toward 18.40, indicating a strong bullish impulse wave ahead.
📈 Expected Price Path (as shown in chart):
Minor pullback toward 13.00 area (retest demand / Fibonacci zone).
Breakout above 14.00 – a key structural shift.
Bullish continuation toward 18.40 Buy-Side Liquidity.
📍 Trading Plan Suggestion:
Entry Zone: Between 13.00 – 13.20 (ideal demand re-entry).
Stop Loss: Below 12.00 (invalidate demand structure).
Take Profit: 18.40
Risk-Reward Ratio: Excellent (Potentially 1:3+ R:R)

Quick Technical Take on Agape ATP Corporation (ATPC)Let’s break down the 1-hour chart for Agape ATP Corporation (ATPC) as of March 20, 2025. The stock’s sitting at $1.02, down about 1%, and it’s been a wild ride lately.
The price spiked to $3.00 in late January before crashing hard. Since then, it’s been hanging around the $1.00 mark, which has been a solid support; buyers keep stepping in here, like clockwork, especially in early March.
The Bollinger Bands show the price dipping below the lower band in mid-February, hinting at an oversold bounce, and now it’s consolidating near that $1.00 level. We’ve got a recent "Sell" signal at $1.06, so there’s some short-term bearish pressure.
The SmartMCDX indicator below the chart is flashing mixed signals: green for bullish, red for bearish. Lately, it’s leaning red, suggesting the bears might have the upper hand for now. Volume’s pretty quiet, which means no big players are jumping in yet, so we might just keep drifting near $1.00.
What to Watch : If the price holds above $1.00, we could see a push toward $1.06 or even $1.20. But if it breaks below $1.00, things could get ugly, maybe dropping to $0.90. For now, I’d sit tight and see which way the wind blows; $1.00 is the key.

$NKE: Nike – Sprinting to Gains or Stumbling?(1/9)
Good evening, everyone! 🌙 NYSE:NKE : Nike – Sprinting to Gains or Stumbling?
With NKE at $73 ahead of Q3 earnings, is this sportswear giant ready to run or tripping up? Let’s lace up and find out! 🔍
(2/9) – PRICE PERFORMANCE 📊
• Current Price: $ 73 as of Mar 19, 2025 💰
• Recent Move: Down from $102.49 high, above $68.63 low, per data 📏
• Sector Trend: Footwear sector volatile with trade tensions 🌟
It’s a rocky track—value might be in stride! ⚙️
(3/9) – MARKET POSITION 📈
• Market Cap: Approx $116B (web ID: 15) 🏆
• Operations: Global leader in footwear, apparel ⏰
• Trend: Strong brand, innovation focus, per data 🎯
Firm in sportswear, but facing headwinds! 🏃♂️
(4/9) – KEY DEVELOPMENTS 🔑
• Q3 FY2025 Earnings: Due Mar 20, $11.02B revenue expected, per data 🌍
• Market Sentiment: Bearish short-term, per posts on X 📋
• Price Action: Down 9.78% in 10 days, per data 💡
Racing toward earnings with caution! 🏁
(5/9) – RISKS IN FOCUS ⚡
• Trade Tensions: U.S.-China tariffs hit margins, per data 🔍
• Economic Slowdown: Consumer spending at risk 📉
• Competition: Adidas, Skims gaining ground ❄️
It’s a tough race—watch the pace! 🛑
(6/9) – SWOT: STRENGTHS 💪
• Brand Power: Global sportswear leader 🥇
• Innovation: NikeSKIMS, new products, per data 📊
• Dividend: 2.03% yield draws income fans 🔧
Got the gear to win! 🏀
(7/9) – SWOT: WEAKNESSES & OPPORTUNITIES ⚖️
• Weaknesses: Bearish sentiment, volatility 📉
• Opportunities: Q3 earnings beat, tech rebound 📈
Can it jump the hurdles or stumble? 🤔
(8/9) – POLL TIME! 📢
NKE at $73 your take? 🗳️
• Bullish: $85+ soon, earnings spark 🐂
• Neutral: Steady, risks balance out ⚖️
• Bearish: $65 looms, market slips 🐻
Chime in below! 👇
(9/9) – FINAL TAKEAWAY 🎯
NKE’s $73 price tags a volatile sportswear play 📈, but brand strength keeps it in the race 🌿. Dips are our DCA sweet spot 💰—buy low, run high! Gem or bust?

$BAJAJAUTO: Bajaj Auto – Wheeling to Wealth or Spinning Out?(1/9)
Good afternoon, everyone! ☀️ $BAJAJAUTO: Bajaj Auto – Wheeling to Wealth or Spinning Out?
With BAJAJAUTO at ₹7,711.25 post-CEO nod and ₹1,500 crore boost, is this two-wheeler titan revving up or stalling? Let’s ride into it! 🔍
(2/9) – PRICE PERFORMANCE 📊
• Current Price: $ 7,711.25 as of Mar 19, 2025 💰
• Recent Move: Up 1.64% on news, below $12,774 high, per data 📏
• Sector Trend: Auto sector steady, with two-wheeler demand in focus 🌟
It’s a smooth ride—value might be in gear! ⚙️
(3/9) – MARKET POSITION 📈
• Market Cap: Approx ₹2.12 lakh crore (web ID: 6) 🏆
• Operations: Two-wheelers, financing via subsidiary ⏰
• Trend: Leadership stability, credit growth, per data 🎯
Firm in its lane, with expansion in sight! 🚴♂️
(4/9) – KEY DEVELOPMENTS 🔑
• CEO Re-appointment: Rajiv Bajaj for 5 yrs from Apr 1, per data 🌍
• Investment: ₹1,500 crore into Bajaj Auto Credit Ltd., per data 📋
• Market Reaction: Stock up, signaling confidence 💡
Revving up leadership and capital! 🛵
(5/9) – RISKS IN FOCUS ⚡
• Market Volatility: Trade tensions, economic shifts 🔍
• Competition: Hero MotoCorp, TVS pressure sales 📉
• Rates: Rising costs could hit demand ❄️
It’s a twisty road—watch the turns! 🛑
(6/9) – SWOT: STRENGTHS 💪
• Brand Power: Two-wheeler leader in India 🥇
• Subsidiary Growth: Credit arm expansion, per data 📊
• Dividend: Steady payouts attract income fans 🔧
Got horsepower to spare! 🏍️
(7/9) – SWOT: WEAKNESSES & OPPORTUNITIES ⚖️
• Weaknesses: Below peak, macro risks 📉
• Opportunities: Two-wheeler demand, financing growth 📈
Can it accelerate or hit a bump? 🤔
(8/9) – POLL TIME! 📢
BAJAJAUTO at ₹7,711.25—your take? 🗳️
• Bullish: ₹9,000+ soon, growth kicks in 🐂
• Neutral: Steady, risks balance out ⚖️
• Bearish: ₹7,000 looms, market stalls 🐻
Chime in below! 👇
(9/9) – FINAL TAKEAWAY 🎯
BAJAJAUTO’s ₹7,711.25 price reflects confidence 📈, but volatility’s in the air 🌿. Dips are our DCA fuel 💰—buy low, ride high! Gem or bust?

$FMC: FMC Corporation – Crop Cash or Weed Woes?(1/9)
Good morning, everyone! ☀️ NYSE:FMC : FMC Corporation – Crop Cash or Weed Woes?
With FMC at $42.96, is this agro giant sprouting profits or wilting away? Let’s dig into the dirt! 🔍
(2/9) – PRICE PERFORMANCE 📊
• Current Price: $ 42.96 as of Mar 18, 2025 💰
• Recent Move: Up 14.5% from $37.52 on Mar 3, per data 📏
• Sector Trend: Agri sector volatile with commodity swings 🌟
It’s a wild harvest—value might be budding! ⚙️
(3/9) – MARKET POSITION 📈
• Market Cap: Approx $5.36B (124.84M shares) 🏆
• Operations: Crop protection in N. America, LatAm, Asia ⏰
• Trend: Q4 2024 earnings beat, per data 🎯
Firm in agro sciences, weathering the storm! 🚜
(4/9) – KEY DEVELOPMENTS 🔑
• Q4 2024 Earnings: EPS $1.79 beat $1.60 estimate, per data 🌍
• Revenue: Steady despite agri volatility, per reports 📋
• Market Reaction: Price reflects cautious optimism 💡
Growing roots in a tough field! 🌱
(5/9) – RISKS IN FOCUS ⚡
• Commodity Prices: Grain price drops hit demand 🔍
• Economic Slowdown: Reduced grower budgets, per data 📉
• Regulation: Pesticide rules tighten globally ❄️
It’s a risky plot—watch the yield! 🛑
(6/9) – SWOT: STRENGTHS 💪
• Product Portfolio: Insecticides, herbicides, fungicides 🥇
• Global Reach: Ops across continents, per data 📊
• Dividend: ~5% yield draws income seekers 🔧
Got fertile ground to grow! 🏦
(7/9) – SWOT: WEAKNESSES & OPPORTUNITIES ⚖️
• Weaknesses: Volatility, regulatory pressures 📉
• Opportunities: Agri demand rebound, new products 📈
Can it bloom or just mulch? 🤔
(8/9) – POLL TIME! 📢
FMC at $42.96—your take? 🗳️
• Bullish: $50+ soon, agro recovery 🐂
• Neutral: Steady, risks balance out ⚖️
• Bearish: $35 looms, sector woes 🐻
Chime in below! 👇
(9/9) – FINAL TAKEAWAY 🎯
FMC’s $42.96 price hints at value 📈, but agro risks loom 🌿. Dips are our DCA harvest 💰—buy low, ride high! Gem or bust?

XAU/USD: Gold – Glittering Gains or Gilded Trap?(1/9)
Good evening, everyone! 🌙 XAU/USD: Gold – Glittering Gains or Gilded Trap?
With gold at $2,984.40, is this safe-haven star shining bright or setting up for a fall? Let’s mine the truth! 🔍
(2/9) – PRICE PERFORMANCE 📊
• Current Price: $ 2,984.40 per ounce as of Mar 14, 2025 💰
• Recent Move: Near $3,000, up from recent trends, per data 📏
• Sector Trend: Precious metals hot with trade tensions, rate cut bets 🌟
It’s a shiny ride—let’s see what’s fueling it! ⚙️
(3/9) – MARKET POSITION 📈
• Global Role: Safe-haven asset, industrial use in electronics ⏰
• Supply Dynamics: Central bank buying, mining output steady 🎯
• Trend: Geopolitical risks pushing demand, per posts on X 🚀
Firm as a rock in uncertain times! 🏦
(4/9) – KEY DEVELOPMENTS 🔑
• Trade Tensions: U.S.-China tariff threats boosting safe-haven appeal 🌍
• Rate Cuts: Fed easing bets supporting prices, per data 📋
• Market Reaction: Near record highs, showing strength 💡
Riding waves of global chaos! 🌊
(5/9) – RISKS IN FOCUS ⚡
• Economic Recovery: Could dampen safe-haven demand 🔍
• Market Sentiment: Sudden risk-on shifts might trigger a sell-off 📉
• Supply Boost: Increased mining could cap gains ❄️
It’s a glittering gamble—watch out! 🛑
(6/9) – SWOT: STRENGTHS 💪
• Safe-Haven Demand: Gold thrives in uncertainty 🥇
• Central Bank Buying: Steady support from global reserves 📊
• Green Energy: Use in renewables adds industrial demand 🔧
Got a golden edge in tough times! 🌟
(7/9) – SWOT: WEAKNESSES & OPPORTUNITIES ⚖️
• Weaknesses: High prices risk a correction if tensions ease 📉
• Opportunities: Escalating trade wars, infrastructure spending 📈
Can it break $3,000 and hold? 🤔
(8/9) – POLL TIME! 📢
Gold at $2,984.40—your take? 🗳️
• Bullish: $3,100+ soon, safe-haven rally continues 🐂
• Neutral: Steady near $3,000, risks balance out ⚖️
• Bearish: $2,800 looms, correction ahead 🐻
Chime in below! 👇
(9/9) – FINAL TAKEAWAY 🎯
Gold’s $2,984.40 price reflects safe-haven strength 📈, but it’s not cheap—volatility’s our ally. DCA-on-dips could catch a dip below $3,000 for a long-term win. Gem or bust?

$ADSK: AutodesK – Designing Profits or Sketching Losses?(1/9)
Good afternoon, everyone! ☀️ NASDAQ:ADSK : AutodesK – Designing Profits or Sketching Losses?
With ADSK at $245 post-Q4 beat and robust guidance, is this design titan a blueprint for profit or a rough draft? Let’s ink out the details! 🔍
(2/9) – PRICE PERFORMANCE 📊
• Current Price: $ 245 as of Mar 13, 2025 💰
• Recent Move: Up after Q4 FY2024 earnings beat, per data 📏
• Sector Trend: Tech sector buoyant, with AI and cloud driving growth 🌟
It’s a tech favorite—let’s see if it’s worth the hype! ⚙️
(3/9) – MARKET POSITION 📈
• Market Cap: Approx $50B (assuming shares outstanding) 🏆
• Operations: Design software for architecture, engineering, manufacturing ⏰
• Trend: Cloud and AI integration boosting future growth, per reports 🎯
Firm in its niche, with digital transformation as tailwind! 🚀
(4/9) – KEY DEVELOPMENTS 🔑
• Q4 FY2024 Earnings: Billings and revenue beat, per data 🌍
• FY2026 Guidance: Revenue growth 8-9%, FCF $2.075B-$2.175B 📋
• Market Reaction: Stock price up post-earnings, indicating confidence 💡
Adapting to new tech trends, looking ahead! 💪
(5/9) – RISKS IN FOCUS ⚡
• Economic Slowdown: Reduced software spending in tough times 🔍
• Tariff Threats: March 10-12, 2025, impacting new business, per data 📉
• Competition: Adobe, Siemens, others in design software market ❄️
It’s a competitive landscape—risks are real! 🛑
(6/9) – SWOT: STRENGTHS 💪
• Market Leader: Dominant in design software, strong brand 🥇
• Subscription Model: Recurring revenue from cloud-based services 📊
• AI Integration: Leveraging AI for enhanced products, per recent announcements 🔧
Got solid foundations and futuristic vision! 🏦
(7/9) – SWOT: WEAKNESSES & OPPORTUNITIES ⚖️
• Weaknesses: High valuation (P/E around 39), macro headwinds 📉
• Opportunities: Expanding into manufacturing, healthcare, per strategy 📈
Can it justify its price and expand further? 🤔
(8/9) – POLL TIME! 📢
ADSK at $245—your take? 🗳️
• Bullish: $260+ soon, growth story continues 🐂
• Neutral: Steady, risks and opportunities balance out ⚖️
• Bearish: $220 looms, overvalued in current market 🐻
Chime in below! 👇
(9/9) – FINAL TAKEAWAY 🎯
ADSK’s $245 price reflects strong performance and guidance 📈, but with a high P/E ratio, it’s not for the faint-hearted. Dips could be golden opportunities for DCA investors. Gem or bust?

Copper (HG): Red Metal Rally or Rusty Bet?(1/9)
Good afternoon, everyone! ☀️ Copper (HG): Red Metal Rally or Rusty Bet?
With copper at $4.88 per pound, is this industrial darling a steal or a trap? Let’s dig into the dirt! 🔍
(2/9) – PRICE PERFORMANCE 📊
• Current Price: $ 4.88 per pound as of Mar 13, 2025 💰
• Recent Move: Up slightly this week (Mar 10-13), per data 📏
• Sector Trend: Industrial metals volatile, with tariff impacts 🌟
It’s a mixed bag—let’s see what’s driving the price! ⚙️
(3/9) – MARKET POSITION 📈
• Global Demand: Key in construction, electronics, renewable energy ⏰
• Supply Dynamics: Major producers in Chile, Peru, China; tariff risks loom 🎯
• Trend: Green energy demand up, but economic slowdowns could dampen growth 🚀
Firm in its industrial roots, but facing new challenges! 🏭
(4/9) – KEY DEVELOPMENTS 🔑
• Trade War Escalation: U.S.-China tensions on Mar 13, 2025, per data, could hit supply chains 🌍
• China’s Response: Uncertain, but likely to affect prices due to its role in copper 📋
• Market Reaction: Prices volatile but up slightly, indicating cautious optimism 💡
Navigating through geopolitical storms! 🛳️
(5/9) – RISKS IN FOCUS ⚡
• Economic Slowdown: Reduced industrial activity could lower demand 🔍
• Supply Disruptions: Tariffs or geopolitical issues could disrupt supply, per data 📉
• Substitution: Other materials or technologies could reduce copper’s importance ❄️
It’s a risky ride, but potential rewards are there! 🛑
(6/9) – SWOT: STRENGTHS 💪
• Increasing Demand from Green Energy: Solar panels, wind turbines, EVs require copper 🥇
• Industrial Staple: Essential in construction and electronics, ensuring steady demand 📊
• Price History: Historically, copper has been a good long-term investment, especially during expansions 🔧
Got solid fundamentals! 🏦
(7/9) – SWOT: WEAKNESSES & OPPORTUNITIES ⚖️
• Weaknesses: Price volatility due to economic cycles and supply disruptions 📉
• Opportunities: Expansion in emerging markets, new applications in tech and infrastructure 📈
Can copper shine through the challenges? 🤔
(8/9) – 📢Copper at $4.88 per pound—your take? 🗳️
• Bullish: $5+ soon, green energy boom drives prices up 🐂
• Neutral: Steady, risks and opportunities balance out ⚖️
• Bearish: $4 looms, economic slowdown hits demand 🐻
Chime in below! 👇
(9/9) – FINAL TAKEAWAY 🎯
Copper’s $4.88 price reflects a mix of optimism and caution 📈. With green energy demand rising but economic and geopolitical risks lingering, it’s a volatile market. DCA-on-dips could be a strategy to average in over time, banking on long-term growth. Gem or bust?

$HRTG: Heritage Insurance – Catastrophe or Opportunity?(1/9)
Good morning, everyone! ☀️ NYSE:HRTG : Heritage Insurance – Catastrophe or Opportunity?
With HRTG at $11.50, is this insurer a risky bet or a hidden gem in the catastrophe-prone market? Let’s dive into the details! 🔍
(2/9) – PRICE PERFORMANCE 📊
• Current Price: $ 11.50 as of Mar 12, 2025 💰
• Recent Move: Slipped 4% post-Q4 earnings, but stabilized 📏
• Sector Trend: Insurance sector steady, with P&C insurers facing claims volatility 🌟
It’s a volatile ride, but potential value lurks! ⚙️
(3/9) – MARKET POSITION 📈
• Market Cap: Approx $200M (assuming 17.39M shares) 🏆
• Operations: Property and casualty insurance in high-risk areas ⏰
• Trend: Niche focus on catastrophe-prone regions like Florida, potential for growth 🎯
Firm in its niche, but risks are high! 🚀
(4/9) – KEY DEVELOPMENTS 🔑
• Q4 2024 Earnings: Net income $0.66 per share, down from $1.15 YoY 🔄
• Revenue: Slightly missed estimates, per reports 🌍
• Market Reaction: Stock slipped 4%, but stabilized post-earnings 📋
Adapting to challenges, looking ahead! 💡
(5/9) – RISKS IN FOCUS ⚡
• Natural Disasters: High exposure to claims from hurricanes, floods, etc. 🔍
• Regulatory Changes: Potential impacts from state regulations in Florida and other areas 📉
• Competition: Increasing competition in high-risk insurance markets ❄️
Tough, but risks are part of the game! 🛑
(6/9) – SWOT: STRENGTHS 💪
• Niche Market: Focus on high-risk areas with potentially higher premiums 🥇
• Established Presence: Strong foothold in Florida and other states 📊
• Growth Potential: Increasing demand due to climate change and urbanization 🔧
Got potential in a challenging market! 🏦
(7/9) – SWOT: WEAKNESSES & OPPORTUNITIES ⚖️
• Weaknesses: Earnings volatility from natural disasters, regulatory risks 📉
• Opportunities: Expansion into new high-risk areas, technological advancements for better risk management 📈
Can it weather the storms and shine? 🤔
(8/9) –📢HRTG at $11.50, with undervaluation signs—your take? 🗳️
• Bullish: $15+ soon, undervalued gem 🐂
• Neutral: Steady, risks balance growth ⚖️
• Bearish: $10 looms, catastrophe ahead 🐻
Chime in below! 👇
(9/9) – FINAL TAKEAWAY 🎯
HRTG’s $11.50 price tags potential value 📈, but catastrophe risks add caution 🌿. Volatility’s our friend—dips are DCA gold 💰. Grab ‘em low, climb like pros! Gem or bust?

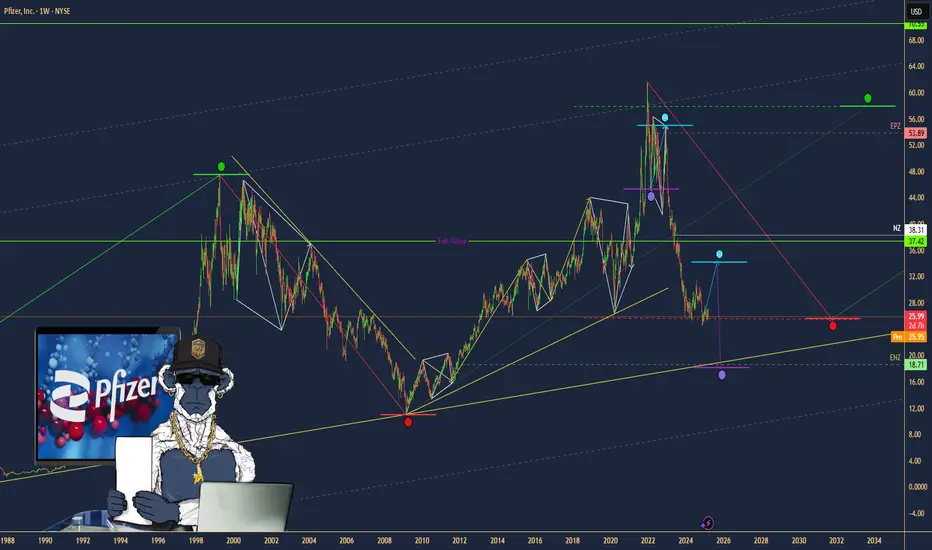
Pfizer ($PFE): Undervalued Pharma Giant with Growth Potential?(1/9)
Good afternoon, everyone! 😊
Pfizer ( NYSE:PFE ): Undervalued Pharma Giant with Growth Potential?
With PFE at $25.90, is this the time to buy into this pharmaceutical powerhouse? Let’s dive in! 😎
(2/9) – PRICE PERFORMANCE
• Current Price: $25.90 as of March 12, 2025 😏
• Recent Moves: Trading within a range of $24 to $28, currently near the middle 😬
• Sector Vibe: Pharma sector remains stable, with new drug approvals driving growth 📈
Short commentary: The stock seems to be consolidating. Is this a good entry point? 🤔
(3/9) – MARKET POSITION
• Market Cap: Approximately $147.2 billion (assuming 5.67 billion shares outstanding) 💰
• Operations: Global pharmaceutical company with a diverse product portfolio 🛡️
• Trend: Strong Q4 2024 earnings and reaffirmed 2025 guidance 🚀
Short commentary: Pfizer’s fundamentals are solid, with consistent revenue and earnings projections. 😉
(4/9) – KEY DEVELOPMENTS
• Reaffirmed 2025 revenue guidance of $61-64 billion and EPS of $2.80-3.00 📈
• Continued focus on new drug developments and expanding into emerging markets 🌐
• Achieved cost savings goals and ongoing optimization programs for improved margins 💡
Short commentary: The company is managing its costs effectively and looking to future growth. Let’s watch closely. 👀
(5/9) – RISKS IN FOCUS
• Legal challenges related to past products ⚙️
• Competition from generic manufacturers and patent expirations 📉
• Economic conditions affecting healthcare spending ⚠️
Short commentary: These risks are known, but Pfizer’s diverse portfolio should help mitigate them. Stay vigilant! 🕵️
(6/9) – SWOT: STRENGTHS
• Diverse product portfolio across multiple therapeutic areas 🏆
• Strong R&D capabilities and pipeline of new drugs 🌈
• Global presence and distribution network 🌟
Short commentary: Pfizer’s strengths position it well for long-term growth. Keep up the good work! 👍
(7/9) – SWOT: WEAKNESSES & OPPORTUNITIES
• Weaknesses: Dependence on key products, legal issues ⚠️
• Opportunities: New drug approvals, expanding into emerging markets 🌐
Short commentary: Opportunities abound, but weaknesses need to be monitored. Let’s hope they nail it! 📈
(8/9) – PFE at $25.90 – what’s your call? 🗳️
• Bullish: Price could rise to $30+ if it breaks above $28 🚀
• Neutral: Price remains between $24 and $28 😐
• Bearish: Price could drop to $22 if it breaks below $24 📉
Drop your pick below! 💬
(9/9) – FINAL TAKEAWAY
Pfizer’s $25.90 stance shows a company with solid fundamentals and a fair valuation at a P/E of approximately 8.93. With a strong pipeline and cost management, it’s an attractive option for value investors. Keep an eye on resistance at $28 for potential upside movement. Snag low, hold long!
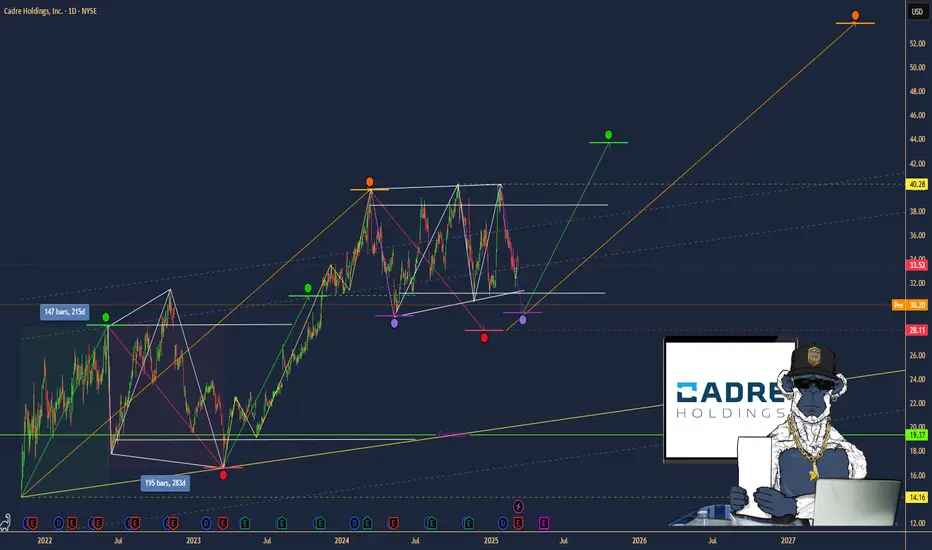
$CDRE: Cadre Holdings – Riding the Safety Wave?(1/9)
Good afternoon, everyone! 😊
NYSE:CDRE : Cadre Holdings – Riding the Safety Wave?
With CDRE at $30.20, is this stock a safe bet or a risky ride? Let's dive into the world of safety gear and see if Cadre's holdings hold up! 😎
(2/9) – PRICE PERFORMANCE
• Current Price: $30.20 as of March 12, 2025 😏
• Recent Moves: Down 11% from $34.02 a week ago 😬
• Sector Vibe: Safety equipment sector is growing, driven by stricter regulations and demand for safer workplaces. 📈
Short commentary: The stock's taken a hit, but the sector's looking good. Maybe it's just a temporary dip? 🤔
(3/9) – MARKET POSITION
• Market Cap: Approximately $1.23 billion 💰
• Operations: Manufacturing and distributing safety and survivability products for law enforcement, first responders, military, and now, the nuclear market. 🛡️
• Trend: Expanding into new markets with the acquisition of nuclear safety brands. 🚀
Short commentary: They're diversifying, which is usually a good sign. More markets mean more opportunities. 😉
(4/9) – KEY DEVELOPMENTS
• Acquisition of Carr's Engineering Limited's Engineering Division for nuclear safety solutions, announced on January 16, 2025. 📈
• Expected to close in the first half of 2025. ⌛
• Market Reaction: The stock has seen a recent dip, possibly reflecting integration concerns or broader market volatility. 😐
Short commentary: This should bring in new revenue streams and expand their international presence. Let's see how it plays out. 🌍
(5/9) – RISKS IN FOCUS
• Integration risks from the acquisition. ⚙️
• Supply chain disruptions. 🚚
• Regulatory changes in the nuclear sector. 📜
Short commentary: These are all things to keep an eye on, but every company has some risks. Stay vigilant! 🕵️
(6/9) – SWOT: STRENGTHS
• Strong reputation in safety equipment. 🏆
• Diverse product portfolio. 🌈
• Recent acquisition expanding into the nuclear market. 🌟
Short commentary: They're well-known and have a broad range of products, which is great. Keep up the good work! 👍
(7/9) – SWOT: WEAKNESSES & OPPORTUNITIES
• Weaknesses: Potential over-reliance on government contracts, integration challenges. ⚠️
• Opportunities: Growth in nuclear safety market, increasing global demand for safety products. 🌐
Short commentary: They need to manage their dependencies and make sure the acquisition goes smoothly, but there's a lot of potential for growth. Let's hope they nail it! 📈
(8/9) – CDRE at $30.20 – what's your call? 🗳️
• Bullish: Price could rise to $35+ soon, due to successful acquisition and sector growth. 🚀
• Neutral: Price remains steady, as the market digests the acquisition news. 😐
• Bearish: Price could drop to $25, due to integration risks and market volatility. 📉
Drop your pick below! 💬
(9/9) – FINAL TAKEAWAY
Cadre Holdings' $30.20 stance shows a robust portfolio and strategic expansion, but recent price dips and integration risks are concerns. Volatility’s our ally—dips are DCA treasure. Snag low, soar high!
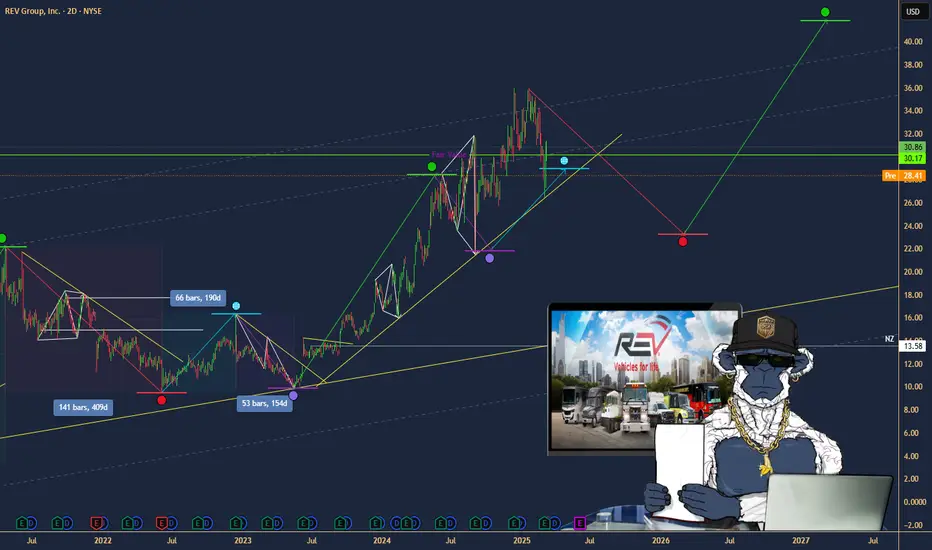
$REVG: REV Group – Riding the Specialty Vehicle Wave?(1/9)
Good morning, everyone! 😄
NYSE:REVG : REV Group – Riding the Specialty Vehicle Wave?
With NYSE:REVG at $31.00, is this stock revving up for growth or hitting a speed bump? Let’s dive into the details! 😎
(2/9) – PRICE PERFORMANCE 📊
• Current Price: $32.00 as of 12-03-2025 😊
• Recent Moves: Up from last month, showing steady growth. 📈
• Sector Vibe: Specialty vehicles sector is stable, with consistent demand from public services and commercial clients. 🚒🚜
Short commentary: REVG’s price is on an upward trajectory, reflecting positive market sentiment. Let’s see what’s driving this! 🚀
(3/9) – MARKET POSITION 📈
• Market Cap: Approximately $1.75B (based on 52.13M shares * $32.00) 💰
• Operations: Designs, manufactures, and distributes specialty vehicles like fire trucks, ambulances, and recreational vehicles. 🚓🏎️
• Trend: Increasing focus on customization and technology integration in vehicles. ⚙️
Short commentary: REVG is a key player in the niche market of specialty vehicles, with a diverse portfolio that caters to various sectors. Their market position seems solid. 🌟
(4/9) – KEY DEVELOPMENTS 🔑
• Exited bus manufacturing business by selling ElDorado National, focusing on core segments. 🚐
• Provided fiscal 2025 guidance, showing confidence in future performance. 📈
• Increased quarterly dividend by 20%, signaling strong cash flow and shareholder value focus. 💸
Market Reaction: Positive, with stock price reflecting these developments. Investors are optimistic about the company’s strategic moves. 😃
Short commentary: These developments suggest that REVG is streamlining its operations and focusing on more profitable areas, which should benefit shareholders. 👏
(5/9) – RISKS IN FOCUS ⚠️
• Economic slowdown could reduce demand for new vehicles, especially in the commercial sector. 🌦️
• Supply chain disruptions might affect production schedules and costs. 🚚
• Increased competition in the recreational vehicles segment. 🏕️
Short commentary: While there are risks, REVG’s diversified portfolio and focus on essential services might mitigate some of these challenges. It’s important to monitor these factors closely. 🕵️
(6/9) – SWOT: STRENGTHS 💪
• Strong brand portfolio with recognized names in the industry. 🏆
• Diverse customer base across public services and commercial clients. 🌐
• Recent strategic decisions to exit less profitable segments. 🚫
Short commentary: REVG’s strengths lie in its well-established brands and broad customer reach, which provide stability and growth opportunities. 💪
(7/9) – SWOT: WEAKNESSES & OPPORTUNITIES ⚖️
• Weaknesses: Dependence on economic conditions and potential regulatory changes. 📜
• Opportunities: Growth in the fire and emergency segment due to increased public safety spending. 🚒
Short commentary: While there are weaknesses tied to external factors, the opportunities in expanding sectors like fire and emergency services could drive future growth. It’s a balancing act! ⚖️
(8/9) – 📢REV Group at $32.00, with recent positive developments—your call?
• Bullish: $40+ soon, due to strategic focus and increased dividend. 🚀
• Neutral: Steady growth, maintaining current trends. 🛴
• Bearish: $25 drop, if economic conditions worsen. ⬇️
Drop your pick below! 😄
(9/9) – FINAL TAKEAWAY 🎯
REV Group’s $31.00 stance shows resilience and strategic planning, but economic risks linger. Volatility’s our ally—dips are DCA treasure. Snag low, soar high! Will it rev up or slow down?
$CRWD: Crowdstrike – Cybersecurity Titan or Overvalued Hype?(1/9)
Good afternoon, investors! ☀️ NASDAQ:CRWD : Crowdstrike – Cybersecurity Titan or Overvalued Hype?
With NASDAQ:CRWD at $322, is this cyber guardian still leading the pack or is it time to cash in? Let's dive into the digital trenches! 🔍
(2/9) – PRICE PERFORMANCE 📊
• Current Price: $ 322 as of Mar 11, 2025 💰
• Recent Moves: Down from $360+ post-Q4, per X posts 📏
• Sector Trend: Cybersecurity demand remains robust, per market insights 🌟
It’s a steady ride with potential for growth! ⚙️
(3/9) – MARKET POSITION 📈
• Market Cap: ~$75B (based on 232.5M shares) 🏆
• Operations: Leader in endpoint security and threat intelligence ⏰
• Trend: Expanding into AI-driven security solutions, per recent developments 🎯
Firm, standing tall in the cyber battlefield! 🚀
(4/9) – KEY DEVELOPMENTS 🔑
• Earnings Win: Q1 FY25 beat estimates, guidance raised, per X posts 🔄
• Cyber Boom: Threats fuel demand, per Mar 6 chatter 🌍
• Market Reaction: Stock jumped, then dipped, per X sentiment 📋
Battling, with innovation driving the narrative! 💡
(5/9) – RISKS IN FOCUS ⚡
• Competition: Intense from Palo Alto Networks, Zscaler, etc. 🔍
• Valuation: High P/E ratio may concern some investors 📉
• Regulatory Shifts: Potential new laws impacting data privacy ❄️
Navigating challenges in a dynamic landscape! 🛑
(6/9) – SWOT: STRENGTHS 💪
• Market Leader: Dominant in endpoint security 🥇
• Innovation: AI and ML-driven solutions keep it ahead 📊
• Financial Health: Strong cash position, no debt 🔧
Built to withstand cyber storms! 🏦
(7/9) – SWOT: WEAKNESSES & OPPORTUNITIES ⚖️
• Weaknesses: High valuation, competitive pressures 📉
• Opportunities: Growing demand for cloud security, new market segments 📈
Can it capitalize on the digital expansion? 🤔
(8/9) –📢Crowdstrike at $322—your investment move? 🗳️
• Bullish: $400+ soon, cyber threats fuel growth 🐂
• Neutral: Holding steady, balancing risks and rewards ⚖️
• Bearish: $280 drop, overvalued in a cooling market 🐻
Cast your vote below! 👇
(9/9) – FINAL TAKEAWAY 🎯
Crowdstrike’s $322 stance shows resilience 📈, but cautious investors eye valuation and competition 🌿. Dips are our DCA playground 💰. Grab ‘em low, ride the wave! Gem or bust?
