FireHoseReel | TAO: Breakout Loading Don’t Be Late This Time🔥 Welcome FireHoseReel !
Let’s break down what’s happening with TAO (Bittensor) right now.
👀 TAO – Price Action Overview
After the recent drop, TAO has formed a strong support at $267.6. From this level, buy volume increased and price started pushing upward toward its resistances. Along the way, TAO managed to break several multi-timeframe resistances, showing that seller pressure has weakened and buyers are stepping in more confidently.
Our long trigger is at $310, and a clean breakout above this level can give us a valid long setup.
📊 Volume Analysis
Following the recent declines, TAO’s volume temporarily dropped. However, during the last sell-off, buy volume noticeably increased, causing a sharp move and breaking the $310 support earlier.
For a proper breakout this time, we need strong buy volume to trigger a short squeeze above the resistance zone.
✔️ Price Behavior Near Resistance
TAO is currently interacting with this resistance for the first touch, which often leads to rejection.
Better long setups typically form after the second touch and onward, when buyers show stronger control and volume convergence improves.
🔗 TAO/BTC Pair Perspective Looking at the TAO/BTC pair, price is approaching a key resistance zone sitting at the top of its previous trading range.
A breakout above this level can create a high-momentum move, especially if Bitcoin dominance rises.
This alignment increases the probability of continuation on the TAO/USDT pair as well.
✍️ Long Scenario
A long setup becomes valid if the following conditions align:
• Breakout above $310
• Increase in Bitcoin dominance (BTC.D)
• Decrease in USDT dominance (USDT.D)
• Strong buy volume and clean multi-timeframe volume convergence
• Ideally entering after the second touch into resistance
If these conditions are met, the long scenario becomes much stronger and more reliable.
🛞 Risk Management & Disclaimer
Please remember to always use proper risk management and position sizing. Nothing in this analysis is financial advice. The market can change quickly, so always trade based on your own strategy, research, and risk tolerance. You are fully responsible for your own trades.
Firehosereel

FireHoseReel | Engulfing Candlestick Pattern (Crypto Version)🔥 Welcome FireHoseReel !
Let’s dive into the Engulfing Candlestick Pattern.
✔️ Bearish Engulfing – Basics
The Bearish Engulfing is a two-candlestick reversal pattern.
The first candle is bullish, and the second is a larger bearish candle that fully engulfs the first candle’s body and closes below its low.
Since crypto rarely has gaps, the key condition is that the second body completely covers the first body.
Shadows are not significant.
This pattern is most reliable after a weakening uptrend.
🎯 Bearish Engulfing – Psychology
This pattern shows a strong bearish shift.
Buyers push price upward at first, but the second candle proves sellers have taken full control, dragging price down and even breaking the previous candle’s low.
It signals momentum shifting from bulls to bears.
🧮 Bearish Engulfing – Setup & Levels
• Trigger: Break below the low of the second candle.
• Confirmation: A close below the trigger.
• Stoploss: Above the high of the second candle or whole structure.
• Buy-stop entry: Only if the main trend remains strongly bullish (rare in crypto).
✔️ Bullish Engulfing – Basics
The Bullish Engulfing is a two-candlestick reversal.
The first candle is bearish, and the second is a larger bullish candle that fully engulfs the first body and closes above its high.
In crypto, the key factor is that the second bullish body fully covers the first bearish body.
It works best after a downtrend or capitulation phase.
🎯 Bullish Engulfing – Psychology
This pattern indicates a strong bullish reversal.
Sellers control the first candle, but buyers return aggressively on the second candle, overpowering them and closing above the previous high.
It signals momentum shifting from bears to bulls.
🧮 Bullish Engulfing – Setup & Levels
• Trigger: Break above the high of the second candle.
• Confirmation: A close above the trigger.
• Stoploss: Below the low of the second candle or structure.
• Sell-stop entry: Only in strong downtrends and rarely recommended.
🛞 Risk Management & Disclaimer
Please remember to always use proper risk management and position sizing. Nothing in this analysis is financial advice. The market can change quickly, so always trade based on your own strategy, research, and risk tolerance. You are fully responsible for your own trades.

FireHoseReel | WLFI: Ready to Explode, Don’t Get Left Behind🔥 Welcome FireHoseReel !
Let’s break down what’s happening with WLFI right now.
👀 WLFI – 4H Technical Breakdown
WLFI has successfully broken its 4H dynamic resistance and has already completed a clean pullback retest.
Price is now pushing into the 4H box top, and a confirmed breakout above this zone will activate our long trigger, giving us a valid entry setup.
📊 Volume Analysis – Key Factor for Breakout
Multi-timeframe volume is increasing as WLFI approaches this resistance.
This time, the breakout attempt is backed by stronger buy volume + a clean curve-line break, unlike previous attempts where price showed volume divergence and failed to break through.
For WLFI, volume is the critical element—without strong volume, this resistance has historically rejected price.
✔️ WLFI/BTC Pair Note
The WLFI/BTC pair isn’t very useful for analysis since it’s only listed on Upbit, and the chart lacks structure and clarity.
Because of that, we rely mainly on the WLFI/USDT pair, which currently shows solid momentum toward a breakout.
✍️ Long Scenario setup becomes valid with:
• Breakout above 0.1602
• Clear volume convergence + increasing buy pressure
• A structure that forms a higher high outside the 4H box
• You can also wait for a break-and-retest (pullback) of this resistance to enter.
This entry is slightly riskier but gives a cleaner confirmation if the pullback candle forms an indecision/rejection setup.
🛞 Risk Management & Disclaimer
Please remember to always use proper risk management and position sizing. Nothing in this analysis is financial advice. The market can change quickly, so always trade based on your own strategy, research, and risk tolerance. You are fully responsible for your own trades.

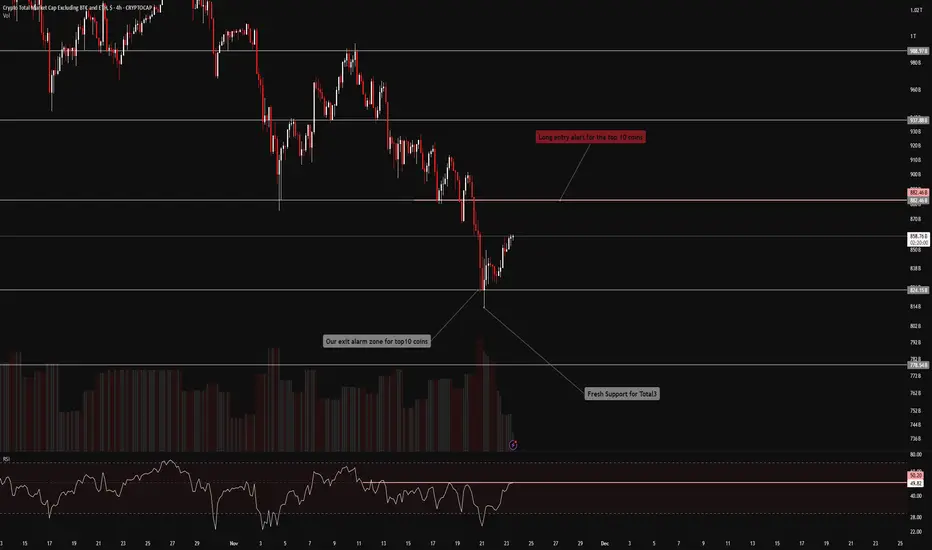
FireHoseReel | Total3: One Breakout Could Flip the Entire Market🔥 Welcome FireHoseReel !
Let’s break down what’s happening with TOTAL3 and see how the altcoin market is shaping up right now.
⭐ TOTAL3 Market Structure Update
The altcoin market (TOTAL3) has formed a solid support base around $824B after the recent pullback and is now pushing upward toward its major resistance at $882B.
A clean breakout above this zone could spark a broader bullish continuation, activate long triggers across top altcoins, and shift the market into a risk-on phase.
📊 RSI Momentum
The RSI is currently battling the 50 level, which has repeatedly acted as strong static resistance.
A confirmed breakout above RSI 50 would strengthen bullish momentum and support upward continuation — most likely during the China open session, where volatility usually increases.
🎯Impact on Top Altcoins
If USDT dominance declines, the top altcoins are likely to gain momentum quickly.
This can accelerate breakouts, create strong bullish impulses, and open up high-probability profit opportunities as liquidity rotates back into alts.
🧭 Trading Perspective
This is the kind of environment where staying close to the charts is essential.
Wait for index confirmations before entering new positions.
A potential altcoin rally could begin from these zones — and with proper risk management, layered entries across multiple altcoins can be highly effective.
🛞 Risk Management & Disclaimer
Please remember to always use proper risk management and position sizing. Nothing in this analysis is financial advice. The market can change quickly, so always trade based on your own strategy, research, and risk tolerance. You are fully responsible for your own trades.
FireHoseReel | USDT.D 4H Analysis🔥 Welcome FireHoseReel !
Let’s jump into the Tether Dominance Analysis , one of the most Popular Crypto Index .
👀 USDT Dominance – 4H Timeframe
USDT dominance has reached a major resistance level after a very strong upward rally. At this point, I personally have a bearish bias, expecting a rejection and the completion of a multi-timeframe secondary trend. This view is also supported by my mentor, Arshia Azizpour.
📉 RSI Analysis
Since volume isn’t very reliable on dominance charts, we use the RSI oscillator instead.
RSI has just rejected from the 81 zone, which is a strong static resistance inside the overbought area.
This rejection suggests potential cooldown, pullback, or loss of momentum.
📌 Key Levels to Watch
USDT dominance currently has three major levels:
🔺 6.623% – major top resistance
🔸 6.427% – multi-timeframe trend-shift zone
🔸 6.148% – secondary multi-timeframe trend-shift zone
A clean break and candle close below these levels can give us a bearish bias on dominance, which naturally creates a bullish bias for crypto assets.
⚠️ Important Note
USDT dominance still has strong trend momentum.
If it breaks above the current top, it could trigger another wave of downward pressure on Bitcoin and altcoins.
Historically, these dominance spikes hit BTC and ETH the hardest, while altcoins don’t always fall as aggressively.
🛞 Risk Management & Disclaimer
Please remember to always use proper risk management and position sizing. Nothing in this analysis is financial advice. The market can change quickly, so always trade based on your own strategy, research, and risk tolerance. You are fully responsible for your own trades.

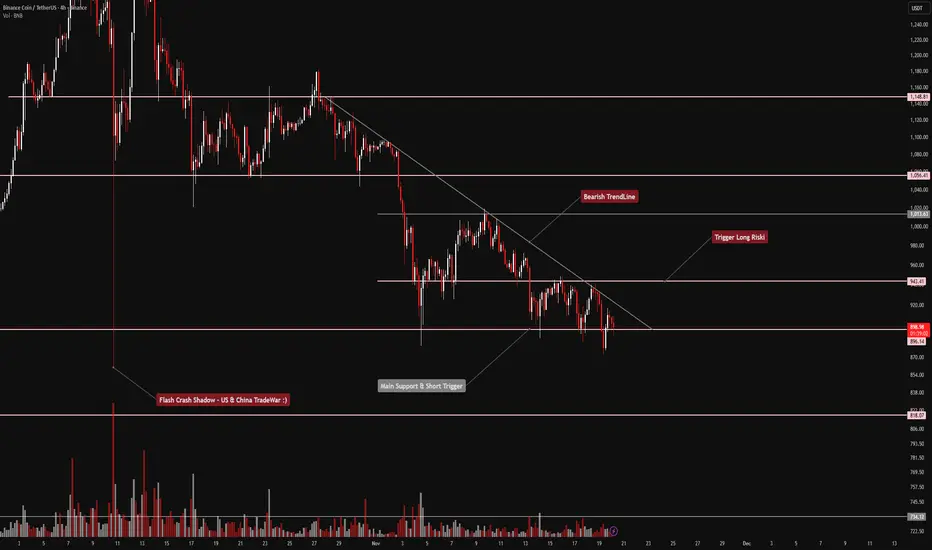
FireHoseReel | BNB Daily Analysis #1😄 Hey! How’s it going? You good?
🍾 Welcome to Fire Hose Reel!
Hit that follow button and enjoy the analysis ahead. And if you ever want a custom chart breakdown, just drop a comment — I got you.
😎 Let’s jump into the analysis of my favorite coin : BNB
👀 BNB on the 4-hour timeframe
After the recent flash crash in the market, BNB entered a corrective phase. A descending trendline (dynamic resistance) has formed, and every time price touches it, we see a retracement.
Right now, BNB is walking right along a major support zone. Losing this area could push price down toward the next support.
This key support sits around $896, and a breakdown below it could intensify the bearish trend, adding momentum to the downside and breaking price out of this triangle-shaped structure.
📊 Volume Indicator
Looking at the volume below the chart, every touch of the trendline has caused sellers to step in, sometimes even breaking strong support levels. When that happens, the volume bars spike upward, signaling increased selling pressure.
At the moment, if sell volume continues rising, BNB could lose the $896 support and move further downward.
✔️ Now let’s analyze something different — BNB/BTC pair
On the 4-hour timeframe, BNB/BTC hit an important resistance level and got heavily rejected, pushing price downward.
Here’s the key point:
BNB’s relative value against BTC is still higher, and just like the USDT pair, it’s sitting on a major support.
If this level breaks, maximum selling pressure could kick in and cause a strong drop.
✍️ Trading Scenarios (Long & Short)
🔼 Long Scenario
• A breakout above the descending trendline
• Confluence with the $943 resistance
• Strong buy volume confirming the breakout
This setup is a bit risky, since higher timeframes are still leaning bearish. Tight stop-loss & quick partial take-profits are recommended.
🔽 Short Scenario
The current level where price is hovering can act as a good support, but if this zone breaks with selling pressure, price could move downward.
That gives us a clean opportunity to open a short trade on the breakdown.
🛞 Risk Management & Disclaimer
Please remember to always use proper risk management and position sizing. Nothing in this analysis is financial advice. The market can change quickly, so make sure you trade based on your own strategy, research, and risk tolerance. You are fully responsible for your trades.
FireHoseReel | $ENA AnalysisWelcome to FireHoseReel!
Weekly Timeframe
BINANCE:ENAUSDT coin is currently at its strong demand zone on the weekly time frame, and it could potentially experience a pump from this area.
Let's check the lower time frames as well to find the best entry point!
Daily Timeframe
On the daily time frame, we have refined the weekly zone.
The price is currently at this zone, and there is significant liquidity to place targets, including liquidity voids and highs.
We also expect the start of the price's substructure phase on the daily time frame and the start of the minor phase on the weekly time frame.
4H Timeframe
On the 4-hour time frame, we are looking for our entry.
We have a demand zone where the price has reversed and turned bullish(CH).This zone also has a lot of liquidity above it, which serves as confirmation for our zone.
This zone will be a good entry point for a long trade.
Our target will be 0.5$ then 0.75$.

FireHoseReel " XVSUSDTWelcome to FireHoseReel ! ❤️
Today we're gonna dive into the XVS coin and break down what the project is all about. Stick with us
This coin has shot up 40% after breaking its upward channel, and then it had a solid climb but pulled back 50% because of profit-taking and heavy selling. It created a key demand zone, and a lot of market makers, retail traders, and exchanges have been buying in the $4.70 to $5.30 range. The next targets for this coin could be $11.50 and $12, and we could see a price increase of up to 90% !
XVSUSDT is the trading pair for the Venus token (XVS) against Tether (USDT). Venus is a decentralized finance (DeFi) protocol built on the Binance Smart Chain (BSC) that allows users to borrow and lend cryptocurrencies.
With Venus, users can supply assets to the platform to earn interest or take out loans using their crypto as collateral. The XVS token serves as the governance token for the Venus protocol, allowing holders to participate in decision-making processes related to the platform’s development and operations.
Hope you guys found these analyses useful! Wishing you all the best 🔥 Don't forget about money management and risk management. Love you all, friends ❤️
