Bearish HTF Bias with Short-Term Bullish Flag CorrectionGold is still trading under a bearish higher-timeframe structure, and the dominant trend remains to the downside. However, after the recent impulsive move, price appears to be forming a bullish flag / corrective structure, suggesting the possibility of one more short-term upward pulse before continuation.
This setup is counter-trend relative to the higher timeframe, therefore confirmation is mandatory. The bullish move is considered only as a corrective rally, not a trend reversal.
Key observations:
Higher Timeframe (HTF) structure remains bearish
Current price action shows a flag-type correction
Potential for a final bullish push into nearby resistance zones
Strong resistance areas are marked above, where selling pressure is expected to reappear
Main demand zone lies around 4400 – 4410, acting as a key invalidation area
Trading approach:
Prefer confirmation-based long entries only within the corrective structure
Be cautious with aggressive buys due to bearish HTF context
Primary focus remains on short opportunities at higher resistance levels after the correction completes
This idea is context-driven, not a blind signal. Directional alignment with higher timeframes remains critical.
Key Levels
Demand / Support: 4400 – 4410
Resistance 1: 4484 – 4495
Resistance 2: 4525 – 4550
Major HTF Resistance: 4605+
Invalidation
A strong breakdown and acceptance below the demand zone (4400) invalidates the bullish correction scenario and favors direct continuation to the downside.
FLAG

$RKLB – High Tight Flag as Space Sector Heats UpNASDAQ:RKLB – High Tight Flag After ATH Breakout | Space Trade Is Just Getting Started
The SpaceX IPO is going to pour gasoline on this entire sector — and NASDAQ:RKLB is already positioned perfectly for it. This stock has been on an absolute heater, and now it’s setting up a high tight flag right after breaking out to all-time highs.
🔹 The Setup:
Clean ATH breakout, followed by tight, orderly consolidation.
Price is respecting the EMAs, with volatility contracting — textbook high tight flag behavior.
This is exactly how leaders reload before the next leg higher.
🔹 Sector Momentum (Very Important):
Space stocks are going one after another:
NASDAQ:ASTS ripping
NYSE:RDW , NASDAQ:LUNR following
This is how sector-wide momentum phases start — once the market smells a big narrative (like a SpaceX IPO), money floods the whole group.
🔹 How I’m Playing It:
1️⃣ Entry: Looking to enter using the EMAs and the bottom of the flag as my guide.
2️⃣ Risk: Stop under the flag lows / EMA support — clean and mechanical.
3️⃣ Mindset: This is a trend continuation, not a chase.
🔹 Why NASDAQ:RKLB Is the One:
It’s a real company with real launches, not just hype.
Already a proven momentum leader in the group.
High tight flags at ATHs are where big trends extend.
🔹 Bonus Watch:
NASDAQ:ASTS is another potential beast if this sector keeps running — keep it on radar.
Space is becoming the next speculative momentum trade — and NASDAQ:RKLB is front and center.

Bitcoin Has Two Bearish Patterns, 1st Might Be A Model For 2nd Updating the Bitcoin chart following the earlier Bear Flag alert
I spotted another bearish continuation pattern that had already formed on top of the Bear Flag, a Pennant marked in orange
I drew it and share with you how it already played out so it can be used as a learning example
This helps illustrate how the current Bear Flag can repeat the same classic stages
1st stage - price broke down from the Pennant below 106k, similar to the recent Flag breakdown below 88k
2nd stage - price made a textbook pullback to the broken support, a common throwback seen in both patterns
3rd stage - price then resumed its downward move, completing the continuation sequence

AEVA Macro Setup: Textbook Bull Flag Breakout on Weekly ChartExecutive Summary: A High-Probability Continuation Play
We are currently tracking a massive technical setup on Aeva Technologies (AEVA) . After a parabolic impulse move of over 1,400% earlier this year, the stock has spent the last few months in a healthy, controlled consolidation phase.
The structure is now complete. The charts are signaling that the consolidation is over, and the next leg of the primary bullish trend is beginning.
Below is a detailed technical and structural analysis of why AEVA presents one of the most attractive risk/reward ratios in the market right now.
________________________________________
1. Market Structure: The "Bull Flag" Mechanics 🏳️
To understand where price is going, we must understand where it has been. The chart is forming a classic Bull Flag / Falling Wedge pattern on the Weekly Timeframe.
Phase 1: The Impulse (The Pole):
The initial rally from $2.50 to $35.60 was driven by institutional demand. This aggressive buying created a "change of character" in the stock, signaling a long-term trend reversal.
Phase 2: The Consolidation (The Flag):
For the past few months, price has drifted lower in a contained channel (marked by the yellow trendlines). Crucially, this sell-off was low volume . This indicates a lack of aggressive selling pressure. It was merely profit-taking by short-term traders, while long-term holders maintained their positions.
Phase 3: The Breakout (Current State):
Price is now breaking above the upper resistance of the wedge. This signals that the supply has dried up, and buyers are stepping back in to push prices higher.
________________________________________
2. Multi-Timeframe Confirmation 📊
A breakout is only as good as the indicators backing it up. We have strong confluence here:
A. Volume Analysis:
Volume is the fuel of any move. Notice the volume profile:
1. High volume during the initial rally (Accumulation).
2. Declining volume during the pullback (No supply).
3. Surging volume on the current breakout candle.
This sequence confirms that "Smart Money" is supporting the current move.
B. Momentum (Weekly MACD):
The MACD indicator on the weekly chart provides a powerful signal. The histogram is flipping bullish, and the signal lines are curling upward for a bullish crossover. Historically, weekly MACD crossovers on momentum stocks lead to multi-week or multi-month rallies.
________________________________________
3. Strategic Targets & Trade Management 🎯
Given the volatility of AEVA, we are using structural resistance levels rather than purely theoretical projections.
🛑 Stop Loss (Invalidation):
A weekly close back inside the wedge structure (below $14.00 - $14.50 ) would invalidate the breakout thesis.
✅ Target 1: The Test ($35.00 - $35.60)
The first major objective is a retest of the previous cycle high. The stock must prove it can clear the supply zone where sellers stepped in last time. Reaching this level represents a potential ~100% gain from current prices.
✅ Target 2: Blue Sky Breakout ($45.00 - $50.00)
If the stock clears $35.60 with volume, there is no overhead resistance. Using Fibonacci extensions, the next psychological targets sit at the $45 and $50 levels.
________________________________________
4. The Fundamental Catalyst (LiDAR)
Technical analysis tells us "when," but fundamentals tell us "why." The LiDAR and Autonomous Driving sector is waking up. As AEVA moves towards commercialization with major automotive partners, the market is pricing in future growth. The technical breakout is likely leading the fundamental news cycle.
💡 Conclusion
This is not a random movement. It is a structured, textbook technical pattern supported by volume and momentum. For traders looking for asymmetric upside, AEVA offers a pristine setup.
Disclaimer: This analysis is for educational purposes only. I am not a financial advisor. Please manage your risk and trade according to your own plan.

SAZGEW Sazgaar🚗 SAZEW – PSX- Weekly Trade Plan | Technical + Fundamental + Latest Sales Data
(Automobile Sector – Pakistan)
📉 Technical Outlook – Weekly Chart
SAZEW is completed a healthy retracement after its strong bullish run.
Key Technical Levels
🔵 Buy Area 1 (0.382 Fibonacci) → Already tested & respected → Early entry zone
🟡 Buy Area 2 (0.50 Golden Pocket) → High-probability support → Best entry zone
🔴 Buy Area 3 (0.618–0.65 deeper retracement) → Only if market pressure increases
Market Structure
Price continues to make Higher Highs (HH) & Higher Lows (HL) on weekly frame.
Retracement is healthy, not bearish – structure intact.
Strong bounce expected from 0.50 Golden Pocket. (if retraced furthe)
🎯 Technical Targets
Target 1: Previous High
Target 2: etimeated TBD TP2 shared. (To be Decided) later for final target.
🛑 Risk Management
Previous Highier Low (for traders) 1057
📊 Fundamental Overview (Strong Outlook)
Quarter-on-Quarter (QoQ) – Growth Confirmed
From the attached official PSX filing (Nov 2025 sales):
Latest:
🚙 FOUR-WHEELER
Production: 1,357
Sales: 1,109
Trend: Strong monthly sales, consistent demand
🛵 THREE-WHEELERS
Production: 1,742
Sales: 1,749
Trend: Sales > Production – inventory clearing = positive demand signal
➡ This shows solid operational efficiency, tight inventory control, and stable demand in both categories.
📈 Year-on-Year (YoY) Growth
(Based on latest quarterly & annual reports – verified)
EPS YoY: Strongly improving
Net profit YoY: Solid rebound
Revenue YoY: Increasing due to higher unit sales and better margins
Equity Growth: Healthy, consistent
Operational Profit: Margin expansion visible
SAZEW fundamentals indicate growth + stability, both essential for medium-term investors.
📰 Latest News Impact (From Attached Notice)
✔ New Sales Data Disclosure (November 2025)
Shows stable and rising demand in both 3-wheelers & 4-wheelers.
Indicates production consistency, meaning no supply chain disruption.
Market takes this as a positive operational indicator.
Overall Impact: POSITIVE
Supports medium-term price appreciation based on earnings and manufacturing strength.
🟢 Final Trading Plan – SAZEW
Buy Zones (Weekly)
1️⃣ Buy Area 1: Already tested (0.382 zone)
2️⃣ Buy Area 2: 💛 Best Buy – 0.50 Golden Pocket
3️⃣ Buy Area 3: Deep value zone (0.618–0.65)
A strong candidate for weekly swing trades & medium-longterm term investment.

Big XRP bullish move formingBYBIT:XRPUSDT has formed a (remarkably equaliteral) triangle flag pattern since breaking out of the parallel channel flag*. Given the previous 25% move upwards (i.e. the flagpole), text book technical analysis theory states that there is another upwards move imminent. This is a good opportunity for a medium term (approx. one month long) bullish swing trade.
A few things to note:
*The breakout move from the parallel flag channel was a text book move upwards where it moved outside of the channel (breakout move), then returned back to the resistance line of the parallel channel, which became support, and then continued the move upwards. This provided a very good entry opportunity upon the return move once the daily candlestick showed proved that resistance line is a now a line of support (i.e. the candlestick is of a dragonfly shape) - you enter on the dragonfly share confirmation
The triangle flag pattern is running out of room. i.e. the move is expected to come soon (this coming week) as the candlesticks are getting smaller and smaller in size, following, broadly speaking, the triangles lines of support and resistance, and there are not many days left until the candlesticks will naturally move out of the triangle.
The market psychology behind this is that the buyers who made a profit on the recent flagpole are now selling, with newer, bullish buyers entering the market. The price which the sellers are willing to sell and and buyers willing to purchase at is getting closer and closer, which usually means the continuation of the trend as there are more buyers (in this case) than sellers (i.e. people are willing to buy at a price closer and closer to the sellers ask price and sellers don't have to drop their prices as much to entire people to buy)
This is consistent with the optimistic and bullish sentiment for the economy in generally, stock market and crypto since Trump's election victory with Trump having recently announced that he would prefer lower interest rates i.e. The chart formation is showing that there are still more bulls than bears.
Risk to this move are that the RSI is overbought (which in this case can be ignored as it has been overbought for a few months and the nature of the indicator is that in a bullish market it remains at an overbought level regularly) and that the crypto market is prone to large gyrations on rumours and even minor US governmental policy announcements.

GOLD Bullish Breakout! Buy!
Hello,Traders!
GOLD broke out of the bullish flag, confirming bullish momentum after absorbing sell-side liquidity. With structure shifting upward, price may extend toward the buy-side liquidity resting at the marked target level.Time Frame 5H.
Sell!
Comment and subscribe to help us grow!
Check out other forecasts below too!
Disclosure: I am part of Trade Nation's Influencer program and receive a monthly fee for using their TradingView charts in my analysis.

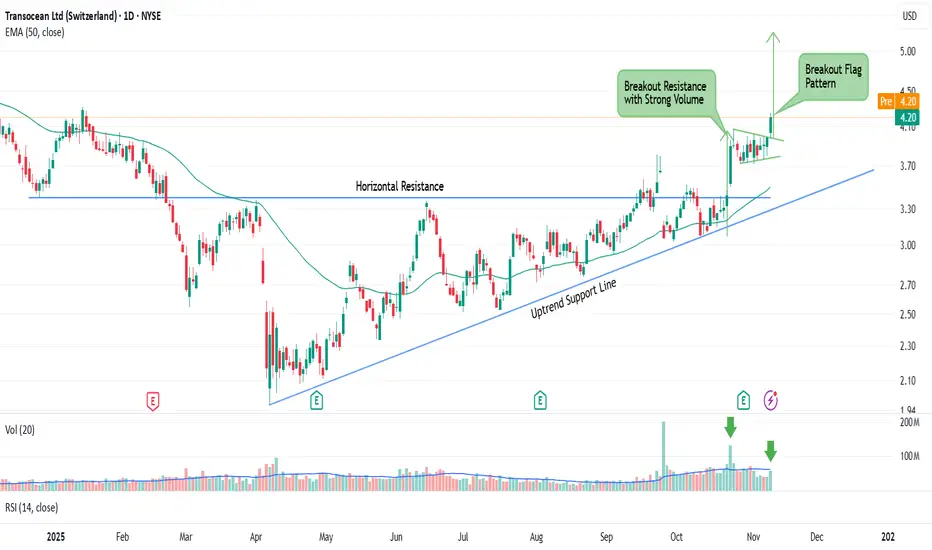
Transocean Ltd (RIG) – Bullish BreakoutSummary:
RIG has broken out of long consolidation and strong resistance at 3.40 with high volume , showing strong buyer interest.
After the breakout, price pulled back and formed a flag pattern , then broke out again yesterday , confirming bullish continuation .
Trading Plan:
Entry: 4.20
Support: 3.72
Target: 5.20
GBPAUD Textbook Bear FlagGBPAUD price had been falling sharply, sellers were in full control, driving the market lower with strong bearish momentum.
Then came a pause. Price started climbing slowly, forming a rising channel. That’s the bear flag. Buyers are trying to recover, but it is weak and hesitant, every push higher is met with selling pressure.
Inside that flag, sellers are waiting for signs of exhaustion. And if price breaks below the structure strongly, that’s the confirmation we need.
I am expecting another impulsive leg down in the direction of the main trend, at around 1.9856.
With this kind of pattern, usually the stop-loss is placed just above the flag.
Keep in mind that this is just an idea, not a trade and not financial advice.

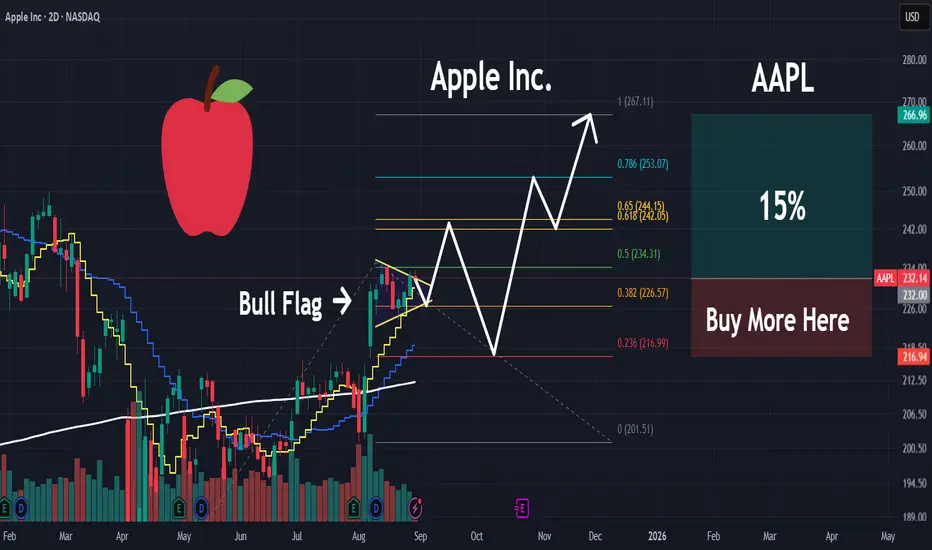
AAPL | Money will Rotate into this MEGA CAP | LONGApple, Inc. engages in the design, manufacture, and sale of smartphones, personal computers, tablets, wearables and accessories, and other varieties of related services. It operates through the following geographical segments: Americas, Europe, Greater China, Japan, and Rest of Asia Pacific. The Americas segment includes North and South America. The Europe segment consists of European countries, as well as India, the Middle East, and Africa. The Greater China segment comprises China, Hong Kong, and Taiwan. The Rest of Asia Pacific segment includes Australia and Asian countries. Its products and services include iPhone, Mac, iPad, AirPods, Apple TV, Apple Watch, Beats products, AppleCare, iCloud, digital content stores, streaming, and licensing services. The company was founded by Steven Paul Jobs, Ronald Gerald Wayne, and Stephen G. Wozniak in April 1976 and is headquartered in Cupertino, CA.
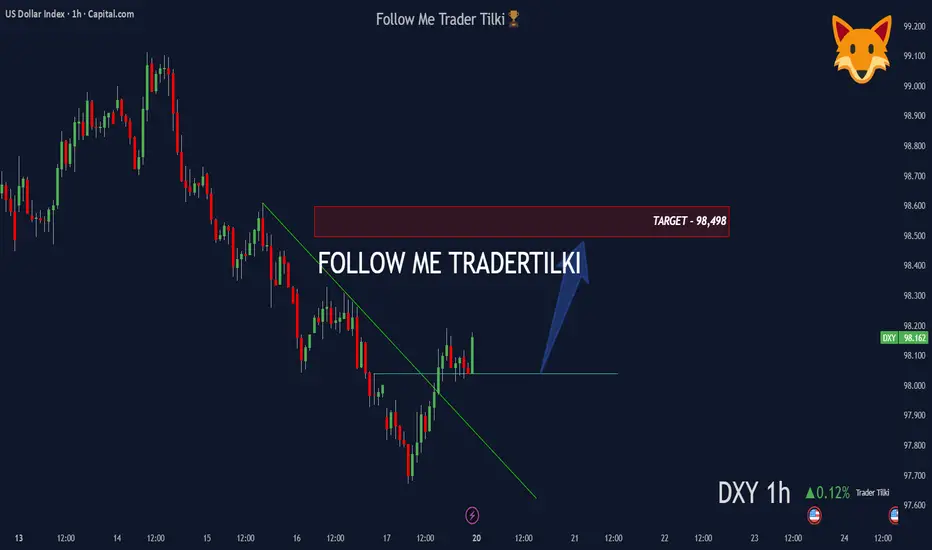
DXY 1H Analysis: Trendline Break with Rising Volume 📊 DXY – 1 Hour Analysis
Technical Outlook:
The trendline has been broken and rising volumes are drawing attention.
Based on this setup, my target level is: 98,498 🎯
Fundamental Analysis:
Recently, a White House economist stated that “we are not in any kind of economic war with China,” which reduced uncertainty in the markets and strengthened the dollar index.
In addition, FED policies, interest rate expectations, and tightening measures continue to be key factors supporting upward pricing on the DXY side.
🙏 Thanks to everyone who supports me with their likes.
$COIN viction Trade: Weekly Up, Daily Tight
NASDAQ:COIN
Summary
NASDAQ:COIN exhibits a textbook “expand → break → retest → coil” progression. A broad weekly megaphone that developed through 2024 continued into 2025 with a June ’25 breakout; price subsequently reached ~$445 (megaphone resistance) in July ’25 and then retraced in an orderly fashion, holding above 2023’s ceiling. Since that pullback, ranges have narrowed and participation has declined while price consolidates above $280—behavior consistent with constructive acceptance before a potential next leg higher.
Market Structure and Setup
The primary structure is defined on the weekly chart: an expansionary megaphone that retested prior highs. Tactically, the daily chart shows a controlled pullback, retest, and subsequent coil. This multi-timeframe alignment—higher-timeframe trend with lower-timeframe acceptance—creates favorable conditions for measured moves and for risk to be defined against transparent levels rather than discretionary judgment.
Fibonacci-Based Upside Roadmap
Anchoring to the 2024–2025 impulse advances, 1.618 extensions cluster around ~$580 (Sep ’24 → Dec ’24 leg) and ~$650 (Oct ’23 → Mar ’24 leg). These are not short-dated “targets” but conditional waypoints: they remain operative if the current consolidation resolves higher and the weekly uptrend reasserts.
Microstructure: Short Consolidations as Future Magnets
In sustained advances, brief, tight candlestick compressions often function as “price memory,” attracting subsequent retests and liquidity. COIN’s February 2024 bull-flag pause—formed mid-run—has been revisited multiple times since, underscoring how such compressions act as magnets in later price action. The present tight band atop $340–$370 should be viewed in similar context: it is both a potential near-term launchpad and a likely reference zone for future pullbacks as supply and demand re-balance around it.
Execution Plan
Accumulation is favored on constructive behavior within $290–$330 (retest followed by a higher low on the daily). For risk management, tactical invalidation sits below ~$280; for participants keying off weekly structure, a wider ~$250 stop aligns with the higher-timeframe shelf. If momentum resolves first, additional entries are reasonable on a clean break-and-hold above local range highs, using the reclaimed shelf to maintain tight risk. From a successful breakout, staged distribution into ~$580 with reassessment into ~$650 allows the position to self-finance while respecting the possibility of momentum fatigue.
Invalidation Criteria
A daily close back below ~$280 would indicate the near-term reclaim has failed and the base requires more time. A weekly close beneath ~$250 would challenge the integrity of the larger expansionary structure. Either signal warrants standing aside and allowing the chart to reset.
Fundamental Linkages
Coinbase’s revenue remains acutely sensitive to crypto price trends and realized volatility. When BTC/ETH trend and trading activity broadens across spot and derivatives, COIN’s top line typically expands with the cycle. The U.S. regulatory backdrop has moderated relative to the prior year—removing one overhang—yet policy risk persists and can shift rapidly. In effect, the technical setup has a plausible fundamental tailwind when the broader crypto complex trends and trades.
Key Risks
Crypto beta: A broad risk-off in digital assets will likely transmit to COIN regardless of technical posture.
Policy/regulation: Adverse enforcement actions or new rules could impair volumes, product breadth, or take rates.
Competition: A prospective Kraken IPO would arm a major U.S. competitor; Robinhood’s continued crypto build-out pressures economics during quieter tapes.
Operational/security: Exchange businesses carry ongoing operational and cybersecurity risks; incidents can compress multiples abruptly.
Conclusion
The market disclosed intent with the June breakout; current price action is testing sponsorship. Provided COIN continues to accept above $280–$330 and the ongoing coil resolves upward, the $580 → $650 roadmap remains credible. The operative plan is to trade the daily in the direction of the weekly, treat the former resistance shelf as the line in the sand, and require the chart to confirm strength before pressing exposure.
Not financial advice. Just charting things out. Let’s see what happens. Please adapt levels, sizing, and risk controls to your own process and constraints.

Corweave multi Billion Dollar Bull Flag deal till 2029 CoreWeave operates AI data centers in the U.S. and Europe, offering access to Nvidia's GPUs, which are highly sought after for training and running large AI models.
The latest order, which requires Nvidia to purchase any unsold capacity through April 13, 2032, builds on an April 2023 agreement.
The amended agreement serves as a backstop for CoreWeave, ensuring that capacity will be leveraged irrespective of the end customer, analysts at Barclays said, adding that the incremental spending by Nvidia is seen as a healthy diversification away from the company's largest customers.
"I see this as a positive for CoreWeave given concerns from investors around the company's ability to fill data center capacity beyond its two largest customers (Microsoft and OpenAI)."
In March, CoreWeave and OpenAI agreed on a five-year contract worth $11.9 billion, under which the New Jersey-based firm provides the ChatGPT maker cloud computing capacity.
The company signed an additional agreement under which OpenAI has committed to pay up to $4 billion through April 2029.

NASDAQ-NAS100 4H Analysis: Buy OpportunityHello Guys,
I’ve prepared a 4-hour NAS100 analysis for you.
I’ll be entering a buy position from 24,500.00 with a target set at 24,748.00.
Set your stop level according to your own margin.
Once the markets open, I’ll definitely take my shot on the buy side of NAS100.
Let’s see how this analysis plays out together.
Every like is my biggest motivation to keep sharing these analyses.
Thanks to everyone supporting me!

GOLD 1H - flag breakout confirms bullish momentumOn the 1H chart, gold has completed a bullish flag formation and already broken out to the upside. Key retest levels sit at 3748 and 3730, where buyers may confirm control. With EMA50 and EMA200 holding below, structure remains bullish. RSI has cooled off, supporting a potential continuation move.
Fundamentally , dollar weakness and Fed uncertainty sustain safe-haven demand.
Tactical plan: watch for price reaction on a possible retest of 3748–3730, as buyer interest here could launch a push toward 3820–3830.
The breakout has already happened - now gold needs confirmation to extend the rally.

GOLD BULLISH BIAS|LONG|
✅XAUUSD Price forms a bullish flag above the wide demand area, showing ICT displacement. Smart Money likely drives momentum toward liquidity resting at 3,780$. Time Frame 3H.
LONG🚀
✅Like and subscribe to never miss a new idea!✅

President Trump Speaks, Israel Strikes—What’s Gold Gonna Do?Hey Guys,
It’s been a while since I dropped a gold chart. Got a ton of requests—so here’s a fresh swing setup for you.
Fundamentally, President Trump recently said “Trump says his patience with Putin is running out.” That kind of statement adds fuel to gold’s upside. Plus, Israel’s attacks in the Middle East are also pushing gold higher.
Right now, gold’s in a resting phase. But I’m expecting a move toward $3700 either this week or next.
Technically, I’m seeing a clean bull flag pattern.
I always work with both fundamentals and technicals. That’s why my swing target is $3700.
Every like you send is my biggest motivation to keep sharing these setups. Big thanks to everyone backing me.

Bullish flag The bullish flag pattern has formed .
and based on FiboNachi and Ichimiko data, it can also rise.

FETUSDT (D): Bullish Flag PatternFETUSDT
Daily
Bullish Flag pattern,
Current price range is forming a support zone.
Fundamentally, it has all the spices to justify the above analysis.
Enjoy the ride!

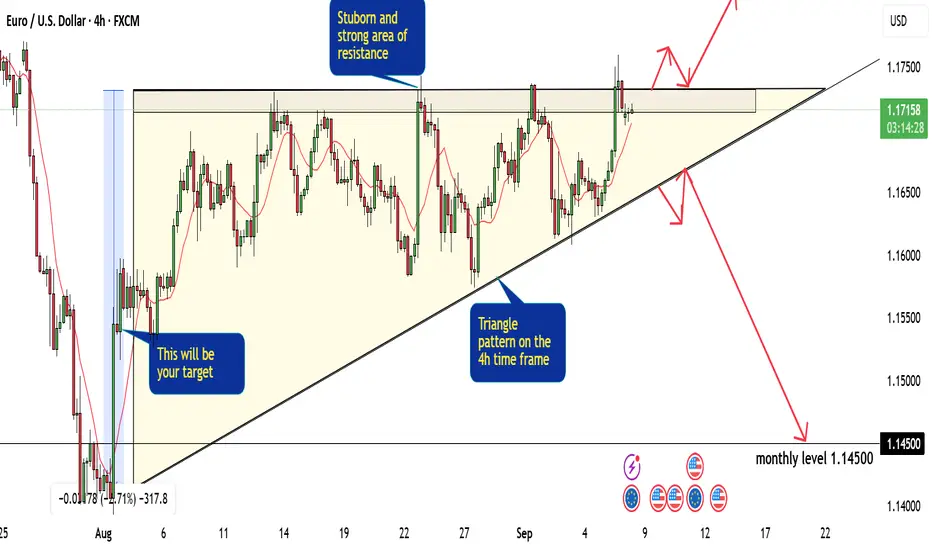
Tips And Trick On How to Trade The Flag Pattern With Perfection!Hey Everyone, in this chart we have a very clear pattern FLAG on the 4H timeframe and on the 1h timeframe. this pattern consists of three sides:
1- the trend line side:
if this side is broken then we will have to wait for a nice retest and then enter our trade which will be in the opposite direction of the trendline ( in our EURUSD it will be a sell trade).
2- the resistance area:
it is a very strong area that pushes the price very hard to the downside, once this area is broken we can enter an easy buy trade directly or we can wait for a good confirmation and a nice retest for the area.
3- the target side :
in most of the chart patterns these patterns gives you an indication of the amount of pips you are waiting for. the third side of the FLAG pattern is actually your target for the trade, try to take between 20 to 50 pips less than what is showed on this side.
so as a conclusion of the EURUSD analysis we are waiting for a good break to the trendline or the resistance area and then we can determine what our next step and if we will enter a buy or sell trade
KC | Massive Break Out Incoming | LONGKingsoft Cloud Holdings Ltd. provides cloud storage and cloud computation services. It offers cloud platform consisting of cloud infrastructure, cutting-edge cloud products and architected industry-specific solutions across public cloud, enterprise cloud and AIoT cloud services. The firm's products include computing, networking, storage & CDN, database, data analysis and security. It offers medical & healthcare solutions, supply chain finance solutions, e-government solutions, internet of vehicles solutions, media cloud solutions, big data education & training solutions, cloud integrated service and cloud gaming service. The company was founded in 2012 and is headquartered in Beijing, China.

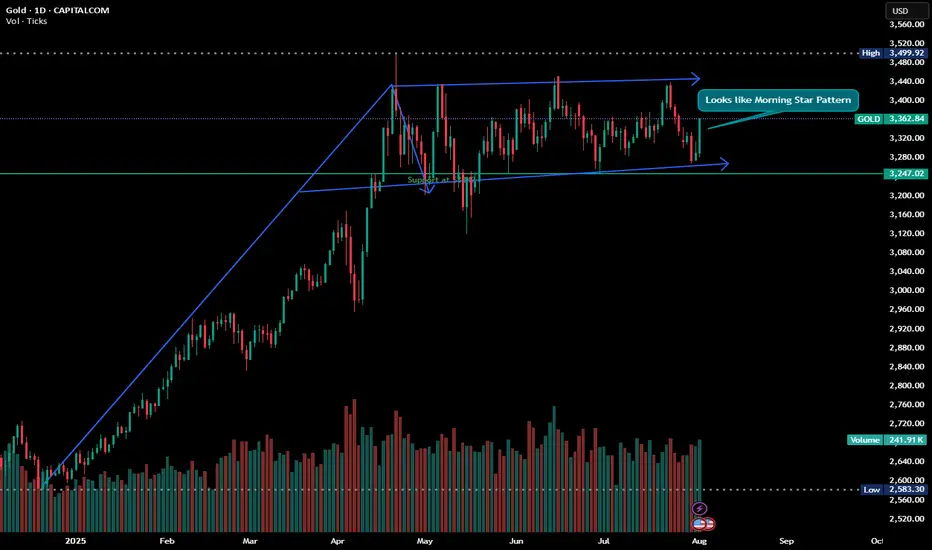
Glitters of Gold - Looks like Morning Star and Bullish Flag Disclaimer : Do your own research before investing. This is just a chart analysis. No recommendation to buy and sell.
With the up and down of stock market, there is always a safe investment place and its shine increase as the time passes with the increase in price, yes its GOLD. Everyone love it. if you look at gold from last couple of years, there is continuous growth in this metal.
while doing my chart analysis i found gold charts are quite interesting.
Gold is currently trading in range and formation of 2 patterns can be seen in the daily chart with my support and resistance level marked in CHART.
For some its investment and for some its trading however my recommendation is always do some SIP in GOLD.
Happy Investing.
Gold: final pullback or bull trap?On the 1H chart, gold (GOLD) is forming a bullish flag after a sharp decline, which may just be a corrective move within a broader downtrend. The price is now approaching the key resistance zone around $3313–$3317 - this area holds the POC, broken trendline, and the 0.705–0.79 Fibonacci retracement from the last drop. This is the decision-making zone.
If bulls fail to push above it, we expect a move down toward $3268 - the next strong support and potential buy zone, also confirmed by Fibonacci and local demand. Stochastic divergence and slowing volume suggest a possible rebound from that level. However, if the price breaks and holds above $3317, this would indicate a local trend reversal, with targets at $3333 and $3374.
Watch the $3317 zone closely - bulls have yet to prove this is more than just a bounce.
