$XRP.X $XRP On Its way for another Flag Breakout with $BTC.XTracking Flag Breakout once $BTC is over $8,300
Flag-breakout

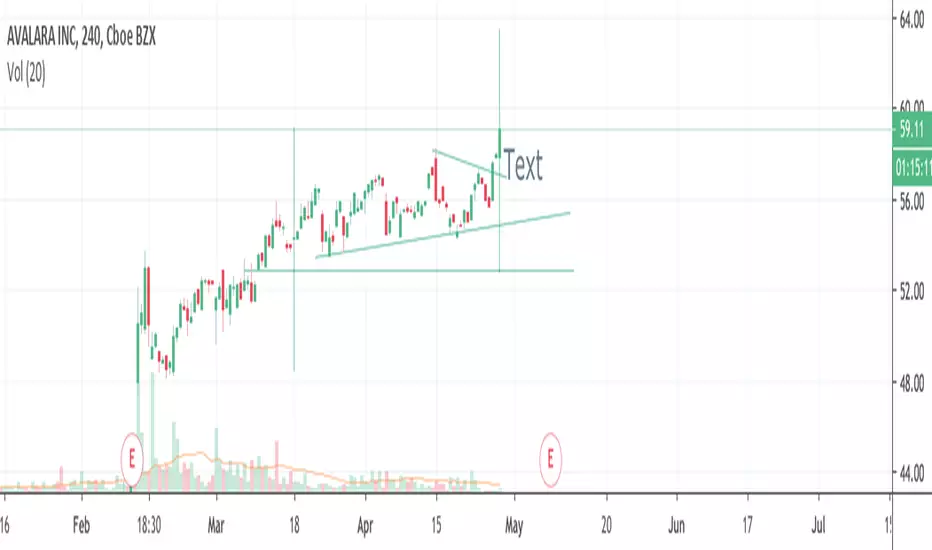
$AVLR BreakoutOriginally what looked like a rising wedge converted into a flag, which just broke out above $59.
A conservative near term price target is at $63.
This is not advice and just an idea of what may be happening.
AUDUSD short term sell!Hello traders, as you can see I'm looking for sell on AUDUSD. It broke the smaller trendline and now we have to wait for some sideways candles to confirm down move. The bigger picture looks upside, and for that reason as i mentioned it will be short term trade. Usually i don't trade against bigger picture, but in this case RR ratio is amazing for me and thats the reason why i wanna take that sell. Down below you will find my bigger picture.
BONUS: Don't jump into the sell now, even if it drops fast. Chart will always correct and that's the place for safer sell!
Make the bank rolls! ;) $$$$
My daily view on AUDUSD!
If you like what i do click that like & follow button. Likes and followers motivate me to spend my free time posting content for you!
Thank you for your support!
All the best,
Antonio

BAT getting ready for another leg upKeeping an eye on $BAT.
Ideally it will stay in this bull flag for a bit longer, confirm the resistance and then go for another leg up.
I'll enter on the breakout, if indicators won't persuade me otherwise.
EURGBP 4H RISING CHANNEL.I'm reposting this. You can see the falling channel and the rising channel after it.Enough volatility to confuse us these last days. There is an excellent breakout and retest but for me, it's too low. It barely touched the 0.382 fib retracement. I will put a pending order at 0.618 fib retracement with 2 targets. tp1 at previous low and tp2 at 1,272 fib extension. Enjoy!!!

USD/CAD: Forecasting !!BUY & SELL Above Given Chart or
You Can Also set Own Risk reward.
Let see what Will be Next Move.
Warning- I m Not a Financial Advisor this idea Only For Educational Purpose Only.
Thank You !!

sell the strong breakoutdont sell until you see a strong breakoutout of the flag. price might retest the 111.000 again and then drop . so only in strong breakout get into this trade

LONG on GBPUSDHi guys, as you can see nice 1h flag is forming on the trendline. Take that breakout with your own tested strategy! I'm looking for the bigger up move on GBPUSD.
So keep an eye on it & trade with care & be patient!
If you like what i do click that like & follow button. Likes and followers motivate me to spend my free time posting content for you! Thank you for your support!
All the best,
Antonio

Eur/GbpLooks like it completed a flag. I would look to scalp to those lows and then let some run in case it turns out to be much more. Possibly can go down a lot..

NZDUSD Short. Possible bear flag breakout but tricky situationThe price tested EMA above and reversed strongly from it. Bear flag and a strong bear bar on 4h. A 3-push wedge on Daily (see chart below).
Yet, the current point is a 50% pullback from the last bull trend and a test of the long-term trend line. I´m setting a tight stop just beyond the bear flag max and a respective small 1R target. Also staying short UCad at the top of the bull channel so let´s see which side prevails.
Daily:


Flag-Pattern forming a nice Buy-Chance! #PotentialHey tradomaniacs,
another Chance is forming right now.
A Flag-Pattern is usually a trend continuation pattern and should give us a nice Buy-Signal as soon as we see the Breakout. :-)
If we Break down below the important support we could also sell.
Just be ready for all scenarios. :-) VOLUME inc.
Peace and good trades
Irasor
Trading2ez
Wanna se more? Don`t forget to follow me! :-)
Any questions? Need education or more signals? Pm me. :-)


USDCHF Big Picture ViewUSDCHF is currently trading in a big corrective structure where I expect the 5th wave to the top of the structure to complete before we see a break to the downside.
Smaller time frames show that there is the possibility of one more small move down before we see a break of the current flag formation to the upside to complete wave 5 on the bigger picture.
I will post analysis on the smaller time frame in a separate idea.
Direct message me for any assistance required
Cheers
Linton

GBPUSD - Will the Services PMI Push Price Lower?Price completed a 3-wave structure, forming a flag pattern. This completes the corrective structure, and giving us a reason to look for a potential short trade with the upcoming UK Services PMI being a catalyst to move price.
**Disclaimer - This analysis alone DOES NOT warrant a sell trade immediately. Before you enter any trade in the financial market, it is very important that you have a proper trading plan and risk management approach.
The sharing of this idea is neither necessarily indicative of nor a guarantee of future performance or success.


S&P Printing a Bull FlagS&P is still long term bullish in my opinion. We remain in a strong uptrend that is yet to be broken, 200 day MA has acted as support during this consolidation period, and we are currently trending above the 50 day MA. I don't think we will see a death cross so long as we continue up from here.
I am anticipating a breakout from this flag with a target of around d 2900. The NAS100 printed a similar bull flag which lead to breakout to the upside, and I think there's a good chance the S&P will follow. A breakdown would be OK as long as the 200 day MA can act as support again, at which point I would be a buyer.

The 1day candle has reached the breakout target with precisionJust wanted to point out how precise the Bull flag projected breakout target was with where our current 1 day candle is stopping and finding resistance. No big surprise there because bull flag breakout projection targets are always pretty close but it's always fun when the price stops right smack dab at the projected target and just futher confirmation that TA works. As you can see we have broken above the top dotted blue trendline of the rising wedge....that trendline represents the candle bodies. However just to be safe since the bottom part of the wedge seemed to have more touches at the wick we can see where I have drawn another rising wedge top trendline in solid blue above the dotted rising wedge top trend line. The difference between the 2 is simply that the lower one represents the top of the rising wedge if we are using candle bodies to track the trend, and the top blue line represents the top trendline if we are using the wicks/shadows of the candlesticks to track the trend...so while it's an extremely positive sign that we have surpassed the dotted rising wedge trendline....and that could very well be all thats need for a bullish breakout from the wedge...probability is higher that the top blue trendline trending off of the candles wicks is more accurate on this pattern since the bottom is getting more touches on the wicks....you can see in our previous consolidation pattern both the wick pattern(symmetrical triangle dotted green lines) and the body trendline pattern(standard bull flag solid green lines) ended up both being valid and somehow synced up...with both having the exact same bullish breakout price target based on the size of the symmetrical triangle and size of the bull flag...that is very rare....more often then not its one pattern or the other that is more valid. So for that reason I often try to consider both just in case one may be more valid than the other. SO for now there's a possibility we have broken up out of the rising wedge...we were certainly finding resistance at the body trendline...but then again there was a fib line at that level too....however unless we see a ig surge of bull volume I'm not convinced we have broken through the rising wedge just yet...if we do not then odds are much better the trendline drawn on the candle wicks will be thevalid one....and if that's the case a the wick trendline will lengthen the rising wedge bringing it's apex to an exact point and intersection with my projected moment that the eve bottom trendline reaches the neckline of the Adam & Eve double bottom. Very peculiar...but because of this that simply strengthens the odds that my trajectory for the eve curved trendline is spot on. If so, we should have quite the bear/bull fight if we stay inside this rising wedge all the way until the adam and eve double bottom. Many bears will expect to break down from the rising wedge and tons of bulls will expect that we are going to break the neckline and go shooting up to $17,400 I personally will be leaning towards siding with the bulls since I will be factoring in the large descending wedge pattern from the weekly chart that we broke out of and the fact that it's upward projection target is 18,800. However I will be prepared for any breakdown from the rising wedge that may occur...although any that does has better odds of being a bear trap than it actually will have of negating or canceling out our adam and eve double bottom/weekly chart descending triangle breakout. You of course should make your own decision however for this is like all my other ideas not meant to be considered financial advice. Best of luck and thanks for reading!
USDZAR: Buy after flag breakoutThe target aims to the 100% fibo extension and the stop loss was placed at the bottom of the flag.
I sold it a little bit lower to avoid some of the spread.

Another game of capture the flag between the bulls & bearsOnce again we had a breakdown from a bearflag that several candles later found a way to make it's way back into the flag showing us an unusally long false breakout and then instantly forming a bull flag inside that bear flag. The previous time this happened the bull flag ended up winning and shooting upward out of the bearflsg...currently it appears as if we may breakdown on this one...so for now I remain short but keep in mind thsat lately here multiple confirmation candles under the flags have not been enough to confirm them so tread carefully because even if it breaks out on this candle and then confirms the breakdown on the next unless we see significant volume to coincide with that dip it may just be another false breakdown. Stay vigilant my friends!

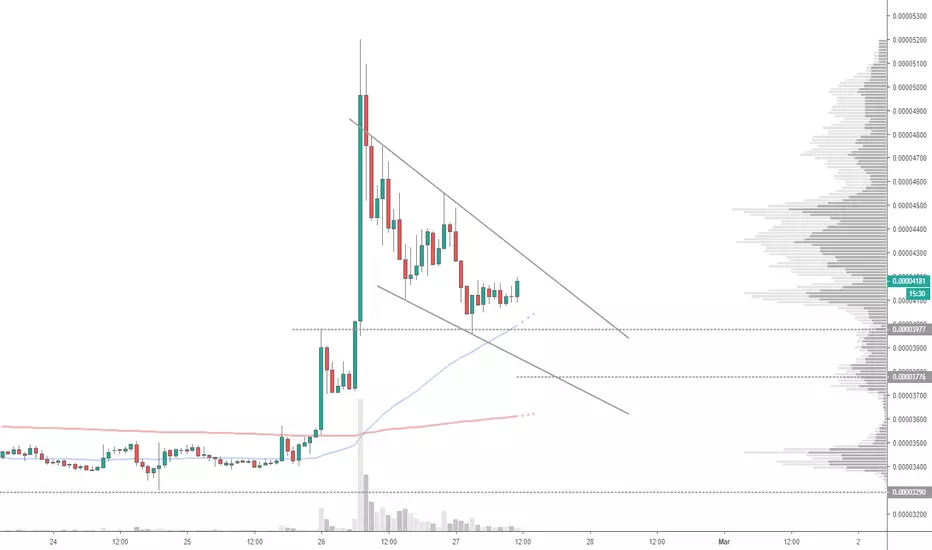
MODUM (MOD) - FLAG with Breakout I totally love this token.
Have invested in it at ICO and I made good trades with it at all time high.
Now it's recovering and I hope to see it soon back to 46k sats, all depending on BTC though...
It had a nice bounce right off below 78% Fibonacci and shows nice signs to come up. Volume this week was great.

breakout of 1hr bear flag confirmed; projectd target reachedWe finally recieved a breakout of the bear flag which shot us back up into the bull flag to the exact height of the bearflags pole...we are now still consolidatin in the bear flag with probability favoing an upward breakout but the chance of another bullish fakeout and the chance of a bearish rbeakdown are still both very p;ausible...best to just hold until we see an obvious signal one way or the other.

Pin bar on GBPCHFUSDCHF gaining momentom to the up side and this pair seem to do the same. We formed a pin bar at the bottom of a very shallow momentum. Good R/R with high probability to breakout to the up side.
