Bullish Flag Pattern appearing.MLCF analysis
Closed at 113.52 (29-01-2026)
Bullish Flag Pattern appearing.
Crossing 130 with Good Volumes may lead it towards
New Highs targeting around 160+
However, for Fresh Entry, wait for the Green Candles in
the range of 106 - 112.
Flagformation

Given Breakout on bigger tf.PRESIGHT Analysis
CMP 3.55 (27-01-2026)
Given Breakout on bigger tf.
However, 3.40 - 3.50 can be re-tested.
Upside Targets can be around 5 if 4.10 is crossed
with Good Volumes & Sustained.
Breaking 3.40 may bring more selling pressure towards 3 - 3.20

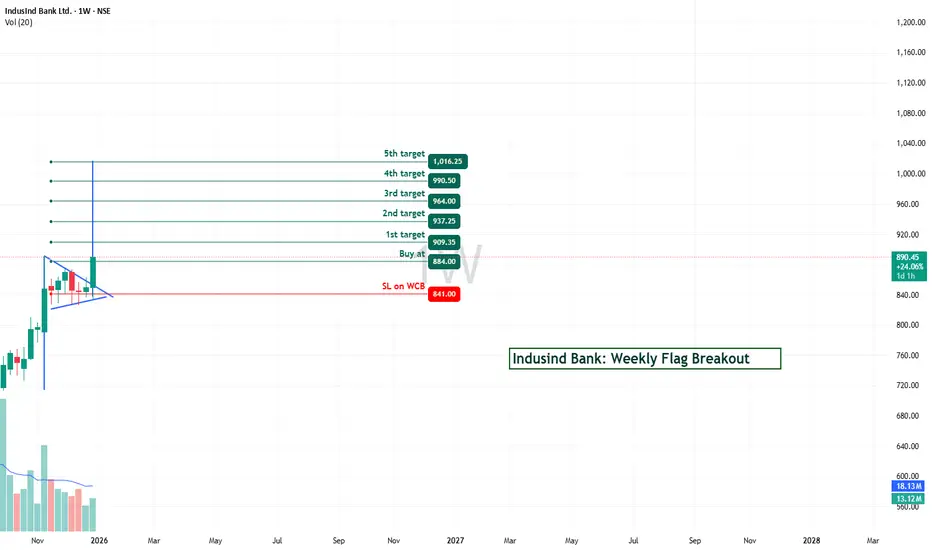
INDUSINDBK Bull Flag Breakout | Target ₹1,016+ | Weekly AnalysisINDUSINDBK Bull Flag Breakout | Target ₹1,016+ | Weekly Analysis
━━━━━━━━━━━━━━━━━━━━━━━━━━━━━━━━━━━━━━━━━━━
📊 TECHNICAL SETUP
Current Price: ₹890.20 (+3.01%)
Timeframe: Weekly (1W)
Pattern: Bull Flag Breakout (Confirmed)
Exchange: NSE
Sector: Banking / Financial Services
━━━━━━━━━━━━━━━━━━━━━━━━━━━━━━━━━━━━━━━━━━━
🎯 PATTERN ANALYSIS
IndusInd Bank has formed a TEXTBOOK BULL FLAG pattern on the weekly timeframe:
✅ Impulsive Move: Strong upside momentum establishing the flag pole
✅ Consolidation Phase: Higher lows and controlled pullback forming the flag
✅ Breakout: Successful breakout above flag resistance at ₹884.00
✅ Volume Confirmation: 12.8M-13M weekly volume confirming strength
✅ RSI Divergence: Advanced RSI showing Regular Bullish Divergence
The stock has decisively moved above the consolidation zone, confirming bullish intent. Bull flags are continuation patterns with approximately 75% success rate on higher timeframes.
━━━━━━━━━━━━━━━━━━━━━━━━━━━━━━━━━━━━━━━━━━━
📈 PRICE TARGETS (Progressive)
1st Target: ₹909.35 (Immediate) - 2.1% from current
2nd Target: ₹937.25 (Short-term) - 5.3% from current
3rd Target: ₹964.00 (Medium-term) - 8.3% from current
4th Target: ₹990.50 (Extended) - 11.3% from current
5th Target: ₹1,016.25 (Long-term) - 14.1% from current
Targets are derived from flag height projected from the breakout point, a standard technical approach for pattern continuation measurements.
━━━━━━━━━━━━━━━━━━━━━━━━━━━━━━━━━━━━━━━━━━━
🛡️ RISK MANAGEMENT
Entry Zone: ₹884.00 - ₹890.20 (Breakout confirmation)
Stoploss: ₹841.00 (Weekly Close Entry basis)
Risk/Reward Ratio:
- Risk (890 to 841) = 49 points
- Reward (890 to 1016) = 126 points
- R:R Ratio = 1:2.57 (Excellent)
Position Sizing: Risk only 1-2% of your capital per trade
Stoploss placement is BELOW the consolidation zone.
━━━━━━━━━━━━━━━━━━━━━━━━━━━━━━━━━━━━━━━━━━━
📍 KEY LEVELS
Immediate Support: ₹884.00 (Breakout level)
Secondary Support: ₹841.00 (Stoploss level)
Resistance 1: ₹909.35 (1st Target)
Resistance 2: ₹937.25 (2nd Target)
Major Resistance: ₹1,016.25 (Long-term Target)
━━━━━━━━━━━━━━━━━━━━━━━━━━━━━━━━━━━━━━━━━━━
⚙️ ACTIVE INDICATORS
🔹 Volume Profile (20-period)
Confirming accumulation and rising breakout volume
🔹 Advanced RSI Divergence Detector (14-period)
Regular Bullish Label detected
RSI at 60 level (Strength confirmation, not overbought)
🔹 Dynamic Swing Anchored VWAP
Providing dynamic support during uptrend
━━━━━━━━━━━━━━━━━━━━━━━━━━━━━━━━━━━━━━━━━━━
✨ TRADING STRATEGY NOTES
• Bull flags have ~75% success rate on weekly timeframes
• Weekly breakouts carry higher conviction than intraday
• Volume confirmation during breakout is CRUCIAL - present here
• RSI bullish divergence adds confluence to thesis
• Consider taking partial profits at each target level
• Trail stoploss after hitting first target (₹909.35)
• Manage position size according to your risk tolerance
━━━━━━━━━━━━━━━━━━━━━━━━━━━━━━━━━━━━━━━━━━━
⚠️ CRITICAL DISCLAIMER
🔴 THIS IS TECHNICAL ANALYSIS FOR EDUCATIONAL PURPOSES ONLY
🔴 THIS IS NOT FINANCIAL ADVICE OR AN INVESTMENT RECOMMENDATION
This analysis:
- Is based on historical price patterns and technical indicators
- Does NOT constitute investment advice or a buy/sell recommendation
- Is my personal observation and analysis
- Should NOT be the sole basis for any investment decision
━━━━━━━━━━━━━━━━━━━━━━━━━━━━━━━━━━━━━━━━━━━
⚠️ IMPORTANT RISKS TO UNDERSTAND
✓ Past performance does NOT guarantee future results
✓ Technical patterns can FAIL and breakouts can reverse
✓ Market conditions can change rapidly without warning
✓ This analysis is based on historical data only
✓ All equity investments carry significant risk of loss
✓ You may lose your ENTIRE investment amount
✓ This is a pattern observation, NOT a guaranteed trade signal
✓ Consult a qualified financial advisor before trading
✓ Do your own independent research (DYOR)
✓ Use strict position sizing and risk management
✓ Never trade with leverage unless you fully understand risks
✓ News events, earnings, and market gaps can invalidate patterns
✓ Market liquidity and slippage can affect entry/exit prices
✓ Regulatory changes can impact stock performance
━━━━━━━━━━━━━━━━━━━━━━━━━━━━━━━━━━━━━━━━━━━
🔴 FINAL RISK ACKNOWLEDGMENT
TRADING AND INVESTING IN STOCKS INVOLVES SUBSTANTIAL RISK OF LOSS.
I am NOT a financial advisor, fund manager, or investment professional. This analysis is provided for educational purposes only.
BEFORE MAKING ANY INVESTMENT DECISION:
✓ Conduct your own thorough research
✓ Understand the company's fundamentals
✓ Check news and recent developments
✓ Verify your risk appetite and capital availability
✓ Consult with a qualified financial advisor
✓ Only invest capital you can afford to lose
✓ Never follow this as a guaranteed strategy
Your investment decisions are YOUR responsibility. Use proper risk management, stop losses, and position sizing.
━━━━━━━━━━━━━━━━━━━━━━━━━━━━━━━━━━━━━━━━━━━
Trade responsibly. Risk management is paramount.
#INDUSINDBK #BullFlag #TechnicalAnalysis #NSE #Trading #Breakout #WeeklyChart
Flag Pattern appeared.GCWL
CMP 20.57 (01-01-2026 02:05pm)
Flag Pattern appeared.
Crossing & Sustaining 23 may lead it towards 30+
However, it should not break 16 this time.

Hindustan Aeronautics Ltd Taking Reversal from Key Support ZoneThis is the daily timeframe chart of HAL.
HAL is showing a strong Law of Polarity (LOP) support near the ₹4050–4100 zone.
The stock is currently trading within a falling channel, with the channel support aligning closely with the same LOP support area.
This structure indicates the possibility of a flag and pole pattern formation. If the channel support continues to hold,
the stock may attempt a move towards the channel resistance zone near ₹4750–4800.
Thank you.

GULSHAN POLYOLS LTD - Monthly Chart📊 GULSHAN POLYOLS LTD – Monthly Falling Channel After a Strong Vertical Rally 📉➡️🚀
📅 Updated: Dec 05, 2025 | ⏱️ Timeframe: 1M
CMP: ₹139.76 (+0.70%)
Ticker: NSE:GULPOLY
🔍 Technical Overview
Gulshan Polyols is currently trading inside a multi-year falling channel after a massive vertical rally seen between 2020–2021.
The stock has been consolidating in a controlled corrective structure — a descending channel / bullish flag pattern — which often forms as a continuation pattern in strong momentum stocks.
Current price action suggests:
Price is near the lower channel support
A potential reversal zone if buyers step in
Selling pressure weakening compared to earlier legs
Monthly candles forming long wicks near support, indicating demand absorption
If the lower channel holds, the structure sets up for a medium- to long-term breakout opportunity.
🎯 Chart Summary
GULPOLY remains in a controlled correction after a parabolic rally.
The monthly falling channel suggests a potential flag pattern, which is bullish in nature if the breakout occurs above the upper boundary.
A decisive close above ₹185–₹200 could trigger:
🎯 Targets:
₹245 (channel breakout target)
₹300+ (measured move of previous rally continuation)
If support fails:
Watch ₹120 and ₹105 as deeper demand zones.
⚠️ Disclaimer
This analysis is for educational and chart-study purposes only. Not investment advice.

Big XRP bullish move formingBYBIT:XRPUSDT has formed a (remarkably equaliteral) triangle flag pattern since breaking out of the parallel channel flag*. Given the previous 25% move upwards (i.e. the flagpole), text book technical analysis theory states that there is another upwards move imminent. This is a good opportunity for a medium term (approx. one month long) bullish swing trade.
A few things to note:
*The breakout move from the parallel flag channel was a text book move upwards where it moved outside of the channel (breakout move), then returned back to the resistance line of the parallel channel, which became support, and then continued the move upwards. This provided a very good entry opportunity upon the return move once the daily candlestick showed proved that resistance line is a now a line of support (i.e. the candlestick is of a dragonfly shape) - you enter on the dragonfly share confirmation
The triangle flag pattern is running out of room. i.e. the move is expected to come soon (this coming week) as the candlesticks are getting smaller and smaller in size, following, broadly speaking, the triangles lines of support and resistance, and there are not many days left until the candlesticks will naturally move out of the triangle.
The market psychology behind this is that the buyers who made a profit on the recent flagpole are now selling, with newer, bullish buyers entering the market. The price which the sellers are willing to sell and and buyers willing to purchase at is getting closer and closer, which usually means the continuation of the trend as there are more buyers (in this case) than sellers (i.e. people are willing to buy at a price closer and closer to the sellers ask price and sellers don't have to drop their prices as much to entire people to buy)
This is consistent with the optimistic and bullish sentiment for the economy in generally, stock market and crypto since Trump's election victory with Trump having recently announced that he would prefer lower interest rates i.e. The chart formation is showing that there are still more bulls than bears.
Risk to this move are that the RSI is overbought (which in this case can be ignored as it has been overbought for a few months and the nature of the indicator is that in a bullish market it remains at an overbought level regularly) and that the crypto market is prone to large gyrations on rumours and even minor US governmental policy announcements.

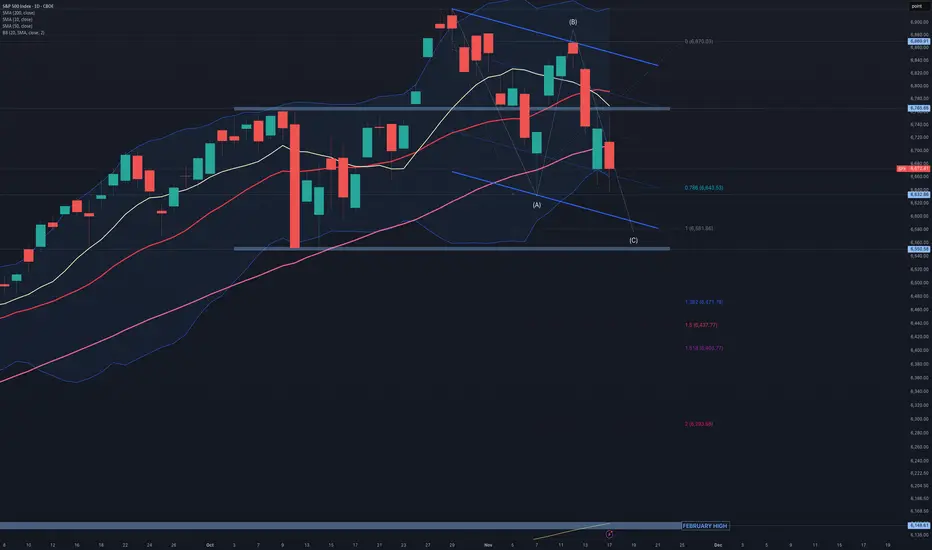
$SPX:Bearish technical indicators are accumulating:SPX: Bearish technical indicators are accumulating:
1) A sell signal on the MACD.
2) The RSI14 is at 42.
3) There has been a break below the 10, 20, and 50-period simple moving averages.
4) There is an inability to break above the horizontal resistance at 6765.
It is evident that the bullish momentum that followed the extremely bearish candlestick on October 10th has stalled, resulting in sideways trading with a slight downward trend. However, there is no immediate cause for concern since an underlying pressure is currently halting the decline.
At this point, we could expect a bullish flag pattern to emerge, which will be confirmed by the market's reaction to NVDA's results next Wednesday. The lower limit of the anticipated flag aligns with a 1x1 extension for wave (C). If the situation worsens and the flag is broken, it may transform into a zig-zag pattern, with extension targets for wave (C) indicated on the chart. Consider viewing this as an opportunity to enter a long position.
Power Grid Building Momentum for the Next Summit!This is the Daily Timeframe Chart of Power Grid Corporation of India.
The stock is forming a Bow & Tie pattern, indicating a potential trend reversal setup.
It has a strong support zone in the 258–22 range, while the resistance lies near the 285 And 300 level.
If the stock sustains above its support zone, we may witness higher price movement in Power Grid Corporation of India.
Thank you!

BITCOIN Weekly line charttells a story of 4 discernible patterns and 4 log targets.
1) The inverse head & shoulders to end the bear market
2) A broadening rising flag .... which at the time, many thought it was head and shoulder's top on the candle chart.
3) A small sideways flag
4) and the current frustrating broadening descending bull flag. Which has cause much grief to participants but will likely gives an explosive quick large moves.
As you can see putting the chart can help in identifying trends.. key highs and lows and also gives patterns that may not be visible on a candle chart.
Another tool in your toolbox.

Classic Flag Is it going to be the same or more up and down? Gold is currently testing this area. We'll see shortly with a break out.

Bearish Divergence on Bigger tf
CMP 105228.47 (02-06-2025)
Bearish Divergence on Bigger tf (Cautious
approach should be taken).
However, if 109350 is Crossed, we may
witness 115000 & then 120000 - 121000.
and if 112000 is crossed & sustained, be ready
to get New Highs :-)
Lets be more cautious & dig out 3 Important
Support Levels.
S1 around 103000 - 102500
S2 around 97800
S3 around 93400 - 93500.

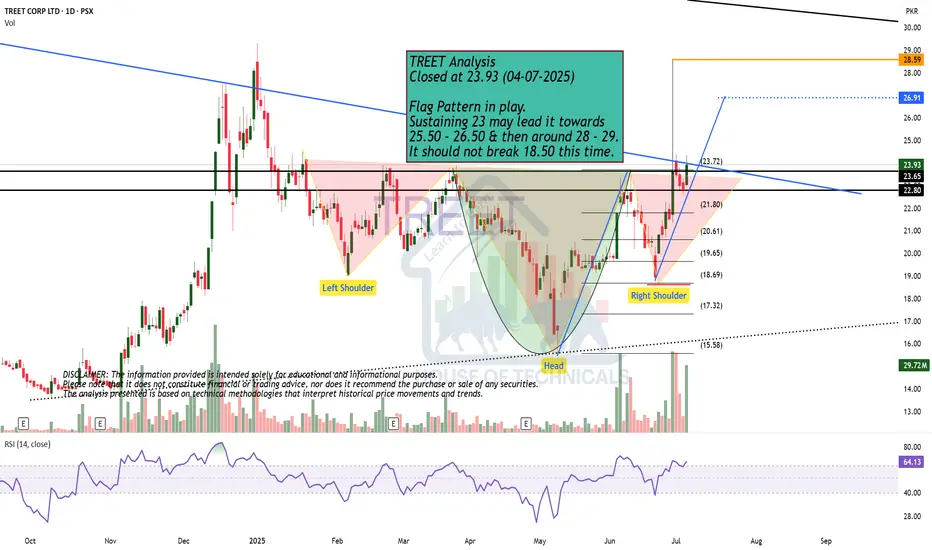
Flag Pattern in play. TREET Analysis
Closed at 23.93 (04-07-2025)
Flag Pattern in play.
Sustaining 23 may lead it towards
25.50 - 26.50 & then around 28 - 29.
It should not break 18.50 this time.
Gold (XAUUSD) Bullish Flag Breakout: Rally ContinuationThe precious metal Gold (XAUUSD) appears poised for a strong bullish continuation, as price action on the 1-hour timeframe reveals a classic Bullish Flag formation. This technical setup is a powerful trend continuation pattern that typically signals the resumption of an existing bullish trend following a period of consolidation.
Let’s break down the structure, targets, and trade strategy behind this pattern.
1. Formation of the Bullish Flag Pattern
After a sharp upside move from the 3580 zone, Gold entered a consolidation phase marked by a downward-sloping parallel channel—forming the “flag” after the “flagpole.” This structure is typical of a bull flag: strong impulse move (flagpole) followed by a corrective pullback within a channel (flag).
Flagpole height: From approximately 3580 to 3650, giving us a pole height of ~70 points.
Flag range: Price oscillated within a descending channel, respecting both upper resistance and lower support trendlines.
Support held strong near the 3580 level, which also acted as a base for the earlier rally.
2. Breakout Confirmation
As of now, the price is attempting a breakout above the flag’s upper boundary. If the breakout is sustained above 3650, this would confirm the bull flag pattern and could trigger aggressive buying interest.
3. Projected Upside Targets
Once the breakout is confirmed, the projected targets can be calculated by adding the flagpole height (~70 points) to the breakout point (~3650). Here are the levels to watch:
Target 1: 3672.67
Initial target post-breakout, suitable for short-term traders or partial booking.
Target 2: 3700.88
Mid-level resistance; a decisive close above this would fuel more momentum.
Projected Target: 3734.08
This is the full measured move based on the flagpole height and would mark a complete bullish continuation.
4. Trade Setup and Strategy
Traders can consider this a momentum continuation opportunity, with the following plan:
Entry: On confirmed breakout above 3650, preferably on a 1H candle close or retest.
Stop Loss: Below flag support zone, ideally below 3620 to avoid false breakouts.
Targets: 3672.67 / 3700.88 / 3734.08
Risk-Reward: Approx. 1:2.5 or higher, depending on entry zone and SL.
5. Risk Management and Caution
Always wait for confirmation before entering. Early breakouts without volume can reverse.
Avoid over-leveraging—flag breakouts sometimes retest before the real move starts.
Watch for macro events (especially U.S. CPI, NFP, FOMC), which can create volatility in gold.
Conclusion: Bullish Continuation on the Horizon
The technical structure in Gold supports a bullish continuation. The breakout from this bull flag pattern gives a clear, rule-based setup for intraday or swing traders. With defined targets and a logical stop-loss level, this is a high-probability trade setup, especially in a trending market.
If bulls hold the breakout zone, 3734+ could be seen in the coming sessions.

Gulf Oil Lubricants in BULLISH FLAG Gulf Oil Lubricants
Looks good for long term.
If reqd can start accumulating from current level and down till the mentioned level in the chart.
It is in Bullish Flag Pattern formation. On Breakout confirmation, big rally expected.
Good Dividend payer too

SUDARSHANCHEMSUDARSHANCHEM showing very good strength and consolidating since a month near ATH. Result is expected tomorrow on 25-Aug. If it declares bumper result then we may see next leg of steep rally. In recent time accumulation has been observed. Provided that if it closes above 1380 level then one may get very good risk-reward trade from hereon. Keep a stock in watch list. Just a small volume may push it above resistance line.

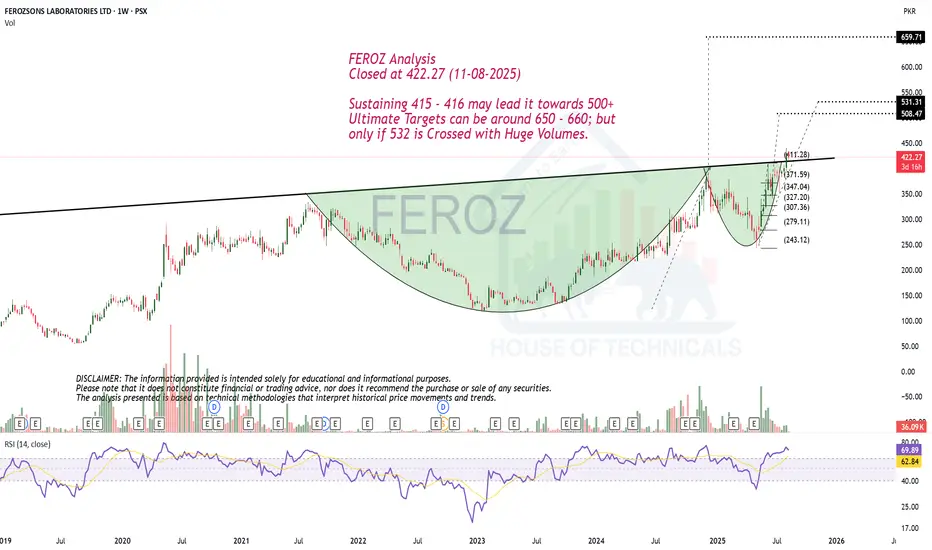
Beautiful Bullish PatternsFEROZ Analysis
Closed at 422.27 (11-08-2025)
Sustaining 415 - 416 may lead it towards 500+
Ultimate Targets can be around 650 - 660; but
only if 532 is Crossed with Huge Volumes.
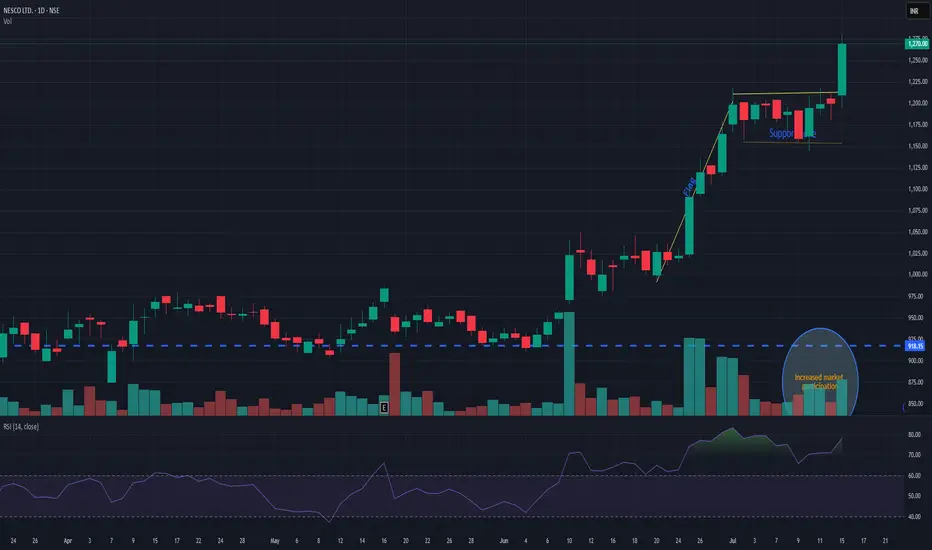
NESCONESCO giving flag pattern breakout with decent volume. Support is seen nr 1180. while pole initiation can be seen near 1010. Currently trading near 1270. It has a potential for new momentum. Keep it on radar.
SUNDARAM FINANCE Near at Support Zone | Keep an eye on it ||There are two charts of Sundaram Finance —on the Weekly timeframe and Daily timeframe.
On the weekly timeframe, the stock is moving within an ascending parallel channel, with the support zone between 4650-4550.
On the daily timeframe, the stock is moving within a descending channel, with the support boundary near 4600-4650.
If this level is sustain then we may see higher prices in SUNDARMFIN
Thank You...

QBTS massive weekly bull flagLots of eyes on quantum computing these days. Massive bull flag forming on the daily and weekly on QBTS which has already had a great run.
Another ticker with no resistance if/when the breakout occurs.

How to Spot Flag Patterns on TradingViewLearn to identify and trade flag patterns in TradingView with this step-by-step tutorial from Optimus Futures. Flag patterns are continuation formations that help traders join existing trends by buying high and selling higher, or selling low and buying back lower.
What You'll Learn:
• How to identify bullish and bearish flag patterns on any timeframe
• Breaking down flag patterns into two parts: the flagpole and the flag
• Finding strong flagpole formations with fast, obvious price moves
• Spotting flag consolidation areas that form tight ranges
• Why flag patterns work: buyer and seller psychology explained
• Real chart examples showing how flag patterns develop and play out
This tutorial may help futures traders and technical analysts who want to trade with market trends rather than against them. The concepts covered could assist you in identifying opportunities to join strong price movements when they pause before continuing.
Learn more about futures trading with Tradingview: optimusfutures.com
Disclaimer:
There is a substantial risk of loss in futures trading. Past performance is not indicative of future results. Please trade only with risk capital. We are not responsible for any third-party links, comments, or content shared on TradingView. Any opinions, links, or messages posted by users on TradingView do not represent our views or recommendations. Please exercise your own judgment and due diligence when engaging with any external content or user commentary.
This video represents the opinion of Optimus Futures and is intended for educational purposes only. Chart interpretations are presented solely to illustrate objective technical concepts and should not be viewed as predictive of future market behavior. In our opinion, charts are analytical tools—not forecasting instruments. Market conditions are constantly evolving, and all trading decisions should be made independently, with careful consideration of individual risk tolerance and financial objectives.

BTCUSDT at Best Resistance !!This is the Daily chart of Bitcoin .
BTCUSDT is trading near it Resistance Zone 108,600 - 107,400.
If this level is sustain , then we may see lower prices in BTCUSDT.
Thank You !!

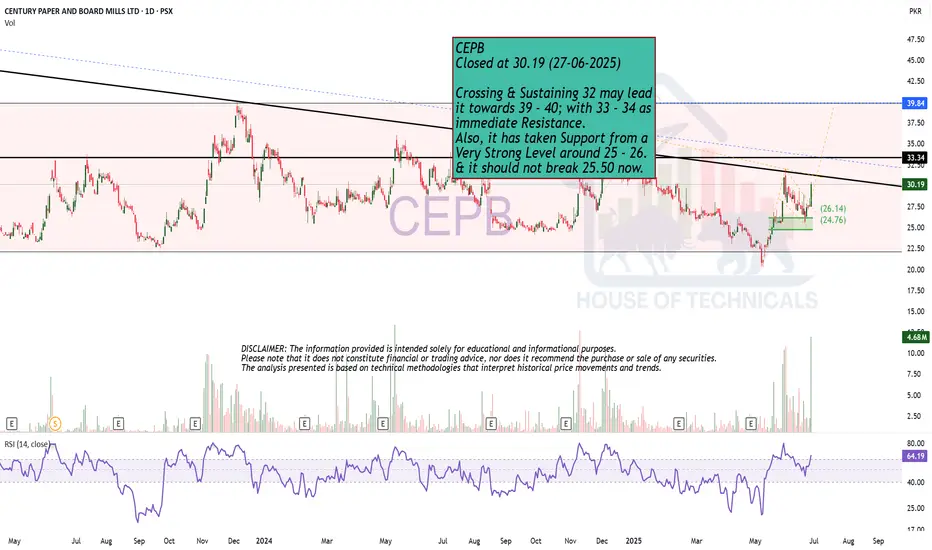
Bullish Flag!CEPB
Closed at 30.19 (27-06-2025)
Crossing & Sustaining 32 may lead
it towards 39 - 40; with 33 - 34 as
immediate Resistance.
Also, it has taken Support from a
Very Strong Level around 25 - 26.
& it should not break 25.50 now.