WHAT NEXT AFTER INDUSIND BANK CRASH?📉 IndusInd Bank’s Crash: What's Happening? 📉
Today’s massive drop in IndusInd Bank stock price has left investors stunned! The stock plummeted by over 22%, closing at ₹1,041.60, with a high at ₹1,694.50 earlier this year. With earnings missing estimates, reporting just ₹17 vs an expected ₹28.40 (a
Key facts today
Next report date
—
Report period
—
EPS estimate
—
Revenue estimate
—
104.75INR
89.77 BINR
551.47 BINR
636.55 M
About INDUSIND BANK LTD
Sector
Industry
CEO
Sumant Kathpalia
Website
Headquarters
Pune
Founded
1994
ISIN
INE095A01012
FIGI
BBG000BQD479
IndusInd Bank Ltd. engages in the provision of banking services. It operates through the following segments: Treasury, Corporate and Wholesale Banking, Retail Banking, Other Banking Operations and Unallocated. The Treasury segment refers to all investment portfolios, profit, loss on sale of investments; profit and loss on foreign exchange transactions, equities, income from derivatives and money market operations. The Corporate and Wholesale Banking segment includes lending to and deposits from corporate customers. The Retail Banking segment includes lending to and deposits from retail customers. The Other Banking Operations segment comprises all other operations not covered under other segment. The Unallocated segment includes capital and reserves, employee stock options outstanding and other unallocable assets, liabilities, income and expenses. The company was founded by Srichand P. Hinduja in January 31, 1994 and is headquartered in Mumbai, India.

Indusind Bank D-W-M-Q StatusBiggest ever, one day drop more than 15% in opening Trade Today, i have shared the 4 windows with support levels and RSI ,Volume , Ema ,SMA and more.

INDUSINDBK--@Near Its Demands??This stock broken the previous resistance at 1275 zone strongly,
now price is approching the same zone in a corrective manner after a long time,
we have a trendline liquidity lies above the 1500,1550 and 1579 areas.
A strong demand zone is observed at 1160 levels, these are the 2 buying zones in In

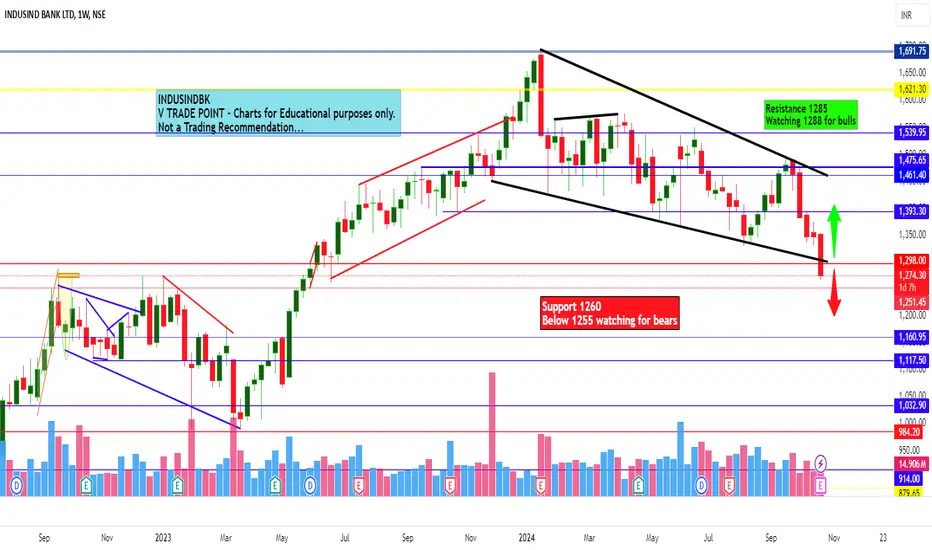
Indusnd Bank Ltd for Intraday 24th October #INDUSINDBK Indusnd Bank Ltd for Intraday 24th October #INDUSINDBK
Resistance 1285. Watching above 1288 for upside movement...
Support area 1260. Below ignoring upside momentum for intraday
Support 1260.Watching below 1255 for downside movement...
Resistance area 1285
Above ignoring downside move for intrada
Indusind Bank - Trendline SupportNSE:INDUSINDBK at major Trendline support in weekly Time Frame.
One can start accumulating slowly on seeing positive momentum from these levels. Medium term targets of Channel high can be achieved.

indusinbk buy for swing /positional
buy near 1370
avg at near 1340
sl 4% near 1315
tgt 4%8%12%16%18%
hold 4-6 week

Breakout from an inverse head & shoulders pattern on IndusindOn the daily timeframe, a breakout from an inverse head and shoulders pattern can be seen. RSI indicator also suggests a positive momentum which may help keep the trend positive in the near term.
A target of 1560 in the near term in achievable which is also a resistance. A stop loss of 1450 should

INDUSIND BANK Next Leves UpsideINDUSIND BANK seems to be moderately bullish for the next couple of months

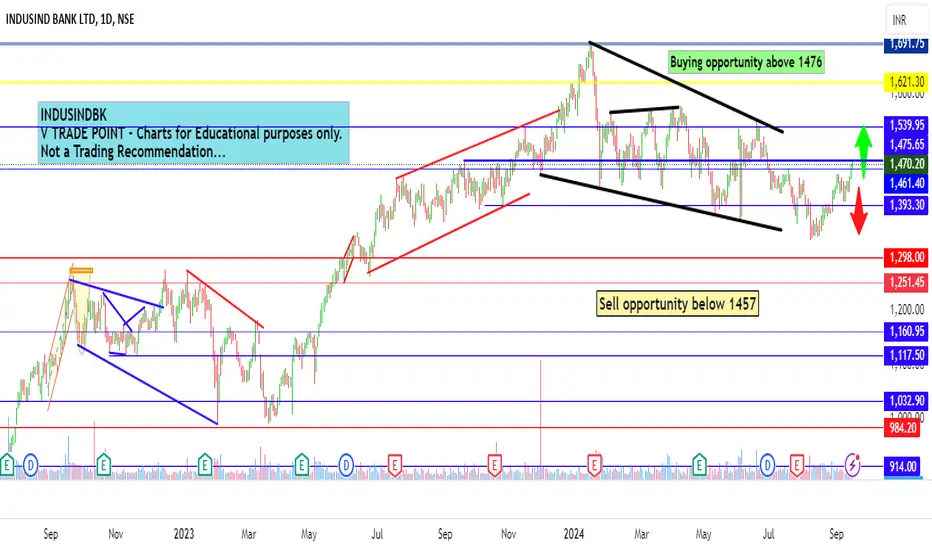
Indusnd Bank Ltd view for Intraday 17th September #INDUSINDBK Indusnd Bank Ltd view for Intraday 17th September #INDUSINDBK
Buying may witness above 1476
Support area 1457. Below ignoring buying momentum for intraday
Selling may witness below 1457
Resistance area 1476
Above ignoring selling momentum for intraday
Charts for Educational purposes only.
Please

See all ideas
An aggregate view of professional's ratings.
Displays a symbol's price movements over previous years to identify recurring trends.
Frequently Asked Questions
The current price of INDUSINDBK is 1,041.60 INR — it has decreased by −18.63% in the past 24 hours. Watch INDUSIND BANK LTD stock price performance more closely on the chart.
Depending on the exchange, the stock ticker may vary. For instance, on NSE exchange INDUSIND BANK LTD stocks are traded under the ticker INDUSINDBK.
INDUSINDBK stock has fallen by −22.56% compared to the previous week, the month change is a −28.17% fall, over the last year INDUSIND BANK LTD has showed a −26.27% decrease.
We've gathered analysts' opinions on INDUSIND BANK LTD future price: according to them, INDUSINDBK price has a max estimate of 1,825.00 INR and a min estimate of 1,200.00 INR. Watch INDUSINDBK chart and read a more detailed INDUSIND BANK LTD stock forecast: see what analysts think of INDUSIND BANK LTD and suggest that you do with its stocks.
INDUSINDBK reached its all-time high on Aug 3, 2018 with the price of 2,038.00 INR, and its all-time low was 8.50 INR and was reached on Sep 18, 2001. View more price dynamics on INDUSINDBK chart.
See other stocks reaching their highest and lowest prices.
See other stocks reaching their highest and lowest prices.
INDUSINDBK stock is 24.82% volatile and has beta coefficient of 1.47. Track INDUSIND BANK LTD stock price on the chart and check out the list of the most volatile stocks — is INDUSIND BANK LTD there?
Today INDUSIND BANK LTD has the market capitalization of 811.36 B, it has decreased by −1.75% over the last week.
Yes, you can track INDUSIND BANK LTD financials in yearly and quarterly reports right on TradingView.
INDUSIND BANK LTD is going to release the next earnings report on Jan 15, 2025. Keep track of upcoming events with our Earnings Calendar.
INDUSINDBK earnings for the last quarter are 17.00 INR per share, whereas the estimation was 28.40 INR resulting in a −40.14% surprise. The estimated earnings for the next quarter are 22.96 INR per share. See more details about INDUSIND BANK LTD earnings.
INDUSIND BANK LTD revenue for the last quarter amounts to 75.31 B INR, despite the estimated figure of 67.65 B INR. In the next quarter, revenue is expected to reach 78.57 B INR.
INDUSINDBK net income for the last quarter is 13.31 B INR, while the quarter before that showed 21.71 B INR of net income which accounts for −38.67% change. Track more INDUSIND BANK LTD financial stats to get the full picture.
Yes, INDUSINDBK dividends are paid annually. The last dividend per share was 16.50 INR. As of today, Dividend Yield (TTM)% is 1.58%. Tracking INDUSIND BANK LTD dividends might help you take more informed decisions.
INDUSIND BANK LTD dividend yield was 1.06% in 2023, and payout ratio reached 14.28%. The year before the numbers were 1.31% and 14.58% correspondingly. See high-dividend stocks and find more opportunities for your portfolio.
As of Oct 27, 2024, the company has 45.64 K employees. See our rating of the largest employees — is INDUSIND BANK LTD on this list?
Like other stocks, INDUSINDBK shares are traded on stock exchanges, e.g. Nasdaq, Nyse, Euronext, and the easiest way to buy them is through an online stock broker. To do this, you need to open an account and follow a broker's procedures, then start trading. You can trade INDUSIND BANK LTD stock right from TradingView charts — choose your broker and connect to your account.
Investing in stocks requires a comprehensive research: you should carefully study all the available data, e.g. company's financials, related news, and its technical analysis. So INDUSIND BANK LTD technincal analysis shows the strong sell today, and its 1 week rating is strong sell. Since market conditions are prone to changes, it's worth looking a bit further into the future — according to the 1 month rating INDUSIND BANK LTD stock shows the sell signal. See more of INDUSIND BANK LTD technicals for a more comprehensive analysis.
If you're still not sure, try looking for inspiration in our curated watchlists.
If you're still not sure, try looking for inspiration in our curated watchlists.