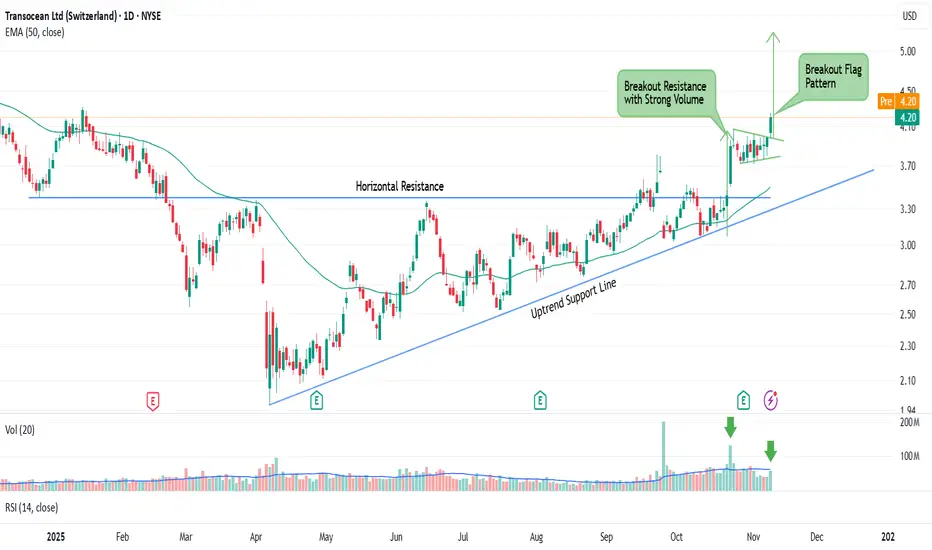
Transocean Ltd (RIG) – Bullish BreakoutSummary:
RIG has broken out of long consolidation and strong resistance at 3.40 with high volume , showing strong buyer interest.
After the breakout, price pulled back and formed a flag pattern , then broke out again yesterday , confirming bullish continuation .
Trading Plan:
Entry: 4.20
Support: 3.72
Target: 5.20
Flag
$WLFI 4H$WLFI 4H Analysis
A clear Bull Flag formation is developing after a strong impulsive move +35%.
The price is consolidating inside a descending channel, showing a healthy correction before the next potential leg up.
Breakout Zone: $0.156–$0.158
T1: $0.1762
T2: $0.1862
T3: $0.1950
Invalidation: Below $0.1483 (break of flag support)
If the breakout confirms with volume, we could see continuation toward the $0.19–$0.20 area, completing the flag projection.
#WLFI #BullFlag #Altcoins #WorldLibertyFi


GBPJPY | Flag Breakout in Focus – Eyeing 207.00–209.00Technical Lens:
GBPJPY continues to trade within a well-defined ascending channel, with recent consolidation forming a clean flag pattern following the prior impulsive advance. Price is now pressing against the upper boundary of that flag near 204.00, hinting that momentum may be building for a breakout.
Scenarios:
If price breaks above the flag resistance and confirms, the next technical targets sit around 207.00–209.00 — aligning with the upper bound of the broader channel and key Fibonacci projections.
If rejection occurs at current levels, a pullback toward 201.50–202.00 could see the lower flag boundary retested before any continuation attempt.
Takeaway:
GBPJPY remains in a constructive structure within its ascending channel. A confirmed breakout above the flag could see the pair extend toward 207.00–209.00, where the next resistance cluster awaits.

Bitcoin Recovery Setup: BTC Price Rebound Signal & Trade IdeaHey traders.
Short update for BTC and next movement.
Basically we moving in the bullish flag and according to some signals most-likely we going to see BTC going to the top of this channel.
Few reasons:
1) RSI crossed and confirmed (red circle marked)
2) Recovery of the whole market
Points to watch:
1) Low volumes - seems like we not going to break much this flag range (be careful)
2) Money can flow to altcoins - so BTC going to flat
If you want to trade, set up TP at the price around orange line and follow RM.
Share your insights in the comments

20% upside trade idea1) price channel
2) higher highs , higher lows on lower timefram
3) more volumes on up candles , less volumes of down candles .
4) out of horizontal consolidation
5) cup and handle type of appearance on diff timeframes.
keeping it short and sweet .. may be you can envision this
thanking you

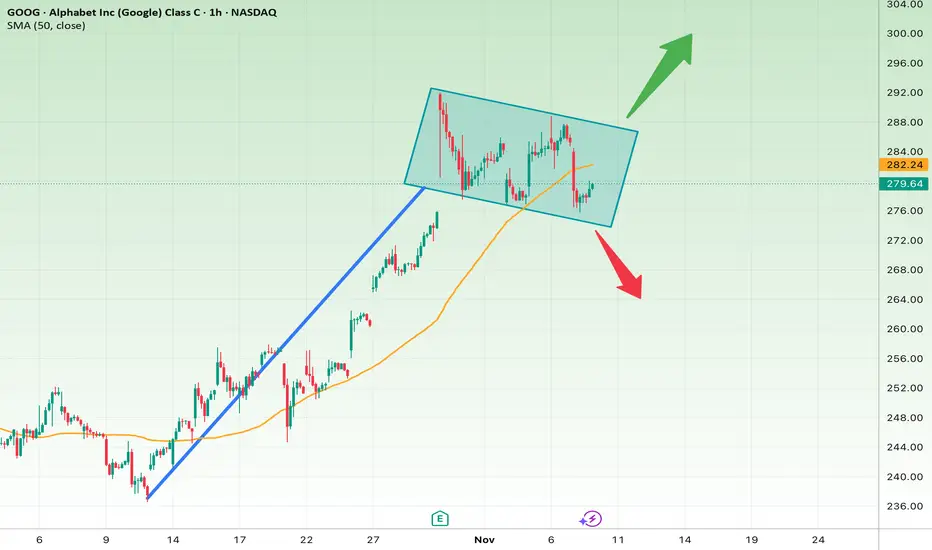
Google at a Critical Decision Point
Short-Term Analysis (1–7 days):
• The stock has entered a neutral channel, currently oscillating between $276 and $288.
• A breakout above the channel’s upper boundary would indicate a continuation of the short-term uptrend.
• Short-term upside target: around $295
• Short-term stop-loss: below $275
Long-Term Analysis (weeks to months):
• The long-term trend remains bullish, with the 50-hour moving average providing support.
• If the neutral channel breaks upward, a strong continuation toward around $310 is possible.
• If it breaks downward, a decline toward $265 is likely.
Summary:
Google stock is in a key decision-making range. Close monitoring is required in the short term, as a breakout from the channel will determine the long-term direction.
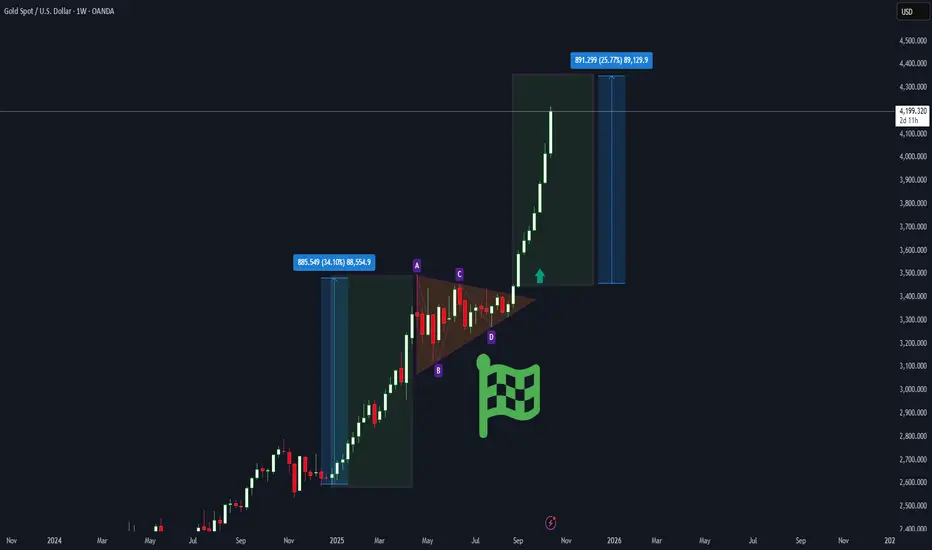
Gold Breakout Confirmed! | Bullish Flag Pattern Target AheadThe Bullish Flag pattern on Gold’s weekly chart just broke out with strong momentum ✅
After a 34% rally, Gold consolidated into a symmetrical triangle and has now continued its upward leg.
If price holds above $4,100, the next technical target could reach around $4,400+.
💡 Educational Tip:
The Bullish Flag is one of the most reliable continuation patterns — when confirmed with strong volume and weekly close above resistance, it often signals the next major impulse wave in an uptrend.
#Gold #XAUUSD #TradingView #TechnicalAnalysis #BullishFlag #PriceAction #Breakout #Forex #Commodities #SmartMoney #ElliottWave #ChartPattern #GoldAnalysis #TradeWithMy
AZN | Bull Flag Forming on This Drug Stock | LONGAstraZeneca Plc is a holding company, which engages in the research, development, manufacture, and commercialization of prescription medicines. The company's history roots back to the year 1913 when Astra business was formed. AstraZeneca was founded in 1999 through the merger of Astra AB and Zeneca Group PLC. The company is headquartered in Cambridge, the United Kingdom.

TJX | Possible Break Out Incoming | LONGThe TJX Cos., Inc. engages in the retail of apparel and home fashion products. It operates through the following business segments: Marmaxx, HomeGoods, TJX Canada, and TJX International. The Marmaxx segment sells family apparel including apparel, home fashions, and other merchandise. The HomeGoods segment offers an assortment of home fashions, including furniture, rugs, lighting, soft home, decorative accessories, tabletop and cookware as well as expanded pet, kids, and gourmet food departments. The TJX Canada segment operates the Winners, Marshalls, and HomeSense chains in Canada. The TJX International segment includes operations of T.K. Maxx and Homesense chains in Europe and the T.K. Maxx chain in Australia. The company was founded by Bernard Cammarata in 1962 and is headquartered in Framingham, MA.

BTI | Expect More Smokers in a Recession | LONGBritish American Tobacco plc is a holding company, which engages in the manufacture and distribution of tobacco products. Its brands include Kent, Dunhill, Lucky Strike, and Pall Mall. It operates through the following geographical segments: United States, Asia-Pacific and Middle East (APME), Americas and Sub-Saharan Africa (AMSSA), and Europe and North Africa (ENA). The APME geographical segment consists of markets in the Middle East merged with Asia-Pacific. The AMSSA geographical segment is composed of markets in East and Central Africa, West Africa, and Southern Africa merged with the Americas region. The ENA geographical segment includes markets in Russia, Ukraine, Caucasus, Central Asia, Belarus, Turkey, and North Africa merged with the Western Europe region. The company was founded by James Buchanan Duke on September 29, 1902 and is headquartered in London, the United Kingdom.

Gold may hit a 5k mark soon!On the daily chart, Gold has formed a bullish flag that can lead to a 5k mark soon. RSI shows no divergence while candles are forming a perfect flag that seems about to break on a bullish trend.

Kohinoor Industries Limited (KOIL in PSX), Bullish Rally!Based on the Daily analysis of Kohinoor Industries Limited (KOIL in PSX), it's forming a Pole & Flag bullish continuation, and it can reach around 150 (currently at 60).
Fundamentals are also strong, making it a suitable choice for long-term investors as well.
For swing traders, the current Etry Price is at 60ish, with SL at 42 and TP at 107 with 1:3 RRR.

A chance to grab 1:3 RRR!In one hour chart, we've:
Bullish divergence.
Break the neckline in a Bullish trend.
Williams Alligator mouth wide open, confirming bullish trend.
Pole & Flag forming with retracement as a sign of continuation bullish pattern.
Dollar Index is Bearish (1H)
Euro Index is Bullish (1H)
All the above indicators are making it a good bullish ride with a 1:3 RRR with an entry at around 1.154, SL at 1.152, and TP at around 1.16.
Note: It is always advisable to have your own analysis before executing any live trade!
All the best...


Lemonade Inc.: Breakout in Motion — Cup, Flag, and No BrakesLemonade Inc. (LMND) is accelerating after a clean breakout from a textbook cup with handle pattern, where the handle formed as a tight bullish flag. The breakout occurred around $32, and since then, price action has been sharp, controlled, and uncorrected — currently trading at $42.42 with buyers clearly in charge.
On the fundamental side, LMND is moving through a recovery phase: operational losses are narrowing, revenue is stabilizing, and the company is aggressively leveraging AI to automate its insurance processes. Expansion into Europe continues, and institutional interest is visibly rising — confirmed by volume building alongside price. Within the insuretech sector, LMND is starting to look like a comeback story rather than a cautionary tale.
Technically, the setup remains strong:
– Golden Cross confirmed (EMA50 crossing EMA200)
– EMA50/100/200 all below price — bullish structure firmly intact
– Volume expanding on up-days — healthy confirmation
– RSI hovering in the 60–65 range — momentum is intact, no signs of exhaustion
Targets remain aligned with the structure:
– tp1 = $64 — measured move from the flag
– tp2 = $94 — full realization of the cup pattern
Tactically, this is no longer a “wait and see” setup — the move is in progress. No correction so far, only continuation. Momentum traders may consider entries into strength. Above $45, the move could accelerate further as more participants recognize the structure.
LMND is showing technical and fundamental alignment — confirmed breakout, improving narrative, and strong trend structure. While the impulse holds, this chart favors continuation, not hesitation.

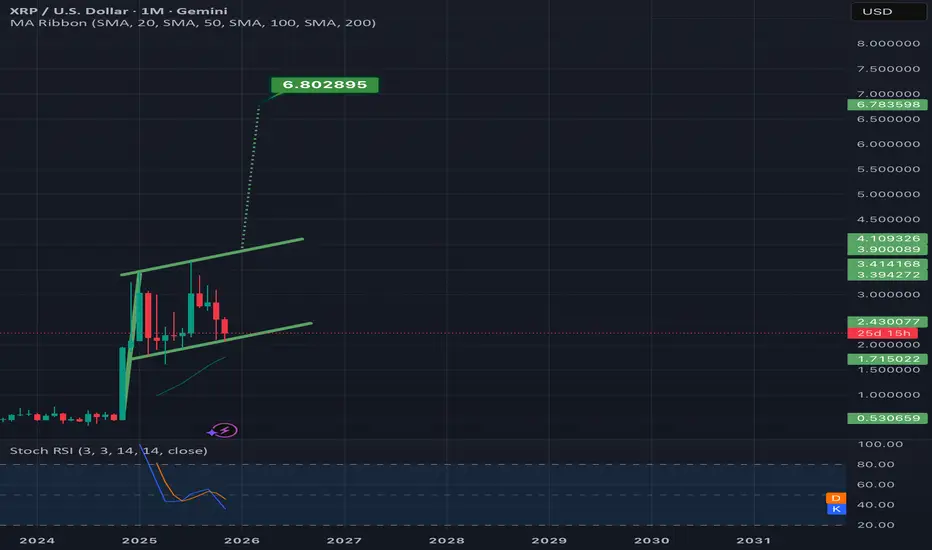
Bullflag on xrp has a target of $6.80 if it validates n DecemberWill be a very good sign if it finds a way to hold this bottom trendline as support.Even if it does hold support a wick below it is still very possible. *not financial advice*
$ASTER 1HSEED_WANDERIN_JIMZIP900:ASTER 1H Analysis
After a strong impulse move, price is consolidating within a bullish pennant, forming just above the 1h Fair Value Gap (FVG).
As long as RUS:ASTR holds above the $1.10 support, the structure remains constructive for continuation.
A breakout from this pennant could trigger another leg higher toward the $1.40–$1.50 area.
Momentum indicators still support the bullish scenario, suggesting buyers remain in control.

$ASTER 4HSEED_WANDERIN_JIMZIP900:ASTER 4H Analysis
After forming a clean Cup & Handle pattern, price has been consolidating within a descending triangle near the $1 zone.
Momentum indicators show a bullish divergence, suggesting potential reversal.
A confirmed breakout above the descending trendline could trigger the next bullish leg toward $1.30–$1.50.
Failure to hold the $0.95–$1.00 support range would invalidate the short-term bullish setup.
Pattern remains constructive as long as the base holds.

$ICPCRYPTOCAP:ICP 1H Chart Analysis
Price is forming a bullish pennant after a strong impulsive move (flag pole uptrend).
Currently consolidating just below resistance — a potential breakout setup is building.
Plan:
Entry: On breakout confirmation above trendline
Target 1: ~$5.55
Target 2: ~$6.60
FVG (1H) below acts as a key support zone
Momentum remains bullish unless price drops back into the FVG zone.
Clean structure for continuation if breakout holds.
#ICP #Crypto #Trading #InternetComputer #0xCryptoYodaX


GBPAUD A perfect Bearish Flag A bearish flag is a technical analysis pattern in trading that indicates a potential continuation of a downtrend. It's characterized by:
Key Features1. Downtrend: A prior downward trend in price.
2. Flag formation: A consolidation period with a slight upward trend, forming a flag shape.
3. Volume: Typically, volume decreases during the flag formation.
Interpretation1. Bearish signal: The bearish flag suggests the downtrend is likely to continue.
2. Breakout: A break below the flag's support level can confirm the continuation of the downtrend.
Trading Strategies1. Short selling: Traders may consider short selling after a break below the flag's support level.
2. Stop-loss: Setting a stop-loss above the flag's resistance level can help limit losses.
Important Notes1. Confirmation: Wait for confirmation of the breakout before entering a trade.
2. Risk management: Always use proper risk management techniques.
⚠️ Disclaimer:
This setup is shared for educational purposes only. It is not financial advice. Always do your own analysis and apply proper risk management before trading any setup.
