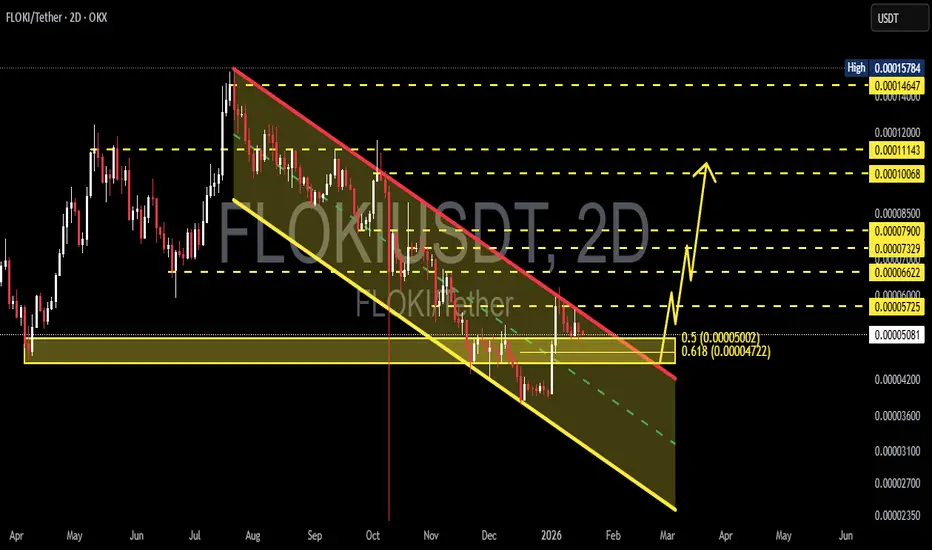
FLOKI/USDT at Demand Zone – Reversal or Breakdown Incoming?FLOKI/USDT on the 2D timeframe is still in a medium–long term correction phase after failing to hold its previous peak. Price is moving inside a clearly defined descending channel, indicating that selling pressure remains dominant.
However, price is now entering a historical demand zone (yellow box 0.00005 – 0.000045), which previously acted as a strong buyer reaction area.
This area is very critical because it aligns with:
The lower boundary of the descending channel
Major horizontal support
A previous bullish impulse reaction zone
---
Pattern Formation
Descending Channel (Bearish Continuation / Potential Reversal Pattern)
Price continues to form consistent lower highs and lower lows
The channel remains valid until a confirmed breakout above the upper red trendline occurs
The longer price holds near the channel base and demand zone, the higher the probability of a reversal
Additionally, price compression is visible near the lower part of the channel, which often precedes an impulsive move.
---
Key Levels
Support & Demand Zone
0.00005 – 0.000045 (yellow box – primary demand and reaction area)
Gradual Resistance Levels
0.000057
0.000066
0.000073
0.000079
0.000100
0.000111
0.000146 (major resistance / previous high)
---
Bullish Scenario
A bullish scenario is valid if:
Price holds above 0.00005
A strong breakout and close above the upper descending trendline (red) occurs
If a valid breakout happens:
FLOKI may begin a medium-term trend reversal
Potential upside targets:
0.000066
0.000079
0.000100
0.000111
Extreme target: 0.000146
This structure reflects a demand-based reversal combined with a pattern breakout, often followed by an impulsive rally.
---
Bearish Scenario
The bearish scenario becomes active if:
Price closes decisively below 0.000045
The demand zone fails to absorb selling pressure
Consequences:
The descending channel remains intact
Further downside continuation toward:
Lower channel liquidity areas
The next psychological support below the current structure
As long as price remains below the red trendline, the overall bias stays bearish to neutral.
---
Conclusion
FLOKI is currently trading at a major decision zone.
Holding demand = potential reversal
Breaking demand = continuation of the downtrend
The 0.00005 – 0.000045 zone is not ideal for panic selling, but also not yet a confirmation for aggressive buying until a breakout is confirmed.
#FLOKI #FLOKIUSDT #CryptoAnalysis #Altcoin #Memecoin #DescendingChannel #DemandZone #SupportResistance #TrendReversal #TechnicalAnalysis
Floki
#FLOKI/USDT – Trading Signal & Technical Analysis#FLOKI
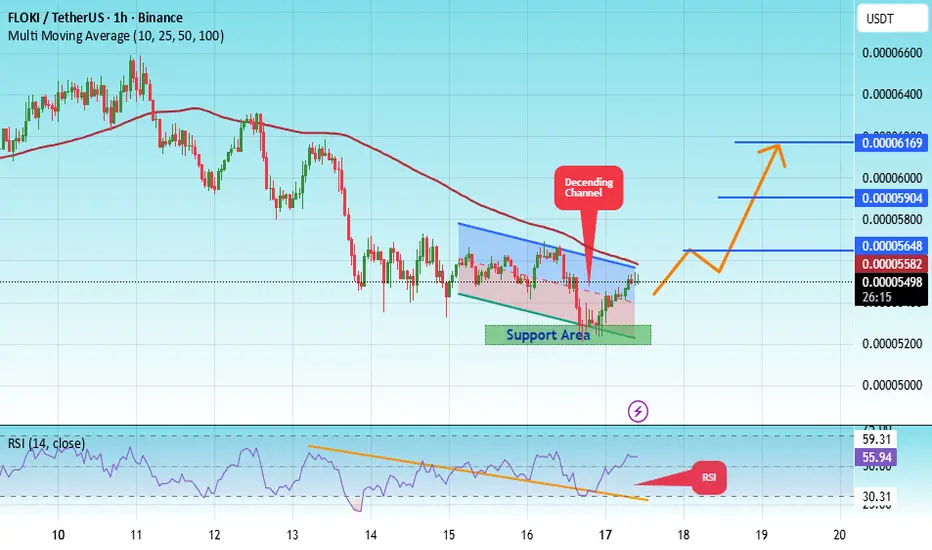
The price is moving within an ascending channel on the 1-hour timeframe and is adhering to it well. It is poised to break out strongly and retest the channel.
We have a downtrend line on the RSI indicator that is about to break and retest, which supports the upward move.
There is a key support zone in green at 0.00005200, representing a strong support point.
We have a trend of consolidation above the 100-period moving average.
Entry price: 0.00005500
First target: 0.00006450
Second target: 0.0005904
Third target: 0.00006170
Don't forget a simple money management rule.
Place your stop-loss order below the green support zone.
Once you reach the first target, save some money and then change your stop-loss order to an entry order.
For any questions, please leave a comment.
Thank you.
FLOKI/USDT – Big Rebound or Structural Breakdown?Timeframe: 5 Day
Market Condition: After a strong parabolic rally, FLOKI has entered a macro correction and distribution phase
Price is currently trading at a critical decision zone that will determine whether the macro bullish trend continues or shifts into a bearish structure
---
🟨 Key Support Zone (Yellow Block)
0.0000335 – 0.0000270
This zone represents:
Strong historical demand area
Previous accumulation base before a major impulsive move
High-probability buyer reaction zone
The last line of defense for long-term bullish structure
As long as price holds above this zone, FLOKI remains structurally bullish on a macro scale.
---
📐 Market Structure & Pattern Analysis
🔹 1. Market Structure
Formation of Lower Highs (LH) and Lower Lows (LL) → short-to-mid term downtrend
However, no confirmed major support breakdown yet
This move is still classified as a deep correction within a larger bullish cycle
---
🔹 2. Supply & Resistance Zones (Dashed Yellow Lines)
Key resistance levels:
0.0000730
0.0001125
0.0001380
These zones act as:
Major supply areas
Former support turned resistance
Potential distribution zones if price fails to break above them
---
🔹 3. Price Action Pattern
Current structure suggests:
Descending structure / falling channel
Potential development into:
Double Bottom (Bullish Reversal)
or Bearish Continuation Breakdown
Confirmation depends heavily on price reaction at the key support zone.
---
🟢 Bullish Scenario (Primary Reversal Setup)
Key conditions:
Strong rejection and sustained price action above 0.0000335 – 0.0000270
Presence of bullish candles with long lower wicks or impulsive moves
Bullish progression:
1. Strong rebound from key support
2. Formation of Higher Low (HL)
3. Break of minor structure
4. Upside targets:
🎯 0.0000730
🎯 0.0001125
🎯 0.0001380
📈 Bias: Buy on confirmation and reaction, not blind entries.
---
🔴 Bearish Scenario (Structural Breakdown)
Key conditions:
Strong 5D candle close below 0.0000270
Lack of meaningful buyer rejection
Implications:
Macro bullish structure becomes invalid
Previous support flips into resistance
Potential continuation toward:
0.0000200
Or a full retest of previous macro lows
📉 Bias: Breakdown favors trend continuation to the downside.
---
🧠 Technical Conclusion
FLOKI is currently sitting at a macro decision zone
The yellow support block is the critical level
Price reaction here will define:
🔄 Major bullish reversal
or ⛔ Extended bearish continuation
> “It’s not about predicting direction, it’s about reacting to confirmation at key levels.”
---
⚠️ Risk Management Note
Wait for candle confirmation
Avoid emotional entries
Always apply proper risk management
---
#FLOKI #FLOKIUSDT #CryptoAnalysis
#TechnicalAnalysis #PriceAction
#SupportResistance #Altcoins
#BullishScenario #BearishScenario
#TradingView #CryptoTrading
#MarketStructure #SupplyDemand

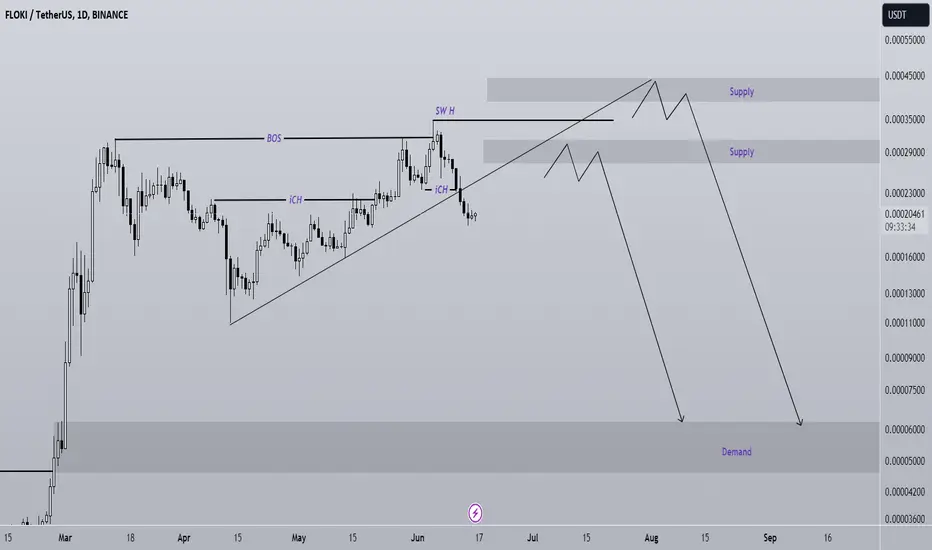
FLOKI analysisAfter the bearish iCH in the internal structure, the price has created an internal pullback.
A trend line has also been broken, but the bullish momentum is very high. FLOKI's bearish trend is expected to be created from one of the two specified supplies.
By maintaining the resistance swap range, it can drop towards the targets.
The target can be demand at the bottom of the chart
Note that the financial market is risky, so:
Do not enter any position without confirmation and trigger.
Do not enter a position without setting a stop.
Do not enter a position without capital management.
When we reach the first TP, save some profit and try to move the stop continuously in the direction of your profit.
If you have any comments please post them, comments will help us improve our performance
Thanks
FLOKI : BUY MARKETHello friends
According to the technical analysis carried out, we can say that with the entry of buyers, it is possible to enter into a transaction with risk and capital management and move towards the specified goals.
*Trade safely with us*

Floki price analysis🚀 Elon Musk is back to his old tricks!
With one tweet — he pumped #FLOKI 🐶 again.
⚠️ The bad: pure manipulation, nothing good for the market long term.
✅ The good: Elon clearly feels that this is the “window of opportunity” when just one sentence can spark a +30–50% pump 😏
📊 On the global OKX:FLOKIUSDT chart, the price has been moving in a huge channel for nearly two years.
Now it’s right in the middle zone.
✅ To confirm strength, buyers must break above the midpoint and secure a hold in the upper half of the range.
❌ Otherwise — expect a pullback to the launch rocket zone, or even lower.
🤔 What do you think — another hype tweet, or the start of a new memecoin season?
______________
◆ Follow us ❤️ for daily crypto insights & updates!
🚀 Don’t miss out on important market moves
🧠 DYOR | This is not financial advice, just thinking out loud

$Floki Vikings are getting ready.Floki is positioned on the lower band of the major ascending channel on the 2W timeframe, a strong support line.
This same level overlaps the middle band of the descending channel, creating a technical double support area.
Retest period following the breakout observed on the RSI is nearing completion. This structure indicates that the overall upward trend remains valid and that the pair may be preparing for a new acceleration.
It's beneficial to focus on the bigger picture without being distracted by short term fluctuations.
Technically, Floki is still trading within an uptrend.

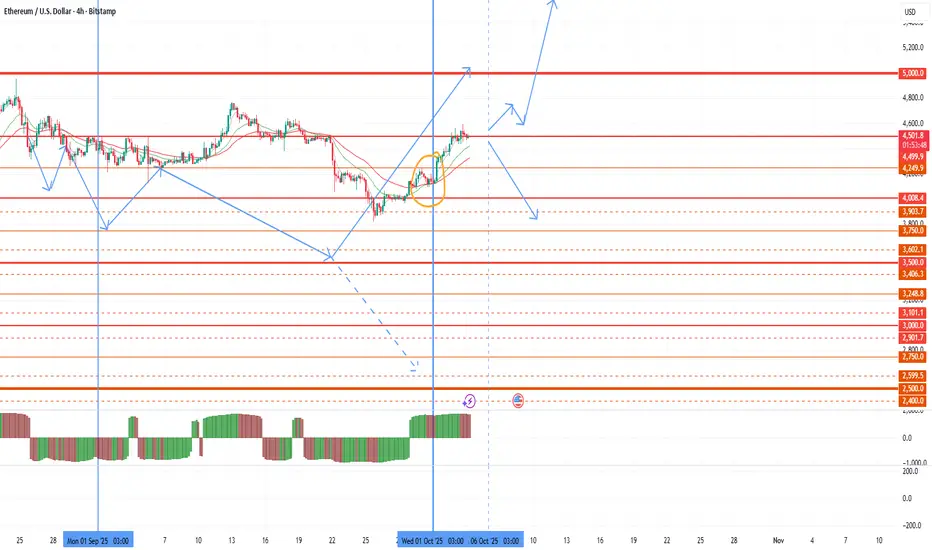
A dangerous market on the swing of a new quarterSeptember ended, a month of seasonal sales and 4 weeks of sluggish market decline, which I predicted in the last review. October and December are the months of seasonal growth in the 4th quarter, but the bears continue to hold the market. The quarter opened neutrally on the ETH. An opening above 4100 provides an opportunity for retests of 4750-5000, however, an opening below 4250 is a slightly stronger signal for a stable consolidation below 4k and an attempt to retest 3500. The current market growth is still only a retest of the 4500-4750 range before the likely continuation of sales. It will be possible to talk about the continuation of medium-term growth only with a repeated breakdown of 4750, in which case active purchases of altcoins will begin. With the current market, the probability of a further flat and a slow fall for most coins prevails. Bitcoin opened the quarter below 115k, which further increases the likelihood of a market drop with sales up to a 90-100 k retest.
The oil price also continues to fall, which negatively affects the markets. If there is a rebound in brent to $67.5-$69 in the new week, then the probability of a breakdown of $ 4750 in ether will begin to prevail. If brent falls below 64, there will be a chance of a hike to 3900 on the ETH by the end of next week.
Today, the opening level of the new week on the ETH is of great importance. When opening above 4500, the probability of a breakdown of 4750 will increase significantly and we will not see sales below 4250-350. When opening below 4500, a breakdown of 4750 will be possible only against the background of weighty arguments, extremely negative statistics on the United States or oil growth.
With the current negative market and the prevailing probability of further altcoin decline, I am still cautiously considering coins for operation. The only oversold group with the probability of growth from its current position is still the fantokens. Among them, I am considering atm city juv acm for work. These tokens do not have binance futures, which reduces the opportunities for large speculators to sell and insures against a pattern similar to alpine and asr. These tokens also have extremely high undeveloped targets on large timeframes up to 5-7 x.
ATM opened the quarter above 1.5, which is a very positive signal. After drawing the shadow on a new monthly candle with a retest of 1.35, there is a high probability of a bullish reversal of the current monthly candle with a stable approach to the 2.1-2.5 test at least. In the event of a breakdown of 2.5, further growth towards 5-7.5 will be very active. With a negative market and ether falling to 3500, there is a possibility of a delay and flat ATM with a rebound from 2.1 and growth from the second half of the quarter.
According to CITY, there is also a good quarter opening above 1.0, which can lead to stable growth on the 2.1-2.5 test this month with a further trend.
For ACM and JUV, there is also a good opening of the quarter above the supports, but the candlestick pattern on large timeframes is more negative, and therefore growth may be more sluggish after the breakouts of ATM and CITY.
Among other altcoins, so far I am considering only chess pivx and fio, which can give an increase of up to 50-70% from current levels against the background of the lack of assignment of the monitoring tag in the first week of the new month. However, the opening of the quarter for them is quite negative, which is likely to lead to new price drawdowns, especially in the event of a drop in ether. In work, it is worth keeping a moderate position with the expectation of possible drawdowns to 0.100-115 for pivx, 0.05 for chess and 0.0125-150 for fio. Topping up can be confidently done from these levels, a hike below is possible only if the monitoring tag is assigned in the following months, or there is a strong drop in ether up to 2500.
I will consider other coins to work only after the breakdown of 4750 on ether.

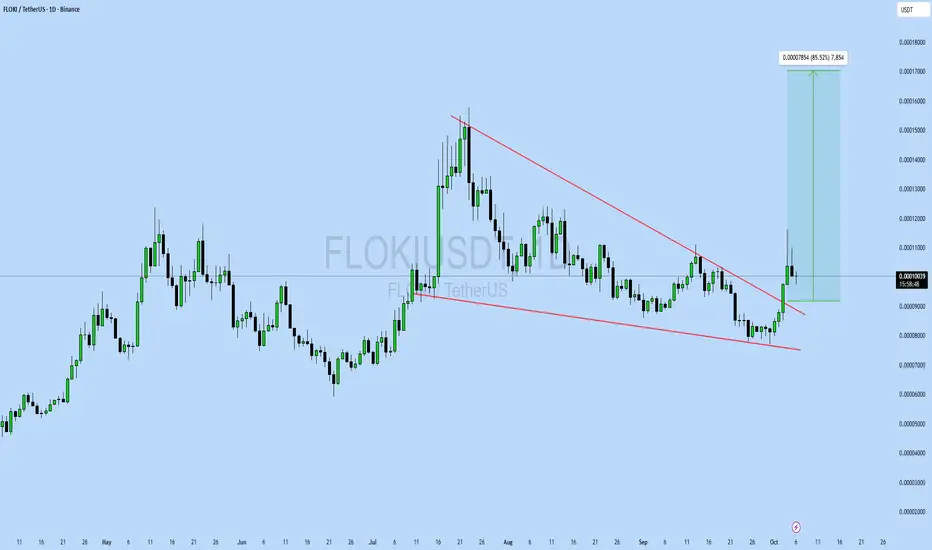
FLOKIUSDT UPDATE#FLOKI
UPDATE
FLOKI Technical Setup
Pattern: Bullish falling wedge pattern
Current Price: $0.00014
Target Price: $0.00026
Target % Gain: 85.27%
SEED_DONKEYDAN_MARKET_CAP:FLOKI is breaking out of a falling wedge pattern on the 1D timeframe. Current price is $0.00014 with a target near $0.00026, showing about 85% potential upside. The breakout confirms strong bullish momentum with structure supporting continued upward movement. Always use proper risk management.
Time Frame: 1D
Risk Management Tip: Always use proper risk management.
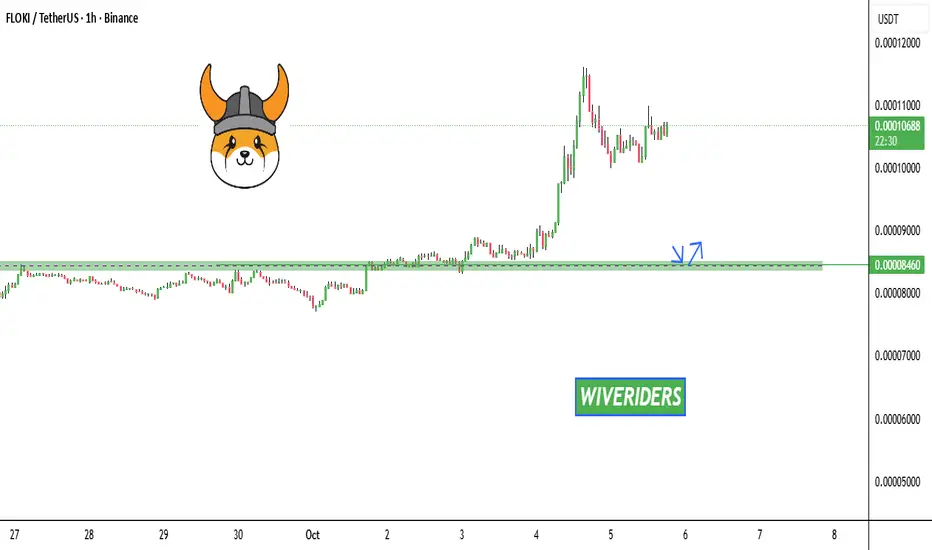
FLOKI Update📊 FLOKI Update
FLOKI is currently in an uptrend 🔥
If you’re planning to accumulate more or enter a new position, don’t rush —
💡 Wait for the price to retrace to the green zone (support area) and look for confirmation before entering long.
✅ Trade smart, not blind — patience = profits.
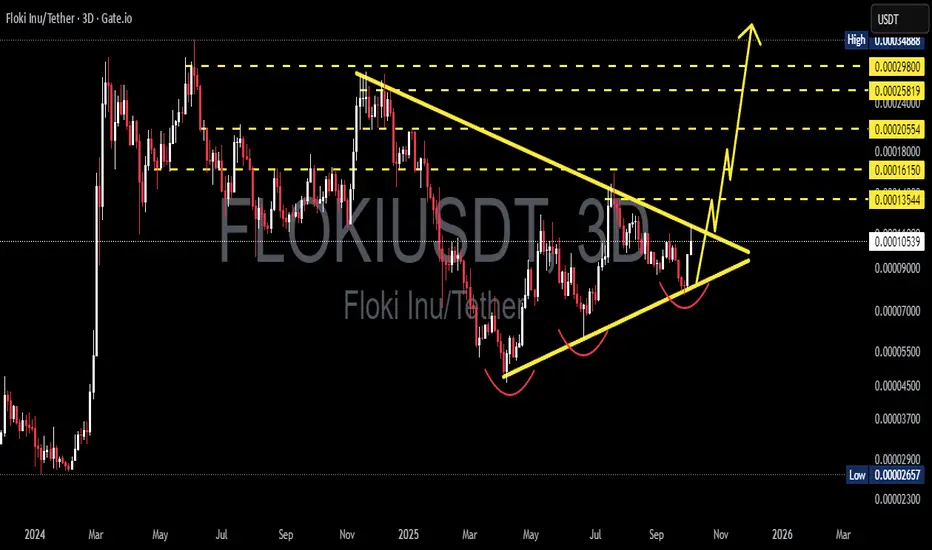
FLOKIUSDT — Symmetrical Triangle: Consolidation Before Big Move?1. Overview
The FLOKI/USDT (3D, Gate.io) chart is forming a large symmetrical triangle, developing since early 2025.
This pattern reflects a prolonged consolidation phase following a significant downtrend, where market participants are balancing between selling pressure and gradual accumulation before the next major directional move.
Interestingly, the lower structure shows several rounded bottoms along the ascending trendline — a strong indication of gradual accumulation by larger buyers, as each dip is being bought higher than the previous one.
---
2. Pattern Analysis
Primary pattern: Symmetrical Triangle — a neutral structure that can break either way, depending on momentum and volume confirmation.
Ascending trendline (support): consistent higher lows indicate rising buying interest and absorption of sell orders.
Descending trendline (resistance): each rally meets selling pressure near this line, forming lower-highs.
Sub-pattern: multiple rounded bottoms (forming a slight triple-bottom structure) that often precede bullish breakouts from consolidation.
Volume behavior: still relatively quiet, but a breakout is often accompanied by a sharp increase in trading volume — a key element to watch.
---
3. Key Technical Levels
Dynamic Support
Ascending trendline: around 0.00009000 – 0.00009200, acting as a strong defensive zone for buyers.
A breakdown below this line would invalidate the bullish structure.
Dynamic Resistance
Descending trendline: currently around 0.00010500 – 0.00011000, serving as the upper boundary of the triangle.
A 3D candle close above this line will be the first bullish breakout confirmation.
Major Resistance Targets (Post-Breakout Levels)
1. 0.00013544 — first breakout target / local resistance.
2. 0.00016150 — secondary resistance zone.
3. 0.00018000 — key resistance from previous high.
4. 0.00020554 — medium-term breakout target.
5. 0.00025819 — strong bullish continuation zone.
6. 0.00029800 — major measured-move target of the triangle.
---
4. Bullish Scenario
Bullish Confirmation:
A 3D candle close above the descending trendline.
Volume expansion during breakout.
Successful retest of the breakout zone turning resistance into new support.
Potential Move: Once confirmed, the breakout projection points to a potential rally toward 0.000258 – 0.000298, implying an upside of roughly +140% to +180% from the current price (0.00010542).
Additional Validation:
3D RSI breaking its descending trendline → momentum confirmation.
Gradual increase in accumulation volume → smart money participation.
---
5. Bearish Scenario
Bearish Confirmation:
3D candle close below the ascending trendline (~0.00009000).
Volume increase during breakdown.
Failed retest (price unable to reclaim the broken support).
Downside Targets: If breakdown occurs, FLOKI could revisit the following areas:
0.00007000 — first support zone.
0.00005000 – 0.00004500 — secondary demand area.
0.00002657 — macro historical low and last defense for long-term holders.
However, as long as higher-lows remain intact, the bullish structure stays dominant, and breakdown probability remains lower.
---
6. Technical Summary
Pattern: Symmetrical Triangle (Neutral, but with bullish bias).
Current Bias: Slightly bullish due to rising higher-lows.
Main Confirmation: 3D close above descending resistance (0.000105–0.000110).
Upside Targets: 0.000135 → 0.000161 → 0.000180 → 0.000205 → 0.000258 → 0.000298.
Key Supports: 0.000090 → 0.000070 → 0.000026.
Timeframe: 3D — ideal for swing and medium-term traders.
Interpretation:
FLOKI is approaching a critical compression point — a make-or-break zone.
A strong breakout with volume could trigger a new major bullish cycle, while a failure to hold the ascending base may lead to a deeper correction before the next accumulation phase.
---
7. Risk & Confirmation Notes
Always wait for 3D close confirmation before acting on breakout/breakdown.
Volume confirmation is crucial for validity.
Watch for fakeouts near the apex — safer entry comes after a retest.
Use proper stop-loss (below trendline or swing low) and position sizing.
---
8. Disclaimer
This analysis is for educational and informational purposes only, not financial advice.
Always do your own research (DYOR) and use strict risk management in every trade.
---
#FLOKI #FLOKIUSDT #FlokiInu #CryptoAnalysis #TechnicalAnalysis #TrianglePattern #SymmetricalTriangle #Breakout #Altcoins #CryptoSwing #ChartAnalysis #CryptoSetup #PriceAction #CryptoMarkets
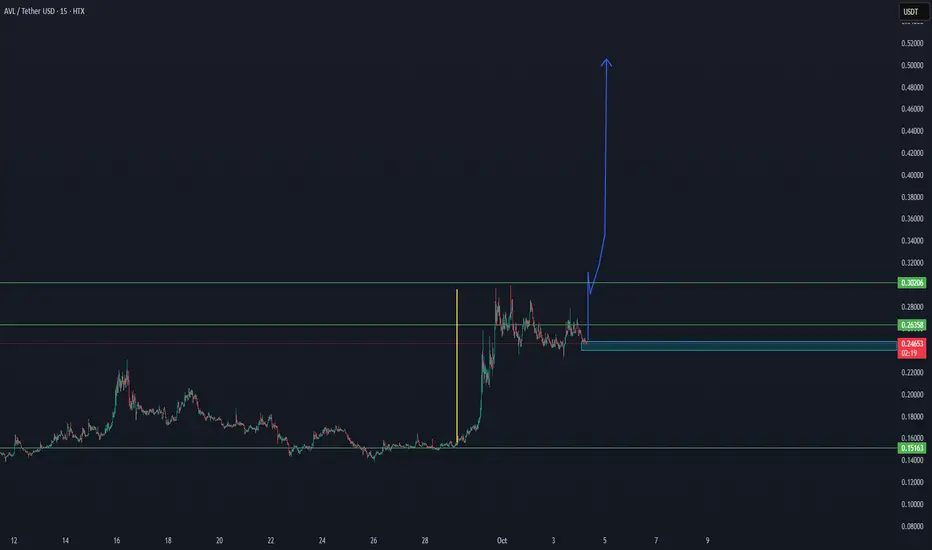
AVL ON WAY TO THE TARGET $0,50 - UPDATE 04-10-2025📊 AVL/USDT Update
AVL is consolidating above key support and holding structure, with price currently around $0.24.
✅ Support around $0.26 – $0.24 is holding.
✅ As long as this zone remains intact, momentum favors another bullish leg.
📈 The next major resistance sits at $0.30, and a successful breakout from there opens the way toward the $0.50 target.
⚡ Outlook: Structure is bullish, and the chart suggests AVL could push to $0.50 in the coming cycle if momentum continues.
FLOKIUSDT UPDATE#FLOKI
UPDATE
\ SEED_DONKEYDAN_MARKET_CAP:FLOKI Technical Setup
Pattern: Bullish Falling Wedge
Current Price: $0.00010439
Target Price: $0.00012500
Target % Gain: 30%+
Technical Analysis: FLOKI has broken out of a bullish falling wedge pattern on the 4H timeframe with strong momentum. Price is holding above resistance turned support, confirming breakout strength with potential for upside continuation.
Time Frame: 4H
Risk Management Tip: Always use proper risk management.

FLOKI - Accuracy on point again! SEED_DONKEYDAN_MARKET_CAP:FLOKI - setup shared few days ago! Accuracy - on point! 🔥
Almost 2 Month downtrend breakout ✅
Price might continue to climb toward 0.00010800 - 0.0001100$ (previous view) 📈
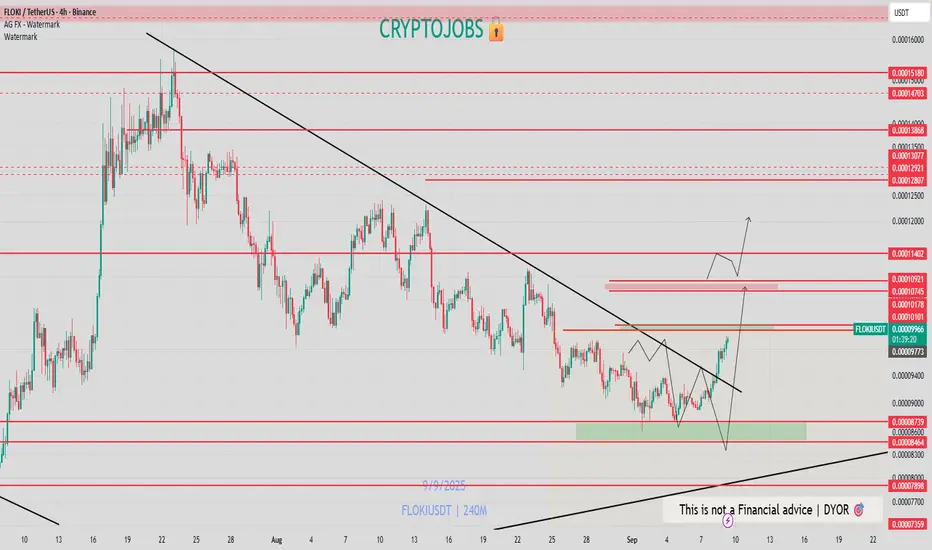
FLOKIUSDT — Demand Zone Retest: Major Rebound or Breakdown?Full Analysis:
FLOKI is currently facing a make-or-break moment as price revisits the daily demand zone at 0.000085–0.000091 (yellow box on the chart). Historically, this zone has acted as a strong launchpad, pushing FLOKI higher multiple times in the past few months.
However, this time the context is different. Since late July, the structure has been printing lower highs, signaling persistent selling pressure. This descending momentum forms a structure similar to a descending triangle, where repeated support tests often weaken the level. In other words, this demand zone is not just a bounce opportunity, but the ultimate battleground for FLOKI’s next trend.
---
🔹 Bullish Scenario
As long as FLOKI holds above 0.000085–0.000091, the chance for a rebound remains alive.
First bullish trigger: a daily close above 0.0001024 (key S/R flip). This would confirm strength and shift short-term momentum.
If confirmed, upside targets are layered at 0.0001209 → 0.0001534 → 0.0002006, with an extended move potentially reaching 0.0002639.
Invalidation: A daily close below 0.000085 would cancel this setup.
---
🔹 Bearish Scenario
A clear daily close below 0.000085 would confirm breakdown of the demand zone.
In this case, FLOKI could extend lower toward 0.000070 → 0.000052 → 0.0000455 (historical low).
Even weak bounces that get rejected at 0.0001024 or 0.0001209 would reinforce bearish continuation and confirm sellers’ dominance.
---
🔹 Pattern & Structure
FLOKI is showing descending pressure into a flat support — a structure often seen in descending triangles.
Statistically, this pattern leans bearish. But traders must watch closely:
A false breakdown below support, followed by a sharp recovery, could trigger a short squeeze rally.
A clean reclaim of 0.0001024 would strongly shift sentiment back to the bulls.
---
🔹 Strategy & Risk Management
Long idea: Aggressive entries inside the demand zone with a tight stop below 0.000085. Conservative entries wait for confirmation above 0.0001024.
Short idea: Either wait for a confirmed daily close below 0.000085, or look for strong rejections at 0.0001024/0.0001209.
Keep in mind: FLOKI is a high-volatility asset, so position sizing and stop placement are critical.
---
📌 Conclusion
FLOKI is at a critical crossroads. The 0.000085–0.000091 demand zone is the last stronghold that separates a potential major rebound from a deeper breakdown. The market’s reaction here will likely define FLOKI’s mid-term trend for the coming weeks.
#FLOKI #FLOKIUSDT #Altcoin #Crypto #TechnicalAnalysis #PriceAction #SupportResistance #DemandZone #BullishScenario #BearishScenario

$FLOKI: my green zones are back. Time to refill our bags.SEED_DONKEYDAN_MARKET_CAP:FLOKI is a solid meme coin backed by a long-standing, loyal community and an actively developed metaverse/GameFi project.
With strong tokenomics and a medium-cap profile, SEED_DONKEYDAN_MARKET_CAP:FLOKI is capable of delivering explosive upside bursts.
If it re-enters my green buy zone, wait for it to touch the bottom before entering — historically, this level has produced strong bounces and solid profit opportunities.
⚠️ Reminder: Always take profits on the bounce. Meme coins like SEED_DONKEYDAN_MARKET_CAP:FLOKI are better suited for short- to mid-term trades, not long-term holding, as they often retrace sharply after a pump.
------------------------
The altcoin market just saw a solid pump, following the massive CRYPTOCAP:BTC and CRYPTOCAP:ETH institutional billion-dollar purchases.
On the Daily timeframe, we’re actually printing higher lows, showing clear market strength. The top of the range was rejected, and now it’s highly probable that the crypto market will enter a consolidation phase — a move that could push several altcoins into my buying zones.
💡 Reminder: My buying zones are areas where it’s statistically safer to buy and hold, with an almost guaranteed chance of making a solid profit on the next bounce.
What could spark the infamous Altseason?
Many altcoins share one thing in common: a major resistance line (marked in yellow). For them to pump to the moon, this line needs to be broken.
We’re also seeing a price compression — meaning the breakout could be imminent. This pullback might be your last chance to enter a long position before the real Altseason kicks off.
Possible Altseason catalysts:
📉 FED Interest Rate Cut of 1% or more.
📈 Institutional adoption through altcoin index ETFs — imagine BlackRock launching ALT10, ALT50, ALT100 ETFs, attracting massive institutional money into the altcoin market.
I believe both events could happen before the end of the year.

FLOKI : Will growth continue or will prices be dumped?Hello friends🙌
✅Well, this meme coin grew well when it was first created and surprised everyone, and now that some time has passed since its creation, it has been listed on an exchange and we are going to examine together what effect it has on its price.
✅Well, when this meme coin was first created, it grew well and has given good profits to its holders so far. Now that it is listed on an exchange and more transactions are taking place, it will definitely be impressive, but the chart always has the final say.
So what does the chart tell us?
✅In the 30-minute time frame, which is considered a short-term time frame, we had a decline due to the decline in the entire market, and the price was supported in the specified support area, but not definitive support.
✅Several channels have been drawn so that in the event of a break from above or below, we can understand whether the power is in the hands of buyers or sellers.
Now, if the buyers show their strength, which they did to some extent (a trendline break and a strong pullback), we can buy in the specified areas with risk and capital management and move with it to the upcoming goals.
📉If buyers cannot dominate the price and sellers dominate more, we should wait for lower support areas.
⚠Don't forget risk and capital management, friends.⚠
🔥Follow us for more signals🔥
*Trade safely with us*

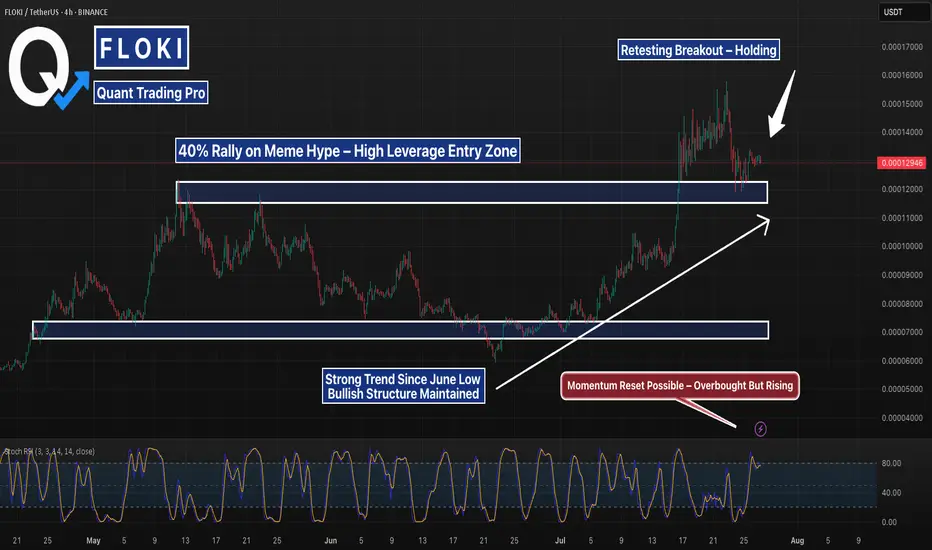
FLOKI Pulls Back After 40% Pump — Testing Breakout StructureFLOKIUSDT 4H chart shows a textbook meme-driven breakout followed by a clean pullback into prior structure. After a 40% move up in just a few sessions — driven by rising social media hype and a massive jump in futures open interest — FLOKI is now retesting the breakout base near the 0.0000120 level.
This zone served as the high of a multi-month range and is now being tested as support. Price is also riding a clear ascending trendline from the June lows, suggesting overall structure remains bullish unless that trend is broken.
Stochastic RSI is elevated but hasn't rolled over yet, signaling momentum could still push higher if support holds. If bulls defend this zone and break above the upper consolidation, the next leg could push toward the previous local highs around 0.0000170. If support fails, eyes turn to the 0.0000098 mid-range level.
Momentum cooling — structure still intact.
FLOKIUSDT Pullback at Fibonacci Resistance – Bounce?📊 Market Overview:
FLOKI has recently posted a remarkable rally, gaining over +200% from the swing low at 0.00004548. This surge broke through multiple resistance levels, forming a strong bullish market structure with clear Higher Highs (HH) and Higher Lows (HL).
However, this bullish momentum has now met a critical resistance at 0.00015339, which aligns with the Fibonacci 0.382 retracement level of the previous macro move. This rejection has triggered a pullback, raising questions: is this a healthy retracement, or the start of a trend reversal?
---
🧠 Technical Breakdown:
✅ Bullish Structure in Play
The recent move appears to be part of a larger impulsive wave, possibly Wave 1 or 3 of an Elliott Wave sequence.
✅ Golden Pocket Zone in Sight
The highlighted yellow box marks the Fibonacci Golden Pocket area between 0.5 (0.00011441) and 0.618 (0.0001104) — historically, this is a high-probability buy zone where bulls often regain control.
✅ Breakout Retest Potential
The current pullback could be a textbook retest of the previous breakout base, setting up for continuation — but only if this key zone holds.
---
🟢 Bullish Scenario:
If the price finds support at the 0.000110–0.000114 zone, and forms a strong bullish reversal candle (e.g., bullish engulfing, hammer), it could ignite a fresh wave upward targeting:
🔼 0.00015339 (breakout level)
🔼 0.00018212
🔼 0.00020366
🔼 0.00022000
🔼 0.00026506
🏁 0.00028898 — the previous major high and full swing target
Such a move would validate the continuation of the macro uptrend and possibly confirm Wave 3 in a larger Elliott Wave structure.
---
🔴 Bearish Scenario:
On the other hand, a daily close below 0.000110 would invalidate the bullish golden pocket thesis and potentially shift momentum in favor of the bears.
Possible downside targets include:
🔻 0.00008500 — minor support and demand zone
🔻 0.00004548 — the macro low and strong historical support
This would form a Lower High (LH) structure, which could signal the beginning of a bearish trend or extended consolidation.
---
🔍 Conclusion:
> FLOKIUSDT is now at a make-or-break level. The 0.000110–0.000114 zone is where bulls and bears will battle for control of the trend.
Hold here — and we may see a strong continuation.
Break below — and caution is warranted.
Wait for clear price action confirmation in the coming sessions before positioning. This zone will likely dictate FLOKI’s next major move.
---
💡 Pro Tips for Traders:
Watch for bullish reversal candlesticks in the golden pocket area.
Monitor volume — rising volume on a bounce increases breakout probability.
RSI divergence may provide early signs of trend reversal or continuation.
#FLOKIUSDT #FLOKI #CryptoAnalysis #AltcoinRally #FibonacciLevels #TechnicalAnalysis #BullishScenario #BearishScenario #PriceAction #CryptoBreakout #GoldenPocket #TrendReversal

FLOKI Headed to $0.01. Cents Floki to the upside after break out from bullish triangle pattern. Target is the 141.00%

FLOKIUSDT Breaks Key Resistance – Bullish Continuation Ahead?BINANCE:FLOKIUSDT is trading inside its longest ascending triangle. The price has respected the triangle's support and bounced back. It has now broken a key resistance zone. As seen in the chart, every time the price breaks a major resistance, a bullish move follows, and we can expect a similar scenario this time.
SEED_DONKEYDAN_MARKET_CAP:FLOKI CRYPTO:FLOKIUSD
Cheers
Hexa🧘♀️

FLOKI: The optimal entry price! Trading Setup
If you’re considering trading FLOKI, here’s a quick setup that may help you.
The idea is: Buy when the price breaks above $0.000105 and take profits at the levels shown in the chart.
Targets:
1. $0.000108
2. $0.000112
3. $0.000117
-------------------------------------------
About our trades:
Our success rate is notably high, with 10 out of 11 posted trade setups achieving at least their first target upon a breakout price breach (The most on TW!). Our TradingView page serves as a testament to this claim, and we invite you to verify it!
