Nifty FMCG: A Deep Dive into the Elliott Wave AnalysisHello Friends,
Welcome to RK_Chaarts.
Today, we have brought this post to illustrate how we apply Elliott Wave Theory using the FMCG sector chart as an example for educational purposes.
In this post, we will analyze the Nifty FMCG Sector Index chart and see how Elliott Wave Theory can help us anticipate the potential direction of the market. We have previously discussed Elliott Wave Theory several times, and today we will apply it to the FMCG sector.
During this analysis, we will observe how the FMCG sector chart can be divided into various waves according to Elliott Wave Theory & its Principles, and how we can use these waves to forecast the future market direction. This post is purely for educational purposes and is not intended to provide any investment recommendations.
Elliott Wave Theory Principles
1) Wave 2 will never retrace more than 100% of wave 1.
2) Wave 3 will Never be shortest among all three Impulses (1-3-5)
3) Wave 4 will Never enter into the Territory of wave 1.
(Except Diagonals and Triangles)
4) Momentum RSI Divergence in Wave 3 & Wave 5.
Let's start,
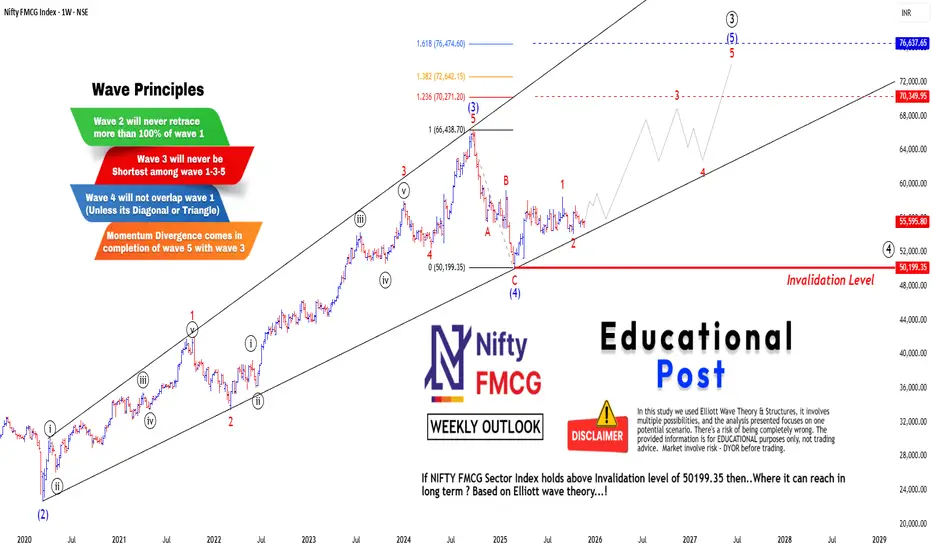
We can clearly see that the sector index chart completed Wave (2) of intermediate degree (Blue) during the March 2020 fall (COVID period). After that, it moved continuously bullish and completed Wave (3) of intermediate degree (Blue) at the top of September 2024. From there, it continuously showed a fall downwards, completing Wave (4) of intermediate degree (Blue) at 50199.35 which is bottom in March 2025.
After that, the index has been moving slightly sideways to bullish, but there is still no strength or momentum visible in it. So, friends, if we assume the projection where Wave (5) can reach using Fibonacci trend-based Fib extension based on Elliott Wave Theory, Considering move in Waves (3) to (4), it can potentially reach around somewhere between fib level 1.236 to 1.618 levels in the long term in the future because this is a weekly time frame chart.
It has an invalidation level which is the low of Wave (4) pegged at 50199.35 on the chart. If the price falls even one point below this level, we will definitely have to reanalyze our wave counts and all these assumptions will get invalidated. Then we have assume that Wave (4) is still ongoing or something else is possible. So currently, assuming Wave (4) is finished, we have started the journey of Wave (5). These are assumptions as long as the price stays above the invalidation level; we can assume it will reach somewhere between fib level 1.236 to 1.618 levels in the next 1.5 to 2 years.
This analysis is based on Elliott Wave Theory and is shared purely for educational purposes to show how Elliott Wave Theory can be used to forecast a market roadmap.
I am not Sebi registered analyst.
My studies are for educational purpose only.
Please Consult your financial advisor before trading or investing.
I am not responsible for any kinds of your profits and your losses.
Most investors treat trading as a hobby because they have a full-time job doing something else.
However, If you treat trading like a business, it will pay you like a business.
If you treat like a hobby, hobbies don't pay, they cost you...!
Hope this post is helpful to community
Thanks
RK💕
Disclaimer and Risk Warning.
The analysis and discussion provided on in.tradingview.com is intended for educational purposes only and should not be relied upon for trading decisions. RK_Chaarts is not an investment adviser and the information provided here should not be taken as professional investment advice. Before buying or selling any investments, securities, or precious metals, it is recommended that you conduct your own due diligence. RK_Chaarts does not share in your profits and will not take responsibility for any losses you may incur. So Please Consult your financial advisor before trading or investing.
FMCG
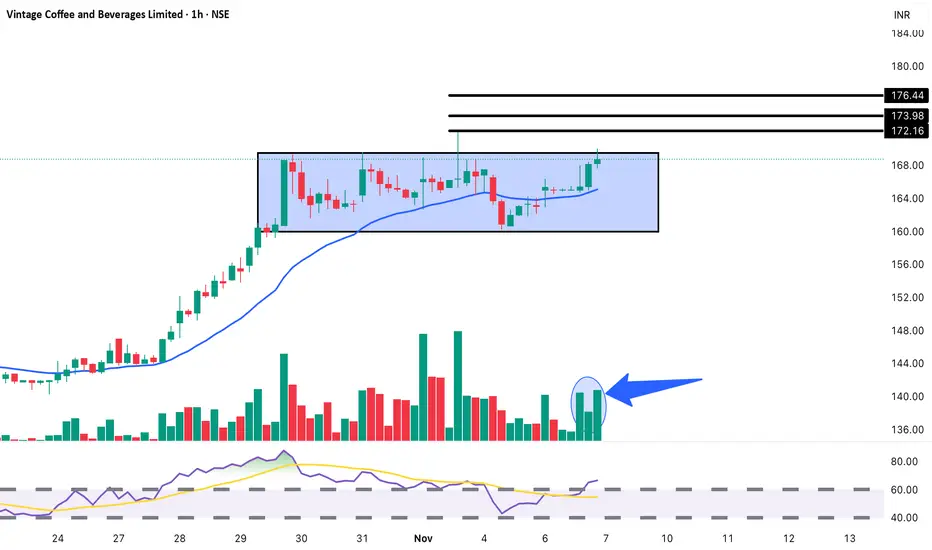
Vintage Coffee & Beverages: Rectangle Pattern Swing Trade SetupBUY Setup ☕
Entry: ₹168-169 (Current Level)
Target 1: ₹172-173
Target 2: ₹174-176
Target 3: ₹180+ (Breakout Extension)
Stop Loss: ₹164
Technical Rationale:
Rectangle consolidation pattern (160-169) visible on 1-hour chart (blue shaded zone)
Holding strong at upper range of consolidation
Volume spike highlighted (blue arrow) - showing buying interest
Strong uptrend from 144 to current levels
Trading above rising EMA - bullish trend intact
RSI trending upward around 70 - strong momentum
Small-cap F&B stock showing resilience
Volume at 1.31M - decent for 1H timeframe
Multiple resistance levels clearly marked: 172, 174, 176
Support well-established at 164-165 zone
Coiling pattern - compression before expansion
Risk-Reward: Good 1:3+ ratio
Pattern: Rectangle consolidation on 1H chart - typically a continuation pattern after strong uptrend
Strategy: Intraday to short-term swing (1-3 days)
Book 40% at T1 (172.50), 30% at T2 (175), trail remaining with SL at 169 after T1
Aggressive traders can add on break above 169.50 with volume
Key Levels:
Breakout Zone: 169-170 (upper rectangle boundary)
Strong Resistance: 172, 174, 176
Critical Support: 164, 162, 160 (rectangle base)
Timeframe: 1-hour chart - suitable for intraday/swing traders
Volume Analysis: Recent volume spike (highlighted) suggests accumulation at upper range - bullish sign
Sector: F&B/FMCG - relatively defensive sector
Note: Currently showing strength with +0.36% gain. Watch for breakout above 169.50 with volume for confirmation.
Disclaimer: For educational purposes only. Not SEBI registered.
Nestle India Buy Alert – Golden Opportunity for InvestorsNestle India – Technical Update
Timeframe: 1-Hour Chart
Price Action: Nestle India is trading within a well-defined parallel channel.
Support Zone: Currently sustaining above the 1170–1180 LOP support zone.
Outlook: If the stock holds this level, we may witness upside momentum.
Potential Target: 1280–1290 near the channel resistance.
Thank you!

Technical Analysis: Price Breakout and BeyondHello Friends,
Welcome to RK_Chaarts,
Let's try to analyze a stock from the FMCG sector, "Dabur India Limited".
Elliott Wave perspective.
We can see that the correction is completed, which is the IVth wave of the monthly time frame of cycle degree in Red. Now, possibly the impulse wave Vth had start unfolding. If we go inside that, we'll see its five sub-divisions in black, labeled ((1))-((2))-((3))-((4))-((5)) of primary degree.
Possibly, wave ((1)) has started unfolding, and within wave ((1)), we'll see five sub-divisions in blue, which is the intermediate degree. Within this, waves (1) and (2) looks complete, and wave (3) has started, which has also broken out of the curve line.
Invalidation level
If our wave counts are correct, the bottom level of wave IV, which is 433, will be our main invalidation level. If the price goes below this level, it will trigger the invalidation level. If that happens, we'll need to re-analyze the chart from a wave count perspective.
But if the price stays above this invalidation level, then our view, which is based on the analysis, will remain bullish, and the chart will remain bullish.
Projected Target
As per Elliott wave theory, it can show new ATH in Long Term, only if Invalidation level is not breached.
Breakout with good Intensity of Volumes
The breakout has a good intensity of volume. The volume in the breakout candle is looking very good, which is 3-4 times higher than the average. This means that market participation is very good during this breakout. So, Conviction is high on this breakout.
We can clearly see that the price has closed above the 50 Exponential Moving Average (EMA), 100 EMA, and 200 EMA, which is a very good sign that the price has overcome all these hurdles along with Breakout.
Now, if there are any hurdles above, they could be the 200 EMA on the weekly time frame, which is coming near the level of 529, and the 50 EMA on the monthly time frame, which is coming near the price of 527. Currently, the price is trading around 513.
Once it crosses 529 or 530, it may show even more strength after that.
Dow Theory Trend confirmation
Based on Dow Theory, if we observe, the price which was falling and making lower highs and lower lows, has now started forming a Higher High and Higher Low pattern on the daily time frame, which is again a sign of bullishness.
Standard Deviation crossed
Price is trading above the mid-Bollinger Band on the weekly time frame, i.e., in the bullish territory. On the daily time frame, Prince has also crossed the upper Bollinger Band, meaning it has broken out and is expanding above the upper Bollinger Band, which is a bullish sign
Supporting Indicators
On the daily time frame, a very good breakout is visible inside RSI, and is also moving above 72. Additionally, on both the daily and weekly time frames, the MACD has given a positive crossover.
Before making any trading decisions, please conduct your own analysis or consult with a technical expert or financial consultant.
I am not Sebi registered analyst.
My studies are for educational purpose only.
Please Consult your financial advisor before trading or investing.
I am not responsible for any kinds of your profits and your losses.
Most investors treat trading as a hobby because they have a full-time job doing something else.
However, If you treat trading like a business, it will pay you like a business.
If you treat like a hobby, hobbies don't pay, they cost you...!
Hope this post is helpful to community
Thanks
RK💕
Disclaimer and Risk Warning.
The analysis and discussion provided on in.tradingview.com/u/RK_Chaarts/ is intended for educational purposes only and should not be relied upon for trading decisions. RK_Chaarts is not an investment adviser and the information provided here should not be taken as professional investment advice. Before buying or selling any investments, securities, or precious metals, it is recommended that you conduct your own due diligence. RK_Chaarts does not share in your profits and will not take responsibility for any losses you may incur. So Please Consult your financial advisor before trading or investing.

HNST: When honesty turns into a breakout formationOn the weekly chart, The Honest Company (HNST) is shaping a textbook broadening formation. Four waves are already in place, and the fifth is unfolding. The recent bounce came exactly after a retest of the long-term trendline at point (4), pushing the price above the critical $4.97 resistance (0.236 Fibo) — a clear signal that buyers are reclaiming control.
Volume is steadily rising, and the golden cross (MA50 crossing above MA200) further confirms a mid-term trend shift. The volume profile above current prices is nearly empty — indicating minimal resistance. Immediate targets are $6.33 and $6.94 (0.5 and 0.618 Fibo), while the full breakout projection lands at $8.91, $10.31, and even $12.09 (based on 1.0, 1.272, and 1.618 expansions).
Fundamentals (as of June 28, 2025):
— Market Cap: ~$460M
— Revenue (TTM): ~$344M
— YoY Revenue Growth: +7.6%
— EPS: –0.18 (loss narrowing)
— Cash on hand: ~$24M
— Debt: under $10M
— P/S ratio: 1.34
Despite being unprofitable, HNST is showing strong signs of operational improvement — rising gross margins, controlled costs, and increasing leverage. Growth in both online and retail sales adds further support. With institutional buying picking up, the market may be slowly re-rating this small-cap FMCG player.
Trade Plan:
— Entry: by market
— Targets: $6.33 → $8.91 → up to $12.09
When even an "honest" stock starts drawing broadening patterns and volume’s rising — it’s not a hint, it’s a launch sequence. And the bears? Might want to take a seat in the back.

FMC Corp | FMC | Long at $58.00NYSE:FMC Corp is currently trading at a P/E ratio 6x and has a 3.98% dividend. It had a very rough year in 2023, but the company estimates improved earnings and growth after 2024. From a technical analysis perspective, it appears to be in an accumulation phase after seeing a low around $50 and wavering between that value and $68 for 11 months. Unless fundamentals change post earnings, it is currently in a personal buy zone at $58.00.
Target #1 - $81.00
Target #2 - $85.00
Target #3 - $90.00
Target #4 - $122.00 (very long-term...)

Britannia Industries : Prepared for the Next Step..?Britannia Industries' stock price has returned to the 6000 price level, which was previously a resistance level, and will now act as a support level. Additionally, the 50-day moving average support is also at the same level.
In other news, the company has announced a strategic partnership with Bel Group for local cheese manufacturing in India. A factory in Ranjangaon, Maharashtra, will produce 10,000 tons of Britannia The Laughing Cow cheese products each year to meet the growing demands of Indian consumers. The joint venture will invest Rs 220 crore in the cheese plant.

KRITINUT - Kriti Nutrients - Uptrend - Long 1. HH & HL - Market Structure formation
2. Break of Structure
3. 50% EMA support
4. Volume spike
5. ADX - starts to show the strength of the trend
6. Fundamentally looks good.

HINDUSTAN UNILEVER : Updated Price ActionHere are some pointers to keep in mind:
- One year-long consolidation.
- Clearly defined support and resistance.
- 6 Week consolidation at the resistance zone makes the resistance weak
- Recent breakout was prevented with a long upper wick. A.K.A Sellers present.
- Margin of Safety is a mere 6% ( CMP vs ATH)
- There is no clear winner yet as the signals are mixed.
- A break of the consolidation range may lead to zone-to-zone momentum
What is your take on it? Feel free to comment. If it helped, Do Leave us a boost 🚀
Disclaimer: We are not registered advisors. The views expressed here are solely personal opinions. Irrespective of the language used, Nothing mentioned here should be considered as advice or recommendation. Please consult with your financial advisors before making any investment decisions. We like everybody else, have the right to be wrong :)

Dabur: Resistance Zone !Hey There,
- Like always, The chart is self-explanatory.
- We saw a triangle breakout which happened very close to a crucial resistance zone that acted like one.
- This is one previous support that turned crucial resistance
- Previously, the price has fallen 3 times after testing this level. The fourth time's a charm?
- We see a good consolidation at the resistance zone since the breakout
- NSE:MARICO sustained similar consolidation to fly high whereas NSE:HINDUNILVR failed to break it.
- What will DABUR do?
Have Insights or Questions? Let us know in the comments below.👇
While you do that, how about a boost for some motivation🚀
⚠️Disclaimer: We are not registered advisors. The views expressed here are merely personal opinions. Irrespective of the language used, Nothing mentioned here should be considered as advice or recommendation. Please consult with your financial advisors before making any investment decisions. Like everybody else, we too can be wrong at times ✌🏻

ITC target 600FMCG major ITC currently trading at 424.90 rupees is going to see a major jump in its share price from the current levels to the levels of around 590-600 giving a return of around 60% from the present levels. The analysis is based on cup with handle chart pattern which can be seen in the chart posted with this analysis. the target will be achieved within this year.
Hope you like my analysis.
Please do your own analysis before investing.
Do like and follow and share among your friends and family.
Thank you.

HUL: Long position mid term (35% returns)HUL has give a strong breakout today (with heavy volume) against its trendline (blue). The price has been in a downtrend since July 2023 forming a rounding bottom pattern with neckline at 2700 and bottom at 2200. The target based on the pattern is 3200 (Upside of 35%) .
Fundamentally, the company is strong and has grown consistently. The P/E valuation and EV/EBITDA are at multiyear low. The stock has been under time correction mode for the last 3 years. The inflation is expected to come down in the coming quarters which will help revive the sales and boost the earnings going forward. The rural demand has picked up as well. All the drivers should set the stock rallying to new ATHs.
Targets:
1) 2450-2500 (range)
2) 2650-2700 (range)
3) 3200
Risks: Given the Nifty has been under selling pressure, there's a risk of this breakout to not push all the way to the targets creating another round of sideways price action.

JUBLFOODTrendline Breakout.
Volume Buildup seen.
Above 20 EMA.
Good for Short term.
Do Like ,Comment , Follow for regular Updates...
Keep Learning ,Keep Earning...
Disclaimer : This is not a Buy or Sell recommendation. I am not SEBI Registered. Please consult your financial advisor before making any investments . This is for Educational purpose only.

MISHTANN FOODS - 2 YEARS HIGH BREAKOUTCan enter at CMP 23₹
or enter at 21₹
Target - 35.55
Disclaimer - All information on this page is for educational purposes only,
we are not SEBI Registered, Please consult a SEBI registered financial advisor for your financial matters before investing And taking any decision. We are not responsible for any profit/loss you made.
Request your support and engagement by liking and commenting & follow to provide encouragement
HAPPY TRADING 👍

ITC new runITC can start a new run after results if holds 435 levels..
Buy in 4440-445 range with 435 stop los short term or 425 medium term with a target of 500 to 530 levels..

MARICO AT SUPPORTStock taken support at this level multiple times.
Follow proper Risk Management.
Disclaimer : This is not a Buy or Sell recommendation. Please consult your financial advisor before making any investments . This is for Educational purpose only

JUBLFOOD LONGSupport at 200 EMA
Morning star with confirmation.
Target 560, 585.
Follow proper Risk Management
Disclaimer : This is not a Buy or Sell recommendation. Please consult your financial advisor before making any investments . This is for Educational purpose only

END OF THE RETRACE MOVE FMCG index has given a good impulsive move and now it is at the end of retracement move, expecting the index to be BULLISH in the upcoming months if it gives any kind of reversal from the VALID DEMAND ZONE then can start to build long positions in the sector

📈 Exciting Bullish Pattern Alert! 🐂📊 Pattern: Rising Channel
📌 Symbol/Asset: Britannia Industries
🔍 Description: FMCG Defensive stock available on Strong Support
👉 Remember: Technical patterns are just one piece of the puzzle. Consider conducting further research, consulting with a financial advisor, and managing your risks appropriately.

TASTY BITE IS ALL SET TO OFFER 12 % ROI AND ITS ATTRACTIVEits LONG SHARE AT PRICE OF 10561 DATE 02.01.2022 OOHO 2023 IT HAS POTENTIAL UPTO 12 % ROI
Tasty Bite Eatables has an operating revenue of Rs. 435.32 Cr. on a trailing 12-month basis. An annual revenue de-growth of -5% needs improvement, Pre-tax margin of 4% needs improvement, ROE of 4% is fair but needs improvement
for more WSUP ME 8459 220 202

GILLETTE will break its previous highGillette is in the same price range of 2017-18 but it has given a net profit of more than 1643 crores and it is 29% down from its lifetime high. SO it is currently an undervalued stock. If it reaches lifetime high then a profit of 37% is made on the bet but it will surely break the lifetime high and make a new lifetime high. The company has significantly reduced its other costs and increasing it revenue and net profit. It is trading at a lower P/E ratio that its average 10 year P/E. It has a CWIP of 74 crores which means the company is looking for expansion. The company is debt free which makes it a safe share to buy and get huge gains.

NESTLE INDIAHello and welcome to this analysis
In the weekly time frame it is showing a strong reversal with the activation of a Bullish Harmonic 5-0 pattern.
It could do a rally till 19750 and above that till 23000 as long as it does not break 18750
Good risk reward set up in the current scenario

Godrej Consumer Breakout Godrej Consumer Breakout CMP 946
CUP & HANDLE BREAKOUT
Can Do Easy 5/10/15%
