Zeta Global: structure reset on the weeklyZeta Global Holdings Corp. operates in marketing technology, providing data-driven customer intelligence and automation solutions for enterprises.
On the weekly chart, ZETA has completed a breakout above the long-term descending trendline and is currently holding a clean retest zone. The key support area sits between 17.8 and 18.4, where the weekly MA100 aligns with the 0.786 Fibonacci retracement. This confluence strengthens the structure and confirms acceptance after the impulse. Volume expanded on the breakout and cooled during the pullback, suggesting controlled price action rather than distribution. Weekly MACD is turning higher after a prolonged reset, while RSI remains above neutral territory, supporting a shift in market phase. Volume profile highlights upside attraction zones, with the first major area near 29–30 and a higher zone around 40.
From a fundamental perspective, the company shows improving financial quality. Market capitalization is around $5B, with consistent positive operating cash flow. Quarterly operating cash flow reached $57.9M, while free cash flow increased to $52.4M, both growing strongly year over year. Revenue continues to expand, with Q4 2025 estimates near $378M and expected EPS of $0.23. ZETA does not pay dividends, focusing instead on reinvestment and growth, while maintaining manageable debt and a solid balance sheet.
This is a higher-timeframe positioning idea where the market gradually reassesses the business after a corrective phase. Calm structure, improving fundamentals, and clear technical logic.
Followthetrend

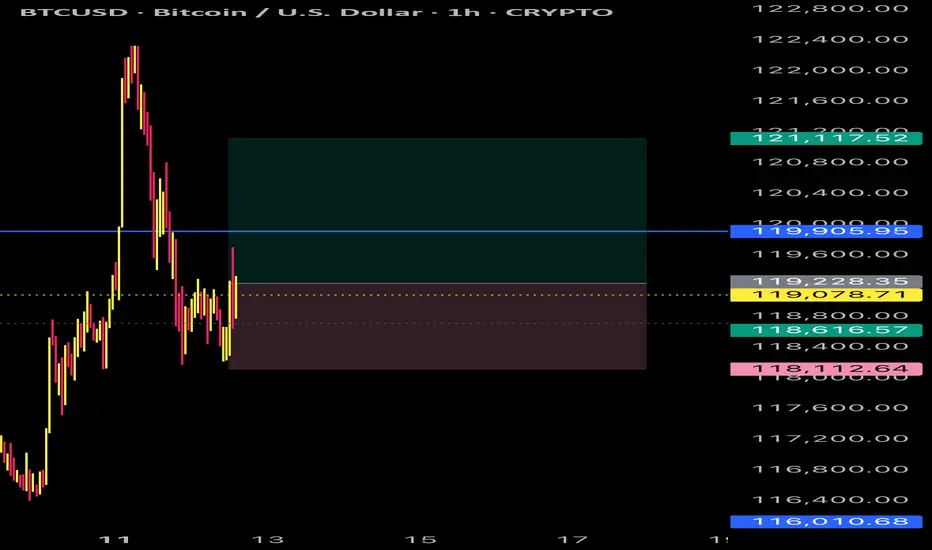
BTC PROFITBitcoin had hit our expected level and gave us take profit therefore all predictions were correct and accurate

GOLD IN ABSOLUTE PROFITS Gold has hit take profit , now we will continue to follow the structure and price pattern and most importantly the trend
BTC PROFIT Bitcoin has given us solid profit and to those that took partials they are covered, trade will still run however remember to follow the rules fully (50/50+TS)

Nebius Group N.V. (NBIS) when growth stops being randomI am looking at the weekly chart of NBIS and this is no longer about emotions, it is about structure. Price has formed a stable bullish cycle, broke out from a wide base and is now holding above key moving averages. On the weekly timeframe most indicators have already shifted into buy mode, while the market does not look overheated. RSI remains in a neutral bullish zone, momentum is intact, and pullbacks are being absorbed without aggressive selling pressure.
The 50, 100 and 200 week moving averages are starting to align into a bullish configuration, which often signals a transition into a medium term trend. Volume confirms the move. This is not an empty or purely speculative rally, but one supported by growing participation from longer term capital. Technically, this structure suggests trend continuation with potential for new highs as long as the current range is held.
From a fundamental perspective, Nebius has gone through a major transformation over recent years. Company revenue has increased multiple times compared to prior periods, while the income structure has become more diversified. The core contribution now comes from cloud solutions, infrastructure services and technology driven segments that continue to grow even in a challenging macro environment. EBITDA has returned to a positive trend in recent reporting periods, and operational metrics are improving due to cost optimization and a stronger focus on higher margin business lines.
Yes, the company is still in an investment phase and this is not a classic profit here and now story. However, revenue growth rates, business scaling and expansion of core segments provide a clear long term value setup. This is not hype. It is a bet on a technology platform that is only entering its value realization phase.
Tactically, I view NBIS as a growth stock where the market can continue higher without a deep correction as long as the current structure holds. While price remains above key weekly levels and moving averages, the bullish scenario stays valid. This is not a one day idea. It is a trend that is just beginning to form.
Sometimes the market already knows where the money is going, and in those moments it is better to listen to the chart rather than the headlines.

BlackBerry still encrypts, just not phones anymoreBB closed the week at 4.28. The weekly chart shows a symmetric triangle forming after a fully completed falling wedge. The key point is that price has already reacted from the 0.618 Fibonacci level near 4.00, which aligns with the highest volume area on the Volume Profile and a clear demand zone. A golden cross between MA50 and MA200 on the weekly timeframe adds strong confirmation to the medium term bullish structure. As long as price holds above 4.00, the setup remains constructive with upside potential toward 6.00 and 8.35.
On fundamentals as of December 14, 2025, BlackBerry continues its shift into cybersecurity and software solutions. Fiscal year revenue is around 1.05 billion dollars, with steady growth in IoT and QNX driven by automotive and industrial contracts. Cash reserves exceed 250 million dollars, debt remains limited, and management is focused on margin expansion and strategic partnerships.
BlackBerry is no longer chasing hype, it is quietly building infrastructure.Sometimes the quiet names move first.

SOFI 1D double checking the bill before the next moveSOFI is trading at 27.09 and may retrace toward 25.00, which is a strong demand area combining the 0.786 retracement level, a major VWAP node and a visible volume cluster. Since September 25 the price has been moving inside a broadening channel, signalling liquidity expansion. The 25.00 level remains a balance zone with proven buyers. The pullback from 32.73 looks like a structural retest.
Fundamentally SOFI stays strong as of December 11 2025. The company reports more than 8.2 million members and around 2.5 billion USD in annual revenue. The lending segment generates over 1.3 billion USD, and the banking division adds about 0.85 billion USD. Operating cash flow is positive. Recent news includes an expanded partnership with Mastercard, a new corporate credit platform and full Technisys integration.
As long as the price holds above 25.00, the bullish structure remains valid. A rebound from demand opens the path toward 29.20, 34.51 and 41.48. VWAP and volume behavior confirm buyer interest.
Fintech never avoids a plot twist. SOFI seems to be preparing one more dip before the next act.

CLEAR BUY TRADE This is an opportunity to the upside , and I am definitely sure it will hit take profit due to how I see the price movement and structure

EURJPY HIGH BLUES Eurjpy has managed to strike into take profit and it’s still within its trend , so there’s more potential

BUY LIMIT EURJPYLooking to be buying Eurjpy to it’s recent highs and also will use a buy limit to enter the trade

UP TREND BUY Eurjpy will be buying and it would be best to follow the trend to the up side and make sure to maximise profits have set a buy limit to catch the trend trade

USDJPY: Selling on lower timeframes as price retraces on the 4hTo better understand my current outlook on USDJPY, please refer to my previous higher-timeframe and fundamental analyses:
* Trend: assessed using at least three trend indicators, with market structure as the primary guide.
** Weak or Reversal Signals: Assessed based on one of our criteria for trend reversal signals.
*** Support/Resistance: Selected from multiple factors – static (Swing High, Swing Low, etc.), dynamic (EMA, MA, etc.), psychological (Fibonacci, RSI, etc.) – and determined based on the trader’s discretion.
**** Our advice takes into account all factors, including both fundamental and technical analysis. It is not intended as a profit target. We hope it can serve as a reference to help you trade more effectively. This advice is for informational purposes only and we assume no responsibility for any trading results based on it.
George Vann @ ZuperView

OKLO — when nuclear momentum breaks resistanceSince late 2024, OKLO had been consolidating inside a clear rectangle between $17 and $59. The breakout from this long-term range triggered a new bullish impulse. The price has since returned to retest the breakout zone, now aligned with the 0.618 Fibonacci retracement at $51.94. The retest has completed, and the price is bouncing upward, confirming buyer interest.
Technically, the trend remains firmly bullish. The price closed above the prior range, EMAs are aligned below, and the volume spike during breakout supports genuine demand. The volume profile shows a clean path toward $100, indicating limited resistance ahead. The structure suggests a controlled rally rather than an exhausted move.
Fundamentally, OKLO is a next-generation SMR (Small Modular Reactor) company focused on delivering compact, efficient nuclear power solutions. Following its public debut via SPAC and recent capital injection, OKLO is transitioning from development to implementation. Institutional interest is holding strong, and the broader move toward decarbonization and energy independence places the company in a strategic position.
Target levels:
— First target: $100 — psychological and technical resistance
— Second target: $143 — projected from prior range breakout
OKLO isn’t just another clean energy ticker — it’s a quiet disruptor with nuclear potential. The chart broke out. The volume confirmed. Now it’s time to see if the market follows through.

BULLS ON EURJPY Bulls seem to be regaining momentum and will lead us into a new high as the pressure causes price to increase, 174.000 is our new prove of interest in the overall trend

COOK IS COOKING PREMIUM!!Did you missed AIOT (10X)?
Did you missed BROCCOLIF3B (10X)?
NO PROBLEM!
Our brand new algorithm is able to identify this big moves!
Next big move is coming from COOK!!
With take profit at 0.04 and leverage maximum at 3X the profits will be insane!!
Are you the one which will follow us??
We will keep you updated if anything will change ..

BTCUSD SCALP Bitcoin scalp,I will be following the trend and keeping it simple with no indicators used for all these trades, will keep taking profits
GBPUSD 4H: retest done - bearish continuation beginsOn the 4H chart, GBPUSD has completed a textbook head and shoulders pattern. The neckline has already been broken, and the price is now finalizing a retest around 1.3365–1.3380, where the 0.5 Fibo level also lies. This confirms a trend reversal, with the market preparing for the next leg down.
MA and EMA are above the current price, adding pressure to the downside. RSI remains neutral, and volume is shifting in favor of bears. The key resistance zone at 1.3365 has been tested from below, and the price is beginning to roll over - a classic bearish continuation signal.
Targets: 1.3240 first, then 1.3150 and potentially 1.2 870 if momentum builds. The invalidation point is a close above 1.3365, which is not likely at this stage.
Fundamentals support the move: the dollar remains strong as the Fed holds its hawkish stance, while the UK economy continues to show weakness across services and manufacturing.
Neckline broken ✅
Retest done ✅
Momentum building ✅
The setup is complete — time to follow the structure.

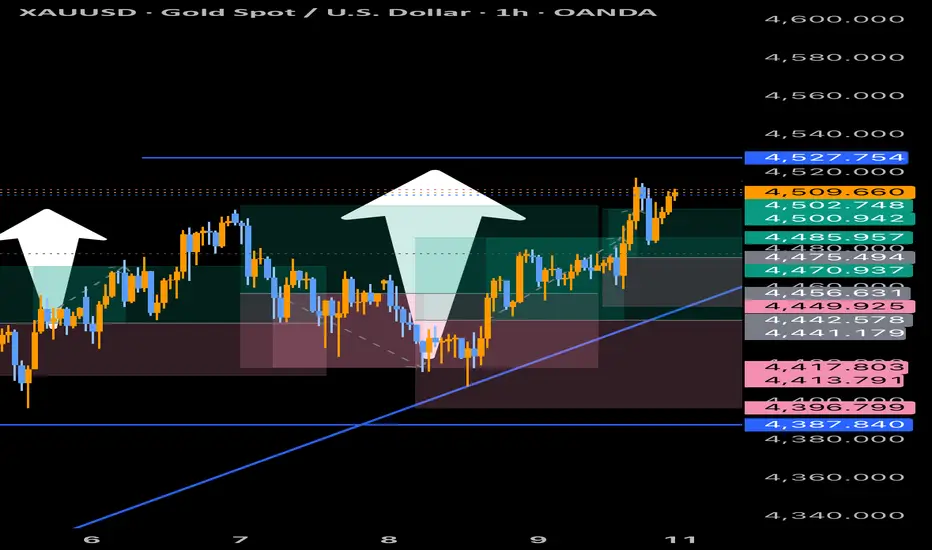
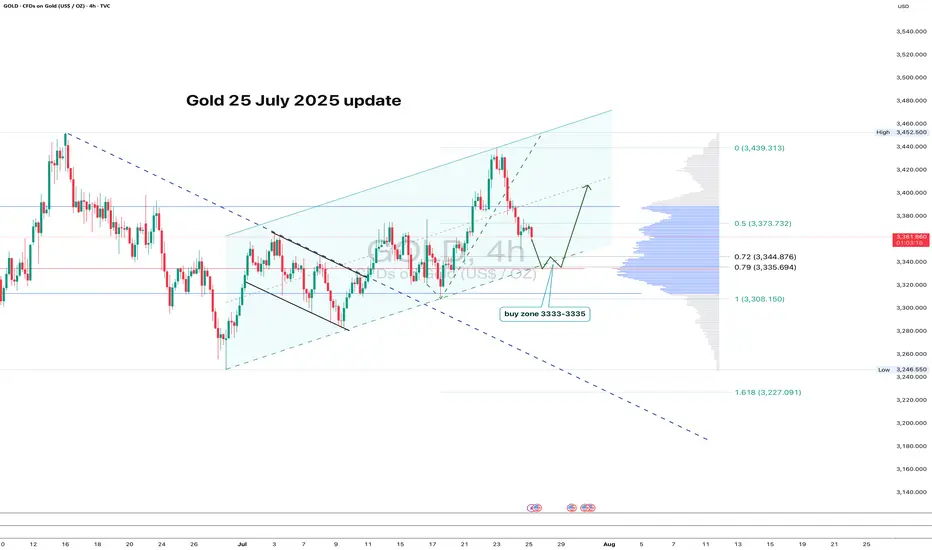
GOLD: clean pullback - now let’s see if support holdsGold continues to trade within an ascending channel on the 4H chart. After a local high, the price pulled back and is now approaching the key zone at 3333–3335. This area lines up with the 0.79 Fib retracement, the lower channel boundary, and a major volume cluster — a classic confluence zone.
If buyers show up here and we get a bullish reversal candle, this becomes a valid long setup with a tight stop just below the level. First target is 3373 (0.5 Fib), followed by a potential retest of the high near 3439.
The structure remains intact, the pullback is orderly, and volume supports the move. As long as the channel holds - the bias stays bullish.
AUDJPY 1D: breakout toward 100–105AUDJPY has confirmed an inverse head and shoulders breakout on the daily chart, with a strong move above the neckline. All key moving averages, including MA50 and MA200, remain below the current price — confirming bullish momentum. Volume increased on the breakout, and price has held above the 95.6 neckline zone. As long as that level holds, the setup remains valid. Targets are set at 100.36 (1.618 Fibo) and 105.19 (2.0 Fibo).

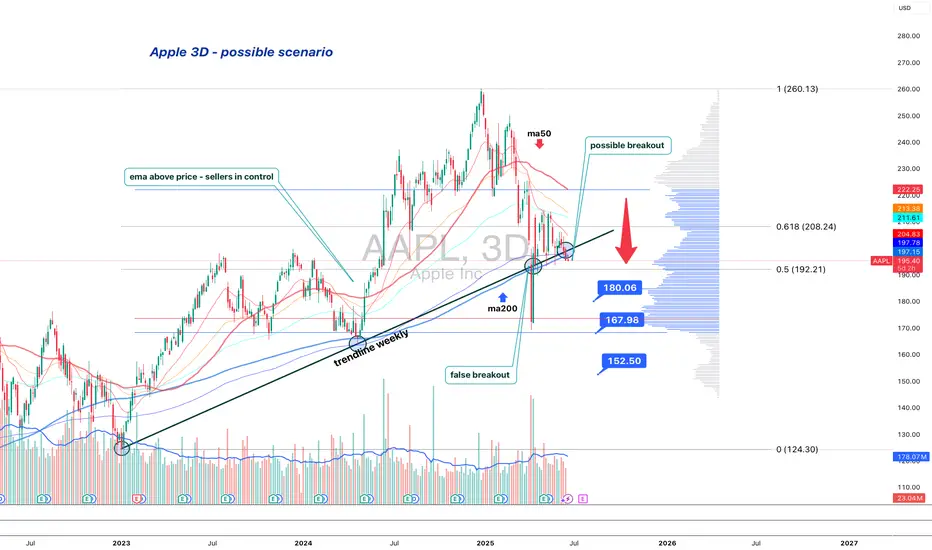
Apple is standing at the edgeApple (AAPL) is losing its long-term structure — second retest of the broken trendline suggests a bearish setup
On the 3D chart, Apple shows signs of structural breakdown. The weekly trendline from 2023 was broken and retested — twice. The price failed to regain it and now trades below, with candles showing weakness: low body closes, upper wicks, and no upside follow-through.
MA200 is now above price, and all EMAs are turning down. Volume Profile shows a heavy resistance block near $197. If the price remains below, sellers are in control.
Key levels:
— $192.20 = 0.5 Fibo support.
— Breakdown ➝ targets: $180 → $167 → $152.
Fundamentals:
Apple's recent reports show decelerating growth, weak China demand, and compressed margins. While AI buzz supports sentiment, institutional flow suggests distribution. BigTech may be topping out, and Apple is positioned for pullback.
Strategy:
Short below $196 with confirmation. Stop: $198. Targets: $180 / $167 / $152.
Failure to reclaim $192–197 = broken trend confirmed.
This is not a growth setup. This is where trends end — and profit-taking begins.
EUR/USD - 4H Analysis - High Probability Trade Setup🔍 Bias: Bullish continuation (Wave 5 setup)
📌 Key Confluences:
Wave (4) is retracing into a key demand zone with strong volume support.
Price is approaching the 71% Fibonacci retracement, a proven institutional entry level.
Ichimoku cloud is holding as dynamic support.
Wave (5) projection targets 1.1550–1.1600 zone (Swing Range).
🎯 Trade Idea:
Buy EUR/USD between 1.1280 – 1.1320
Stop Loss: Below 1.1220 (invalidates wave count)
Take Profit: 1.1550 (1:3+ RR)
⚠️ Risk Note: Confirmation via bullish engulfing candle or volume spike would increase the entry's conviction.
This setup offers strong confluence for a wave 5 rally, making it a high-probability long trade toward the upper swing range.
Follow along for more setups

AUD/CAD - Is this a turning point?!We are currently sitting at a very high-probability area for potential downside continuation!
🔎 Key Observations:
Elliott Wave Count: We have completed waves (1)-(3) and are currently finalizing a corrective wave (4) into a critical supply zone.
71% Fib Retracement: Price has retraced deep into a typical exhaustion zone for wave (4) setups — extremely common before the major trend resumes.
Supply Zone: Clear rejection visible near 0.90500 area; price is showing early signs of weakness.
MACD: Bearish cross aligned perfectly with supply pressure. Momentum indicators are favoring bears.
Volume Spike: High volume during the wave (3) selloff confirms real seller presence behind this move.
📈 My Plan:
Watching for bearish confirmation (weak candles, rejections) in this supply zone.
Expecting a potential wave (5) extension lower, targeting sub-0.82000s over the next several months.
Risk Management: Stops placed above 0.9100 structure if activated.
📢 Summary:
The trend is still bearish — we are just seeing a corrective rally.
Big money tends to load shorts on these pullbacks...
Don’t miss this potential monster setup! 🔥
💬 Drop a comment if you're watching AUD/CAD too!
🔔 Follow me for more high-probability setups each week!
#Forex #AUDCAD #ElliottWave #SupplyAndDemand #TradingSetup #SwingTrade #Bearish
Would you also like me to make a second version that's even shorter (for quick engagement) or one that sounds a bit more aggressive and hyped (depending on the style of your audience)? 🎯

Gold Price at a Crossroads: Awaiting the Next MoveCurrently, I foresee two possible scenarios for XAUUSD. In the more optimistic scenario (black label), the recent correction is assumed to be wave ii of wave (v), which suggests that XAUUSD still has the potential to strengthen toward the 3,177–3,306.
However, attention should also be given to the bearish scenario (red label). If XAUUSD fails to break above the 3,167 resistance level, it is likely that wave 3 has already been completed, and the current movement is part of wave 4. In this case, XAUUSD may decline toward the 2,489–2,832.
