Gold (XAU/USD) – Bearish SignalSell Setup Entry: Current levels / around ~5,260–5,263 (post-support breakout on 5m chart)
Target: ~5,233–5,240 (lower structure / previous low area)
Invalidation: Sustained reclaim above 5,273
Reason: Clear break below key support zone + elevated crash risk heading into tonight's FOMC decision (potential USD strength or risk-off move on hawkish tone / no-cut confirmation).Monitor closely around announcement for volatility spike.
#Gold #XAUUSD #Trading #Breakout #FOMC #Fed #GoldCrash #TechnicalAnalysisNot financial advice — Purely technical observation from the chart. Trading carries very high risk, especially around FOMC. DYOR and manage risk strictly.
Fomcnews

XAUUSD Smart Money Zones & Trade Plan — Nov 06, 2025🟡 GOLD ANALYSIS - Updated Nov 06, 2025
OANDA:XAUUSD Gold is consolidating between the $3,950–$4,020 range as the U.S. government shutdown delays key data releases.
DXY is weaker near ~100.15, while the Fed’s recent 25bps cut (3.75–4%) keeps markets uncertain about the next move.
Central Banks remain net buyers (+19t in August, +220t in Q3), led by Poland.
ETF inflows are supporting price while geopolitical tensions continue to fuel safe-haven demand.
🧭 SMART MONEY LEVELS (Valid Today)
🔻 SELL ZONES
• $4,025 – $4,037 → Smart Money Sell Area
• $4,015 – $4,005 → Scalp Sell Area
🔺 BUY ZONES
• $3,938 – $3,915 → Smart Money Buy Accumulation Range
Current Price: ~$3,990
📊 TECHNICAL OUTLOOK
• Holding above $3,950 maintains a mild bullish structure
• Break above $4,020 can retest $4,100
• Break below $3,915 may extend correction toward $3,900
🔮 Timing Insight
Between 22:00–23:00 UK Time, expect a potential bullish liquidity spike near buy zones.
📌 Conclusion
Gold remains in controlled consolidation with a bullish tilt.
Trade reaction to levels, not prediction.
Let liquidity guide entries.

The Ultimate GOLD & SILVER Outlook || 5 Trade Setups + FOMC UpdaWelcome to Trade with Decrypters!
📊 DETAILED & COMPLETE ANALYSIS (5 TRADE SETUPS) — Gold & Silver Outlook
1️⃣ Central Bank Buying
* Q1–Q2 2025 net: 410t (+15% YoY)
* August: +19t
* BRICS hold 6,000t (21% of global reserves)
* Top buyers: 🇵🇱 Poland +90t | 🇨🇳 China +35t
* Motive: USD hedge + BRICS 2026 currency prep
📈 Outlook: Sustained demand supports 10–15% long-term gold upside
2️⃣ ETF Inflows & Sentiment
* Q3 inflows: $26B | AUM $445B (+25% YoY)
* Holdings: 3,200t
* Asia: +37t | US: Neutral
* Gold RSI: 68 (Support: $3,800 | Resistance: $4,000)
* Silver RSI: 72 (Support: $32)
🎯 Projection: Gold → $4,000/oz (Q4, +1%) | Silver → $35/oz (+9%)
3️⃣ Macro & Geopolitical Events
* Fed cuts: 75bps → 3.75%
* USD: -8% | CPI: +3.2%
* Tariffs add +0.5% global inflation (→ 4.2%)
* BRICS trade pacts counterbalance USD weakness
* Gold already +57% YTD on 20% risk premium
📊 Outlook: Trade wars + Fed easing = 5–7% metals gain H1 2026
4️⃣ Silver Deficit
* 2025 deficit: 118M oz
* Supply: 1.02 Boz | Demand: 1.20 Boz
* Industrial share: 59% (EVs China +25%, Solar +30%)
* Recycling: 20%
📈 Projection: 150M oz deficit (2026) → Silver +15%
5️⃣ Futures & Options Flow
* CME Gold OI: 550k (+10% MoM)
* Silver OI: 180k (+8%)
* GVZ: 18%
* Call/Put ratio: 2:1 | Net long: 65k gold calls
📊 Outlook: OI rise + call bias = 20–25% vol breakout Q1 2026
🔮 Fundamentals & Forecast
* Gold: 450t CB buying + de-dollarization →
🎯 $4,200/oz (end-2025, +12%) | 🎯 $5,000 (2026)
* Silver: 118M oz deficit + 59% industrial →
🎯 $38/oz (end-2025, +18%) | 🎯 $60 (2026)
⚡ Drivers: Fed easing, 4.2% inflation, US deficit, BRICS shift → strategic metals outperformance
🏦 FOMC Update (Oct 29, 2025)
* Decision: 2:00 PM ET
* 98%+ chance of 25bps cut → 3.75–4.00%
* Powell press conference: 2:30 PM ET
* Dot plot & QT update expected
* Markets volatile → cut likely supportive for Gold, Silver, Stocks & Crypto
Disclaimer: This analysis is for educational purposes only. Not financial advice.

BTCUSD 30m – Bullish Continuation ExpectedBITSTAMP:BTCUSD
Structure | Trend | Key Reaction Zones
Price formed a strong base at 120,800, bouncing from the demand zone.
Accumulation structure confirmed, with multiple liquidity grabs before breaking the descending trendline.
Currently retesting breakout — bullish continuation likely if price holds above 123,200.
Market Overview
BTC has successfully broken out from a short-term bearish channel after sweeping liquidity from the lower side. The demand zone between 120,800–121,200 provided a solid foundation for buyers, signaling fresh momentum. Now retesting the broken trendline, and if held, we could see a continuation toward the upper supply zone.
Key Scenarios
✅ Bullish Case 🚀 → Bounce from 123,200 → 🎯 Target 124,500 → 🎯 Target 125,700 → 🎯 Target 126,200
❌ Bearish Case 📉 → Break below 122,000 → 🎯 Target 121,000 → 🎯 Target 120,000
Current Levels to Watch
Resistance 🔴: 124,500 / 125,700
Support 🟢: 123,200 / 121,800
⚠️ Disclaimer: This analysis is for educational purposes only. Not financial advice.

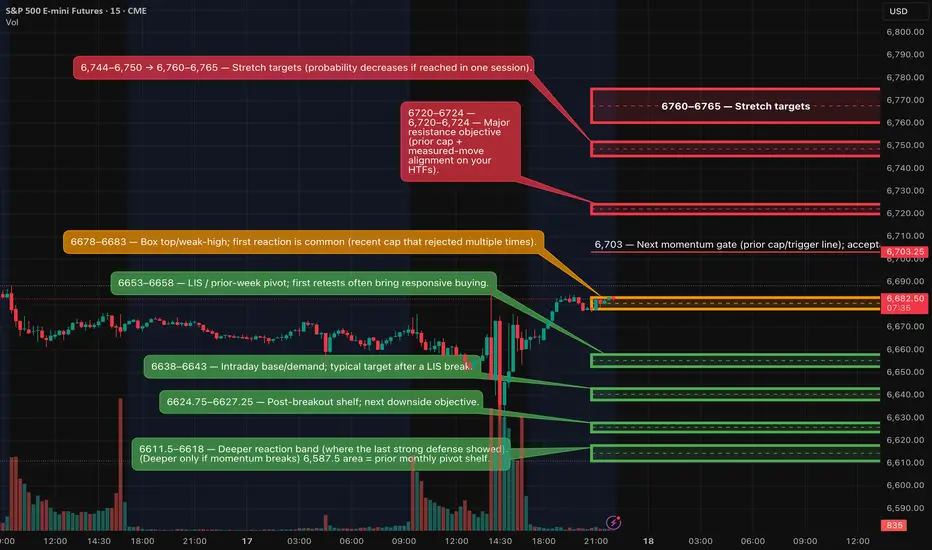
ES (SPX) Futures Analyses - Key Zones, Setups (Thur, Sep 17)Same map as last night.
Bias & structure
Price is pressing the box top 6,678–6,683 (1h AS.H 6,683.25) with a dense extension liquidity pocket above (D: 1.272 ≈ 6,763, 1.618 ≈ 6,856, 2.0 ≈ 6,959). We trade edge-only: fade a rejection at the top, or buy a sweep-and-reclaim at the control level.
Kill-zones (ET): London 02:00–05:00 (½–¾ size); NY AM 09:30–11:00; NY PM 13:30–16:00.
London (2 setups)
SHORT — Rejection Fade @ 6,678–6,683
15m tag → 15m close back ≤ 6,675 → 5m LH/re-close 6,672–6,674 → 1m LH entry 6,679–6,682.
Hard SL: above 15m rejection high +0.25–0.50.
TPs: 6,666–6,668 → 6,653–6,658 → 6,638–6,643.
Cancel if two 15m body-closes ≥ 6,685. Gate: TP1 ≥ 2.0R.
LONG — Sweep & Reclaim @ 6,653–6,658 (bias pivot)
Wick below LIS → 15m close back ≥ 6,658 → 5m re-close up 6,664–6,666 + HL → 1m HL entry 6,659–6,662.
Hard SL: below sweep low −0.25–0.50.
TPs: 6,678–6,683 → 6,703 → 6,720–6,724 (runner eyes 6,744–6,750).
U.S. (NY) (2 setups)
LONG — Acceptance Continuation > 6,683
Two 5m closes ≥ 6,685 (or one decisive 15m) → PB hold 6,679–6,683 flips to support → enter on 1m HL.
SL: under acceptance pivot −0.50–1.00.
TPs: 6,703 → 6,720–6,724 → 6,744–6,750 (→ 6,760–6,765).
Fail back below 6,679 on 5m = stand down.
SHORT — Breakdown & Failed Reclaim < 6,653
15m body close < 6,653 → retest fails (6,653–6,658 caps) → sell 6,651–6,654 on the fail.
SL: above fail-wick +0.50–1.00.
TPs: 6,638–6,643 → 6,624.75–6,627.25 → 6,611.5–6,618.
Back above 6,658 on 5m = invalidate.
Management (all plays)
First-touch priority; TP1 ≥ 2.0R gate using the 15m-anchored hard SL; no partials before TP1; at TP1 close 70% and set runner to BE; time-stop 45–60m if neither TP1 nor SL hits; max 2 attempts per level per session.
Fundamentals to respect (London → U.S. a.m.)
Bank of England MPC decision & minutes — Thu 12:00 BST (07:00 ET). High-impact for indices/GBP; often injects vol into London PM/NY open.
UK ONS releases — Thu 09:30 BST (04:30 ET) (e.g., housing affordability & Business Insights this week). Moderate.
U.S. Weekly Jobless Claims — Thu 08:30 ET (every Thursday; schedule page).
• Philly Fed Manufacturing Survey — Thu 08:30 ET.
• EIA Natural Gas Storage — Thu 10:30 ET.
BTCUSD – Watching 114 774 Support After Weekend TP HitWeekend bearish target was met and the first profit zone is complete.
Now the key is whether price can keep the 4-hour candle body above 114 774.
That level is the line in the sand.
I’ll look for 15-minute confirmation before any long entry.
New York open could give a sharp spike in either direction—stay alert.
Trade the reaction, not the prediction.

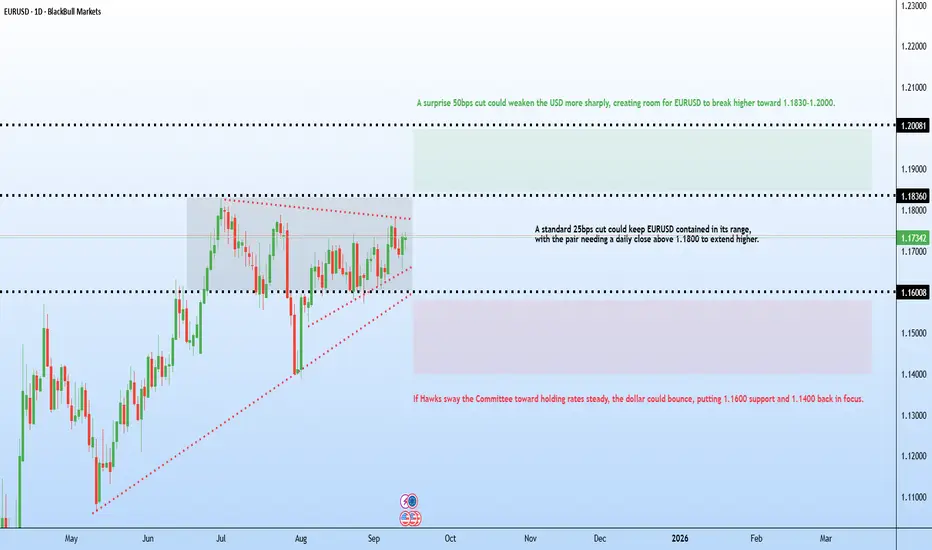
The countdown is on for the most anticipated Fed decision The Federal Reserve is widely expected to cut rates by 25bps to 4.00–4.25, with 105 of 107 economists surveyed by Reuters forecasting that outcome.
Still, the decision may not be unanimous. Some Committee members are not fully aligned on a September cut. Fed’s Goolsbee and Schmid could dissent in favour of leaving rates unchanged.
There is also a possibility of a larger move. If the U.S. Senate confirms Stephen Miran’s nomination to the Fed Board on Monday, he could be sworn in just in time for the meeting, and some speculate he may vote for a 50bps cut. Governors Bowman and Waller, who have previously dissented dovishly, may also support a larger reduction.
Gold Outlook: Macro, Bonds, and Geopolitics Driving the Rally
1. Labor Market Weakness → Fed Pivot Risk
The latest NFP showed just 22K jobs vs. 75K expected, with unemployment climbing to 4.3%. Revisions were deeply negative (-258K), confirming labor market deterioration. Historically, recessions often follow once unemployment rises 0.5–1% from cycle lows — we’re already in that zone.
This means the Fed is boxed in: growth is slowing but inflation is still sticky.
Markets are pricing in a September Fed rate cut, weakening USD and boosting safe-haven demand for Gold.
2. Bonds & Yield Curve Dynamics
US Treasury Yields have started to retreat as bond traders price in Fed cuts. The 2-year yield, which tracks Fed expectations, is easing from highs, signaling policy loosening ahead.
A steeper yield curve could emerge if short-term yields fall faster than long-term, historically bullish for Gold as opportunity cost declines.
Real yields (inflation-adjusted) matter most for Gold. With core inflation at 3.1% and slowing growth, if nominal yields fall but inflation stays sticky, real yields compress lower → Gold rallies.
3. Inflation & Stagflation Risk
Inflation is at 3.1%, above the Fed’s 2% target, while growth is slowing.
This is classic stagflation risk: weak labor + sticky inflation = policy paralysis.
For Gold, stagflation is one of the strongest bullish regimes: fiat currencies lose real value, while safe-havens gain demand.
4. Geopolitical Tailwinds
Tariff pressures and trade disputes are pushing input costs higher. Tariffs are inflationary and growth-negative — another stagflation driver.
Rising geopolitical tensions (trade wars, supply chain disruptions, regional conflicts) add a risk premium. In times of geopolitical uncertainty, central banks (China, India, Middle East) often increase Gold reserves as a hedge against USD exposure.
BRICS talk of de-dollarization is structurally supportive: even a small reserve shift from USD to Gold creates steady demand.
5. Forward Outlook
Near-term (1–3 months): Fed cut in September almost certain. USD likely to weaken further, Gold stays bid. Volatility spikes around CPI (Sept 11) and FOMC (Sept 17).
Medium-term (3–6 months): If inflation doesn’t fall below 3%, Fed may slow rate cuts, but Gold could still benefit from safe-haven + central bank buying.
Key Catalysts to Monitor: September CPI, Fed meetings, earnings season (margin compression risk), geopolitical escalations, tariff policies.

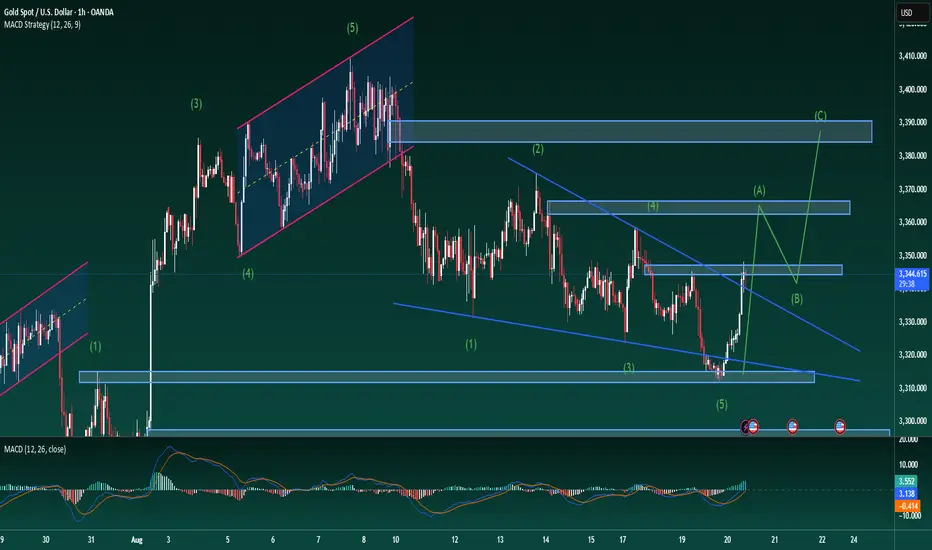
Gold Structure Shift – ABC Wave Taking ShapeGold Structure Shift – ABC Wave Taking Shape
Gold has completed its 5-wave decline under Elliott Wave theory and is now showing signs of recovery. This rebound is expected to mark the start of an ABC corrective phase, completing the overall Elliott structure.
The descending trendline has been broken, and medium-term timeframes have confirmed the move with strong closing candles, adding weight to the shift in market structure.
Attention now turns to the upcoming FOMC announcement. Traders are waiting for Chair Powell’s comments to see whether interest rate policy will shift in the midst of current market tensions.
The strategy remains to favour long positions. The newly formed H4 candle may retest 40–50% before continuing higher, providing an opportunity to enter fresh buys. Medium-term targets are set around the 3370–3380 zone.
Those holding long positions from earlier entries near 3316, as discussed in the previous update, should consider maintaining them. The recovery trend is strengthening, and well-managed positions could capture significant upside.
When market structure changes, new opportunities often follow. Staying patient and aligned with the corrective trend can offer the best results during this phase.
#XAUUSD #Gold #TechnicalAnalysis #PriceAction #ElliottWave #Fibonacci #Trendline #Forex #FOMC
BTC Update 4 Hour/ FOMC Day March 19, 2025, GAME PLAN!🚨 FOMC Day Update – March 19, 2025 🚨
BTC at ~$83,244 (+0.28%–1%) as markets stay cautious. Fear & Greed at 23, RSI at 44.05 = neutral momentum.
While BTC is trading below all significant EMs, 50 100 and 200, It has broken above the 21EMA which is bullish for the short term.
Fed likely to hold rates at 4.25%–4.50% (99% odds) – a surprise cut could ignite a BTC rally. Whale accumulation signals potential upside.
Sentiment data and whale accumulation hint towards a possible upside but only if FED surprises with a rate cut.
The current pump in the market will be short-lived if there's no change in the rates which is very likely.
So be careful with your longs and shorts.
Volatility will kill both bears and bulls.
You need to keep an eye on Powell’s 2:30 PM EST speech.
Inflation & liquidity outlook will shape BTC’s next move. Stay sharp!
I'll keep you updated.
Let me know what you think in the comments and do hit that like button if you like this post.
Thank you
#PEACE

Bearish Scenario If FOMC News Favors BearsFOMC interest rate news is due in less than 2hours .
I Stayed out of the market waiting since last Thursday just to wait for FOMC news because the market will almost always goes into consolidation days before this news due to its significant impact. So its usually a good idea to avoid getting chopped in the sideways action unless you like donating money to the market instead of waiting for a new trend to emerge or a continuation of the on-going trend.
After todays fomc news, we will know if we will resume dumping everything, or we'll evaluate potential short term bullish scenarios. For now, my recent BTC short analysis is still intact. I already took profit on all 8 short positions i was in on various coins i shorted along side BTC. If the FOMC news favors the bears, i'll be looking to re-enter shorts in the range 86.4k to 91k.

Gold is on Fire—But Can Bulls Hold the Line?Gold has been surging, and while I expected it to hit $3,000 this year, I definitely didn’t anticipate it happening in the first semester...
So, let’s address the big question: Can the bulls maintain this level?
Looking at the chart, since early March, TRADENATION:XAUUSD has climbed 2,000 pips (around 7%), but what stands out is that 1,500 of those pips (5%) came in just one week.
No matter how strong the bullish momentum and fundamentals are, I believe this kind of rally is unsustainable.
Technical Outlook
After pulling back from its all-time high of 2,950, gold made a false breakout, followed by an almost vertical move upward, briefly interrupted by two consolidation phases.
Fundamental Factors
The FOMC meeting is today, and while rates are expected to remain unchanged, the real market mover will be Jerome Powell’s press conference. His comments could trigger significant price action.
My Take
I expect gold to start correcting after the press conference, regardless of what Powell says. However, this is a highly risky trade, so I’ll stay on the sidelines until I see a clear reversal signal.
Final Thoughts
At the time of writing, gold is consolidating within another rectangular range, with resistance at 3,040. If we see a spike above and then a drop back to around 3,030, that would signal ( for me ) that gold has topped—at least for now. In that case, I’ll be looking to short with a target of at least 500 pips. Until then, my approach is simple: wait and see.
Disclosure: I am part of Trade Nation's Influencer program and receive a monthly fee for using their TradingView charts in my analyses and educational articles.

Short on EUR/USD as order block is now being formedWe have a liquidity sweep and order block forming on the upside. As we look for the break below equilibrium and a full break of structure we will short and target previous lower levels of liquidity. Keep in mind news is strong this week with FOMC on wed. and Unemployment on Thur.

USDJPY SHORT: FOMC ON TAP! We expect the FED to lower rates as expected. We could see the dollar become weaker against the Yen if we do not get any unexpected surprises today from the FED.

The markets aren't DEAD yet! Stock Market Analysis 🚨 Stock Market Analysis🚨
In this video we will be going over:
-What happened on the NASDAQ:QQQ AMEX:SPY AMEX:IWM
-FOMC Meeting and Chair Powell's Speech
-Economic outlook and recent numbers
-Technical Analysis
When in doubt ZOOM OUT! 👇

Sept 19 2024 Buy TRADE GBPUSDThis was taken at around 12PM EST. Buy limit activated because of IMB price touch. I was waiting for this buy trade since yesterday because daily and 4h structure of GBPUSD was bullish.
Demand introduced last Monday and then continue going up to the supply yesterday ( Tuesday) . This was a textbook entry of bullish structure.
RR: 1:7
50,000 USD FTMO Account.
#supplyanddemand

Fed RatesWith cooling of the labor market as the new priority and an objective of incentivizing borrowers without hurting creditors, the fed is likely to drop interest rates by 25 basis points which should set BTC on slight downtrend.

Gold will Bounce Today!For tomorrow, the resistance areas are: 2509 and 2510.The buying level expected for today are 2512 or 2513. And also could from the resistance area. These levels will perform tomorrow, and we should also keep an eye on geopolitical events. Additionally, tomorrow we have Unemployment Claims news affecting us.

Ready to another short position on usdindexHi there,
As you are watching we expect to support DXY price to go up and after that we will take sell position until 104 and below with triger in H1 timeframe.
So:
Sell it at105.3
TP 104.5 - 104
SL 106.1
Be careful this position has low risk but we should risk free it immediately.
Be success guys:-)

GOLD / XAUUSD UPDATE !!!!www.tradingview.com
The gold market is currently in a holding pattern, with traders reluctant to make premature decisions due to upcoming significant news. A consolidation below the level of 2315 is observed.
A false break of support has led the price to retest the 2310-2315 range, after which traders are pausing before the news release. All attention is focused on the forthcoming major events, namely the CPI and the Fed meeting. The key US CPI data will influence the Fed's stance on interest rates, which will, in turn, significantly affect the value of the US dollar and gold prices in the short term. The market anticipates neutral data (no change), which would likely maintain the same fundamental backdrop. However, the actual data is highly anticipated, especially after last Friday's unexpectedly high NFP.
Any initial reaction to the US CPI data might be short-lived as gold traders will soon turn their attention to the FOMC & Fed meeting.
Resistance levels are identified at 2315, 2325, and 2354, while support levels are found at 2305, 2291, and 2267.
From both a technical and fundamental perspective, gold appears weak at the moment. Amidst high volatility, the price may attempt to breach 2325 and test the liquidity zone of 2335-2345, then transition to a decline phase if the fundamental backdrop is conducive. The risk of further decline remains substantial, but the upcoming news could either exacerbate this decline or disrupt the market structure.

Gold 2h FOMC routemap!Hello traders I hope you guys are doing great today in fomc meeting I am going to buy gold because of the following reason gold is it on there support point and I am seeing a good momentum in buy till 2423 because if buy trend in the kariet trend is your friend :)

EUR/USD Analysis Summary:Price & Pattern: EUR/USD at 1.08397. 4H chart shows double top rejection, followed by resistance breakout—bearish indication.
Technical Implications: Pattern suggests potential bearish reversal, favoring sellers.
Demand Zone: Approaching demand zone, but bearish bias persists.
FOMC Impact: Pending FOMC news could strengthen USD (DXY index)—further downside pressure on EUR/USD likely.
Anticipated Movement: Downside risk prevails, especially post-FOMC, aiming for bearish targets.
If you like my idea please boost comment and follow for more informative ideas thanks for support

Yemi_Fx1 | Short Setup on AUDUSDOn AUDUSD we can see an overall bearish structure. Internally price has been moving in a series of impulse/ correction.
Price is going in it's correction phase now.
We may see a pull-back to the area of value before committing to the downside.
I will be taking an entry at the top of the validated flag pattern.
Please share your view of this pair in the comment section .
