BTC AI Prediction Dashboard - 6h Price Path (02.09.25) Prediction made using Crypticorn AI Prediction Dashboard
Link in bio
BTCUSDT Forecast:
Crypticorn AI Prediction Dashboard Projects 6h Price Path (Forward-Only)
Forecast timestamp: ~06:30 UTC
Timeframe: 15m
Prediction horizon: 6 hours
Model output:
Central estimate (blue line): -110,335
Represents the AI’s best estimate of BTC’s near-term price direction.
80% confidence band (light blue): 110,066 – 110,877
The light blue zone marks the 80% confidence range — the most likely area for price to close
40% confidence band (dark blue): 109,844 – 111,422
The dark blue zone shows the narrower 40% confidence range, where price is expected to stay with higher concentration
Volume on signal bar: 181.86
This chart shows a short-term Bitcoin price forecast using AI-generated confidence zones.
Candlesticks reflect actual BTC/USDT price action in 15-minute intervals.
This helps visualize expected volatility and potential price zones in the short term.
Forecastingtechniques

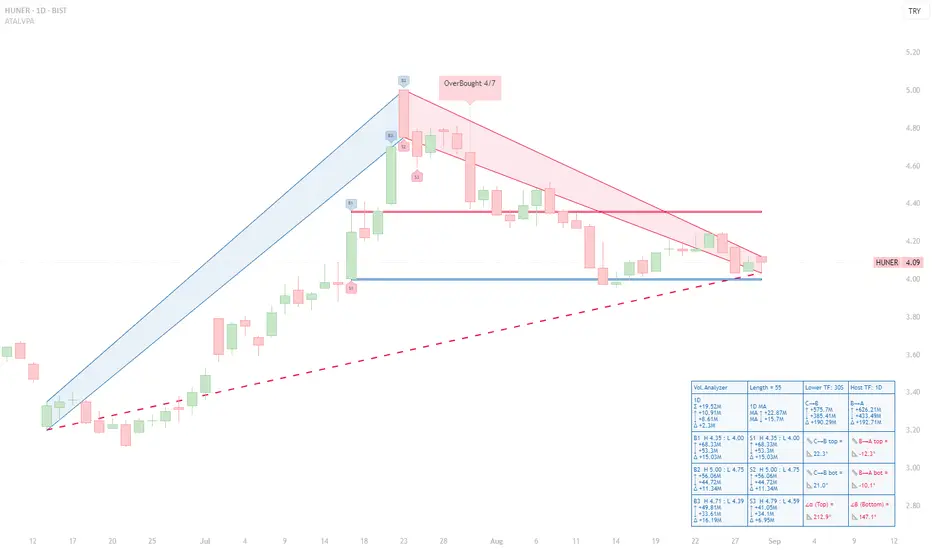
HUNER (1D) — Seller Bias After OB Cluster; Descending BA SlopesHUNER (1D) — Seller Bias After OB Cluster; Descending BA Slopes, 4.00 Support Under Test
Executive read (VPA, 55-bar window)
◉ OB/OS: An OverBought 4/7 tag printed at the apex; no confirmed OS on the right edge. That OB cluster preceded the entire red B→A leg and frames the current risk.
◉ Ranked volume peaks (Top-3):
- B1 (H 4.35/L 4.00) ↑ 68.33M, ↓ 53.3M, Δ +15.03M.
- B2 (H 5.00/L 4.75) ↑ 56.06M, ↓ 44.72M, Δ +11.34M.
- B3 (H 4.71/L 4.39) ↑ 49.81M, ↓ 33.61M, Δ +16.19M.
- S3 (H 4.79/L 4.59) ↑ 41.05M, ↓ 34.1M, Δ +6.95M.
Takeaway: Buying peaks were heavy, but subsequent price action failed to sustain higher highs; sellers have since controlled the B→A leg.
◉ Segment diagnostics:
- C→B advance: top/bottom slopes +22.3° / +21.0° → mature but constructive.
- B→A decline: top/bottom slopes –12.3° / –10.1° → persistent downside pressure.
- Orientation at B: α 212.9° (red) / β 147.1° (red) confirm the bearish state of the current swing geometry.
◉ Levels & structure:
- Support: the S1 low ≈ 4.00 is the active horizontal shelf repeatedly defended.
- Resistance: 4.35 (B1/S1 pivot), 4.71–4.79 (B3/S3 band), then 5.00 (B2). The descending B→A trendline caps bounces before these levels.
Actionable interpretation (educational):
Bias stays bearish-to-neutral while price trades beneath the B→A upper line and below 4.35. A credible shift would require (i) a fresh B-ranked bar with positive Δ near the right edge, and (ii) a close back above the B→A top. Failure to reclaim 4.35 after bounces leaves 4.00 vulnerable; a daily close below 4.00 would validate extension into the S-zones. Conversely, an OS print near 4.00 coupled with flattening BA slopes would set up a tactical mean-reversion toward 4.35 → 4.71/4.79.
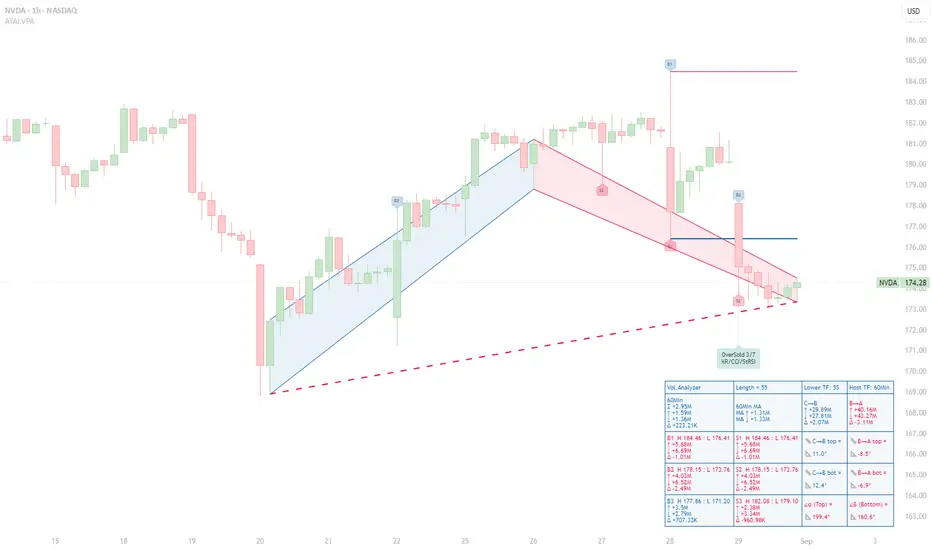
NVDA Under Pressure: Sellers Dominate as Volume Spikes Fail NVDA Under Pressure: Sellers Dominate as Volume Spikes Fail to Sustain Price Gains
Context – This 60‑minute NVDA chart uses the ATAI Volume Pressure Analyzer (VPA) on a 55‑bar window. The indicator plots an A→B→C structure: the blue C→B segment tracks the preceding advance and the red B→A segment the subsequent pull‑back. Up‑volume and down‑volume are calculated on a lower time frame and then aggregated into host‑time‑frame bars to expose buying and selling pressure.
Volume ranking – Within this window the indicator labels the three largest buying and selling bars (B1–B3 and S1–S3) and reports their statistics in a HUD. The most prominent bar, B1, spans H 184.46 to L 176.41 and shows 5.68 M up‑volume versus 6.69 M down‑volume, producing a –1.01 M delta. B2 (H 178.15–L 173.76) is even more bearish, with 4.03 M up‑volume and 6.52 M down‑volume (delta –2.49 M). B3 (H 177.86–L 171.20) is the only buying bar with a positive delta: 3.50 M up‑volume, 2.79 M down‑volume and a +0.71 M surplus. On the sell side, S1 and S2 coincide with B1 and B2 and mirror their negative deltas. S3 (H 182.08–L 179.10) registers 2.38 M up‑volume against 3.34 M down‑volume for a –0.96 M delta. Collectively, the pattern shows that peaks in buying volume have not yielded higher closes; sellers control all but one of the ranked bars.
Segment behaviour – The C→B rally accumulated roughly 29.89 M up‑volume versus 27.81 M down‑volume, a modest +2.07 M delta. In contrast, the B→A decline logged 40.16 M up‑volume against 43.27 M down‑volume, giving a –3.11 M deficit. The slopes of the trend lines accentuate the story: the advance has gentle positive slopes (~+11° top, +12.4° bottom), whereas the pull‑back slopes downward (–8.5° and –6.9°). Sellers have pushed prices lower more decisively than buyers previously drove them higher.
Price structure and implications – Price currently trades around 174.28 USD. Resistance sits near 178.15 (B2/S2) and 184.46 (B1/S1). As long as price remains beneath these pivot highs and subsequent B‑ranked bars fail to show a positive delta, the selling bias persists. The red dashed guide, connecting recent lows, continues to slope downward, confirming the bearish tilt. Only a flattening or reversal of this guide—coupled with a new B‑ranked bar sporting a positive delta—would hint at a shift in momentum.
Risk management – This analysis is intended for educational purposes. It illustrates how separating up‑ and down‑volume on lower time frames can reveal hidden pressures in intraday charts. It is not a recommendation to buy or sell NVDA stock. Always consult your own trading plan and risk tolerance before acting.
Seller Strength Evident as Volume Peaks Fail to Propel Price HigAnalysis
Context – This 1D chart uses the ATAI Volume Pressure Analyzer to study the A→B→C structure over the last 11 trading sessions. Segment C→B captures the advance (blue), while B→A captures the subsequent decline (red). Each bar’s up‑ and down‑volume is measured on a lower timeframe to detect buying and selling pressure.
Volume ranking – Within this 11‑bar window, the indicator identifies the three largest buying (B1–B3) and selling (S1–S3) bars. Although the B1 bar shows the highest buying volume (~10.29 M units), its selling volume (~12.52 M) exceeds buying, resulting in a negative delta of ‑2.23 M. B2 is the only buyer bar with a positive delta (+1.87 M), while B3 again shows sellers in control (‑0.90 M). The seller bars S1–S3 all display net negative deltas, with S3 registering the heaviest selling (‑4.03 M). This pattern shows that peaks in buying volume are not producing higher closes and that sellers are consistently overwhelming buyers.
Segment behaviour – The C→B segment (the rally) totals approximately +28.9 M up‑volume versus +36.7 M down‑volume, a net deficit of about ‑7.74 M. The subsequent decline (B→A) is even more one‑sided: +26.9 M up‑volume versus +41.4 M down‑volume, yielding a ‑14.5 M delta. The slopes of the segment trend lines reinforce this narrative: the rise from C to B has a shallow positive slope (~ 5° on the upper line), whereas the decline from B to A has a steeper negative slope (‑12° on the upper line). Sellers are pushing the price lower more aggressively than buyers previously pushed it higher.
Price structure – Price currently trades near TRY 3.45,where resistance resides near the recent pivot highs around TRY 3.65 and TRY 3.73 (where B1 and S1 occur). As long as the price remains below these levels and buying peaks fail to translate into higher highs, the bearish bias remains. The red dashed line is not a fixed support; it dynamically connects the lows of the current C→A leg and updates with each new candle’s low. Its red colour confirms the bearish slope of this segment. As long as this guide remains red and slopes downward, the downtrend is intact. A meaningful sign of shifting momentum would be a flattening or reversal of this guide (e.g., changing colour) accompanied by a new B‑ranked bar that shows a positive delta.
Risk management – This analysis is provided for educational purposes and does not constitute investment advice. Always consider your own risk tolerance and trading plan before entering a position.

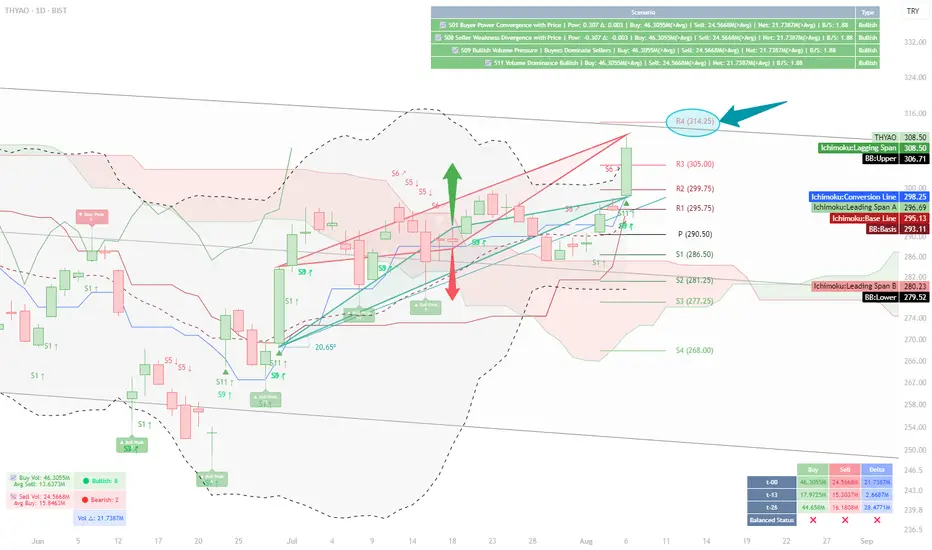
Volume and Structural Analysis of THYAO — Reaching Resistance at📝 Analysis:
My initial focus in this chart was on the daily buy and sell volumes.
According to the table displayed at the bottom of the chart for August 6th:
Buy Volume (t-0): 46.305M
Sell Volume (t-0): 24.566M
These values show a clear increase compared to previous checkpoints (t-13 and t-26).
Notably, the buy volume is 28.3M higher than t-13 and about 1.6M higher than t-26.
This gives us a broader picture: buying strength remains dominant, even though delta volume has not surpassed its value at t-26 (still about 7M short). Nevertheless, the current volume levels show stronger positioning compared to the mid-term past.
On the upper-right side of the chart, four system-based scenarios have been triggered via our custom indicator:
✅ Scenario 01 – Buyer Power Convergence with Price
✅ Scenario 08 – Seller Weakness Divergence
✅ Scenario 09 – Bullish Volume Pressure
✅ Scenario 11 – Volume Dominance Bullish
Together, they present a market that is tilting in favor of the buyers, with bullish sentiment supported by volume structure.
Next, my attention shifts to the triangle formations on the chart, which were automatically plotted based on cross high/low logic.
🔺 The green ascending triangle, with a slope of 20.65°, indicates a healthy and steady bullish structure.
Its top has not yet reached the resistance zone, where the red triangle forms a descending structure aligned with the R4 level at 314.25.
Beyond the technical interpretation, I also look at triangles symbolically.
Throughout history, from the Seal of Solomon (Star of David) to the Egyptian pyramids, triangles have represented stability, energy focus, and a path upward.
In this chart, that symbolism holds true — the green triangle embodies a progressive, rising support, while the red triangle offers a calculated obstacle.
What’s intriguing is the parallel structure of the triangle bases — suggesting a balanced energy field, ready to be tipped by momentum.
📊 When combined with other indicators:
Price is above the red Ichimoku cloud
It sits in the upper zone of the regression channel
Bollinger Bands show an upward breakout bias
Daily pivot levels align with this structure, and the R4 level (314.25) becomes a relevant resistance to monitor
📍 Conclusion:
Given the alignment of structural elements and volume behavior,
a move toward the resistance at 314.25 is well within reach under current market dynamics.
⚠️ This analysis is based on a custom-built indicator named Volume Based Analysis V 1.4+ and is provided strictly for educational and analytical purposes.
No investment or trading advice is intended.
👥 I welcome your interpretations and experiences —
Do you also see 314.25 as a realistic target?
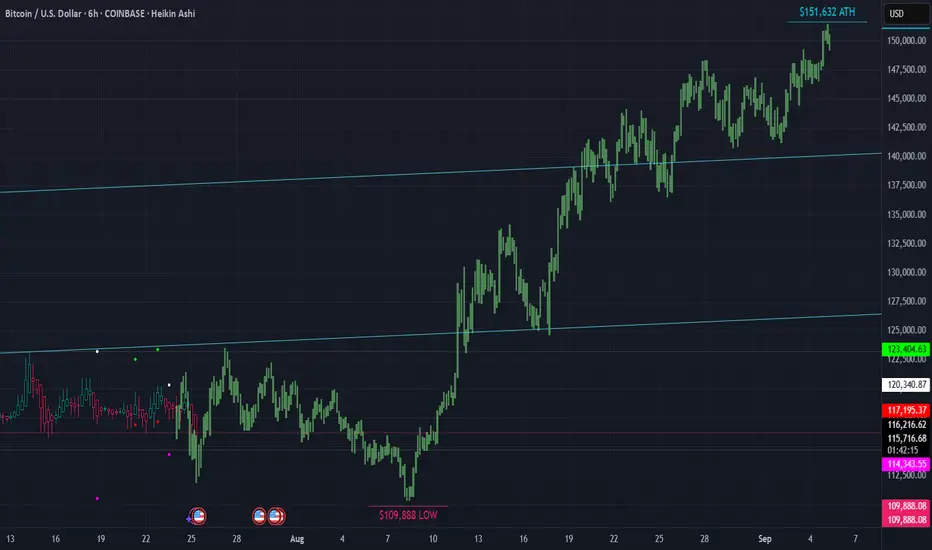
▒₿▒ BITCOIN FORECAST | 6HR ▒₿▒Hello @everyone. Long time. . . I was on a 3 year spiritual journey. I am back now and have many good things in the works. Who took my (non-financial) advice 3 years ago when I called the low of $15K a year in advance? And who believed me that it would go to $150K once we hit that $15K low? Who believes me now? Are you still thinking we've topped? Or do you think we have our $150K target in sight?
Have a look at this 6 HR Forecast. We have a low coming around AUG 8TH at $108K. And the most notable ATH of $151K around SEPT 5TH.
This is it. The playbook years in advance. I have never asked for anything or tried to sell you anything. It's all been done from a position of "paying it forward". Please, if you've taken my advice do the same.
I first bought Bitcoin in 2011. Was part of the MT GOX hack. And have had many ups and downs since then. One thing has never changed. . . And that is that Bitcoin is King. It's an asset class and a hedge against inflation. We're seeing this happen more now than ever. It's only got inflation as the halvings continue. The inflation rate of Bitcoin since/after this last halving is 0.84%. Bitcoin is up over 120-Million percent since 2011. Look at the BTC 6 MONTH candle chart and you'll see what Crypto asset you want to be in. Bitcoin is the only crypto asset.
When I first bought BTC it wasn't possible to purchase on an exchange with a debit card. I had to buy Linden Dollars from "Second Life" (which didn't always work because I had to deal with International Payment Processors due to US restrictions), then convert them to BTC on Mt Gox. Hardware wallets were not a thing. Now you can setup your bank account to auto buy on Coinbase and others. It's easier than ever. Store your coins on a hardware wallet and stay protected from the next FTX or hack.
This is the asset of the future. The "Digital Gold". I've seen the future and it runs on Blockchain and digital/virtual currency. A Super Artificial Intelligence will run and optimize all of our systems. Voting, assets, deeds, ownership and more will all be on a public blockchain ledger.
DEMATERIALIZATION/VIRTUALIZATION
INFORMATION & MEDIA
Music
We had music being played using metal, tin and wax in the 1800's, then mid 1900's we went to Vinyl and later in the late 1900's we went to plastic cassettes. And in 1990 - 2000 we had the CD which used laser optics to play the music. Effectively digitizing it. Then of course the MP3 player which was the next evolution in digitization. But where are we now? We are still in a type of digitization however it's evolved also. We are in a virtualization, where the music is not stored on the device itself, it's stored on servers which host the data to be accessed in the cloud/virtually.
You see the progression?
Metal/Wood > Vinyl/Plastic > Plastic/Digital > Metal/Digital > Virtual
(Or even further simplified on a higher level it would be Thoughts > Things > Digital > Virtual >)
What else has taken this path?
Movies
Metal/Wood - Film Projectors & Metal Reels
Plastic - Video Cassettes
Plastic/Digital - Optical Discs
Metal/Digital - Personal Digital Devices
Virtual - Cloud-Based Streaming
Books & The Written Word
Metal/Wood - The Printing Press
Paper/Plastic - Paperback Books
Plastic/Digital - Digital Archives on Discs
Metal/Digital - Handheld E-readers
Virtual - Cloud Libraries & Audiobooks
Money & Finance
Metal/Wood - Gold & Silver Coins (and even wooden coins)
Plastic - Payment Cards
Plastic/Digital - Secure Chip Cards
Metal/Digital - Mobile & Digital Wallets
Virtual - Digital/Crypto Currencies
This is the natural progression path. Are you the one still listening to cassette tapes while the MP3 player exists? Are you still using a physical thing while the virtual exists? (Nostalgia aside.)
NOW IS THE TIME!
Gold has been virtualized and it's called Bitcoin. While trading at 1,200,000 times more than it was 14 years ago it still has not yet realized it maximum value. In the past Gold and Silver were taken and bank/promissory notes were given in exchange. In fact it became illegal to not exchange your Gold and Silver for Dollars in the US. (1933 with the issuance of Executive Order 6102 by President Franklin D. Roosevelt.) The Dollar has no cap and is no different than Doge in that sense. BTC has a cap and a proof of work concept just like Gold. If you need to pay for things convert your BTC when you need to but holding or planning on making money off any other crypto currency that does not provide a base layer for our new virtualized financial infostructure it will not happen.
BITCOIN IS FINANCIAL LIBERATION FOR YOU, YOUR FAMILY, FRIENDS AND LEGACY.
BTC is up 3,000% in the past five and half years alone.
That's a 5.45 X Multiple per year. 545% growth rate compared to the unlimited and inflationary Dollar. Why not setup a reoccurring dollar cost average automatic purchase? We live in a day of virtualized programable currency, why not convert vapor currency to digital gold with the few clicks?
I am not a financial advisor. I am a Bitcoin Maximalist. Trade at your own risk. Assume your own responsibilities.
I have a big project I'm working on right now but also working on some TV Indicators in the background. I will share them with you all once I'm done testing them.
DISCLAIMER
I AM NOT A FINACIAL ADVISOR, NOR AM I YOURS. THIS IS NOT FINANCIAL ADVICE. MEARLY DOODLINGS ON A MATHMATICALLY DRIVEN GRAPHICAL INTERFACE, TRACKING AN INVISIBLE 256BIT MILITARY-GRADE ENCRYPTED ASSET. . . FOR ENTERTAINMENT/AMUSEMENT PUROSES ONLY. ENJOY!
03.07.25 Morning ForecastPairs on Watch -
FX:EURUSD
OANDA:XPTUSD
FX:CADJPY
PEPPERSTONE:HK50
A short overview of the instruments I am looking at for today, multi-timeframe analysis down to what I will be looking at for an entry. Enjoy!

S&P500 will start to riseAsper Elliott wave forecasting the current 4th wave ended this week.
A new wave will begin as 'c5' during 1'st week of April and it may be the climax rally.
Validity of this wave count holds good as long as last weeks low respected.
Traders can initiate long with 5500 as strict stop.
The target will be reached swiftly

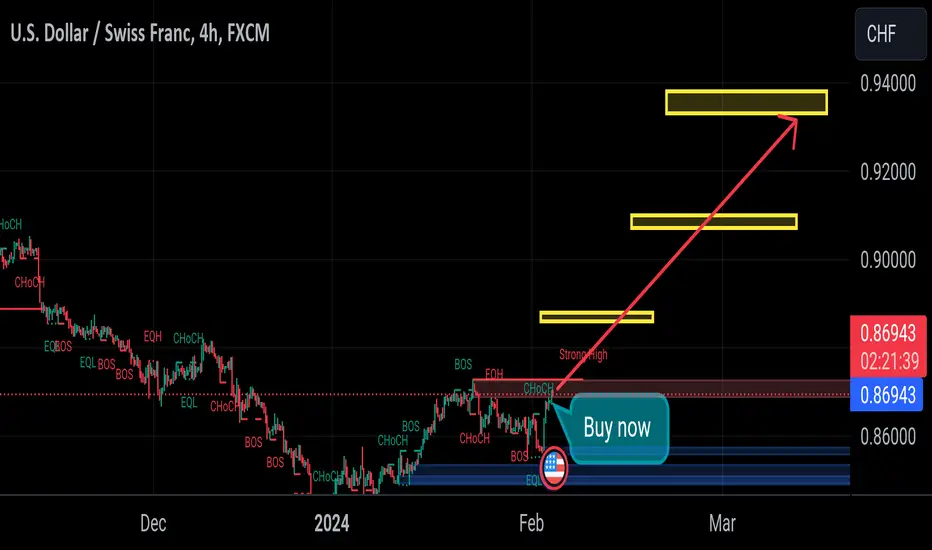
SELL CHFDouble Top Formation 📉 | CHF Poised to Weaken Across All Pairs 💱
The Swiss Franc (CHF) is showing a classic double top pattern, signaling a potential bearish trend. The structure is solid, aligning with technical analysis principles, and suggests a decline in CHF value against major currencies. 🌍
💡 Key Highlights:
Double top formation: Indicates strong resistance and potential reversal.
Big positive swap: Holding positions yields positive returns, making this setup even more attractive.
Bearish sentiment: CHF expected to weaken, offering opportunities for traders across all currency pairs.
📊 Watch for confirmations to validate the setup before entry! Perfect time for strategic planning. 🚀

14.02.25 Morning ForecastPairs on Watch -
FX:AUDUSD
FX:GBPUSD
FX:EURAUD
A short overview of the instruments I am looking at for today, multi-timeframe analysis down to what I will be looking at for an entry. Enjoy!

12.02.25 Morning ForecastPairs on Watch -
FX:GBPAUD
FX:USDJPY
A short overview of the instruments I am looking at for today, multi-timeframe analysis down to what I will be looking at for an entry. Enjoy!

04.02.25 Morning ForecastPairs on Watch -
FX:NZDCAD
A short overview of the instruments I am looking at for today, multi-timeframe analysis down to what I will be looking at for an entry. Enjoy!

ETH | C&H | $8k+++☕The C&H Pattern With a Little Tilt to It💧
This chart showcases how we can grab forecasted targets using chart patterns similarly to my other postings and how we can use these patterns to our convictions
BITSTAMP:ETHUSD is currently still trading within the falling wedge pattern and will play a big role into being the cause of the C&H breakout
As shown on the chart we can see the main trendline target in orange somewhat lines up with fib extension and C&H trajected target which creates a great confluence in forecasting what's next to come
After price makes it's way to breakout at the upper trendline we should see a push towards $4,800 in the acts of a Pullback Trigger and Not Permanent Resistance
Price action doesn't go in a straight line forever so we'd have to see a cool off period retesting atop from the breakout (SnR) for a second point contact to launch price further, the first point contact is where we are now, and by adding a SMA or EMA this will allow for optimal accumulating zones
The red squares are the major and minor pivot points to calculate the levels for the Fibonacci extensions and also line up with Fib Channel which was measured from the base structure (main trendline in orange).
Follow to stay tuned on what price action will do next after this hopefully plays out🚀

29.01.25 Morning ForecastPairs on Watch -
FX:GBPNZD
FX:EURGBP
FX:AUDUSD
FX:EURUSD
A short overview of the instruments I am looking at for today, multi-timeframe analysis down to what I will be looking at for an entry. Enjoy!

15.01.25 Morning ForecastPairs on Watch -
FX:NZDCAD (Live)
FX:EURUSD
FX:GBPAUD
FX:NZDJPY
A short overview of the instruments I am looking at for today, multi-timeframe analysis down to what I will be looking at for an entry. Enjoy!

07.01.24 Morning ForecastPairs on Watch -
FX:USDJPY
FX:EURNZD
FX:NZDJPY
OANDA:UK100GBP
A short overview of the instruments I am looking at for today, multi-timeframe analysis down to what I will be looking at for an entry. Enjoy!

A new US stock in our watch list: CPRT👋Hello Traders,
Our 🖥️ AI system detected that there is a H4 or higher timeframe, a Breakout in
CPRT for swing trade (a couple of weeks)
Here is a swing trade idea (since it is near support surface, we should use small lot size)
Please refer to the details Stop loss, Buy Zone,open for take profit.
We are waiting for next Long setup after price discount in coming days.
Boosting stock is highly risky, please do your own research on that coin before trading.
For more ideas, you are welcome to visit our profile in tradingview.
Have a good day!
Please give this post a like if you like this kind of simple idea, your feedback will bring our signal to next better level, thanks for support!

SOLUSD is a tradingSOLUSD is a trading pair that represents the price of Solana (SOL) cryptocurrency in US dollars (USD). It's available on various cryptocurrency exchanges, allowing traders and investors to buy, sell, or trade SOL using USD.
Here are some key fundamentals to consider when analyzing SOLUSD:
SOL (Solana) Fundamentals
Technology: Solana is a high-performance blockchain platform known for its fast transaction speeds and low fees. It uses a unique Proof-of-History (PoH) consensus mechanism to achieve this.
Scalability: Solana's design aims to handle a large number of transactions per second, making it suitable for various decentralized applications (dApps).
Ecosystem: Solana has a growing ecosystem of dApps, including DeFi protocols, NFT marketplaces, and gaming platforms.
Tokenomics: SOL is the native cryptocurrency of the Solana network, used for fees, staking, and governance.
Factors Affecting SOLUSD Price
Market Sentiment: Overall market sentiment towards cryptocurrencies and Solana in particular can significantly impact the price of SOLUSD.
Network Performance: Any issues or disruptions on the Solana network can negatively affect the price.
Developer Activity: The level of development activity on the Solana platform can influence investor sentiment and price.
Regulatory Environment: Changes in regulations regarding cryptocurrencies can impact the price of SOLUSD.
Competition: Competition from other blockchain platforms, such as Ethereum, can affect Solana's market share and price.
How to Analyze SOLUSD
Technical Analysis: This involves studying price charts, patterns, and indicators to predict future price movements.
Fundamental Analysis: This focuses on analyzing the underlying factors that affect SOLUSD's value, such as network performance, ecosystem growth, and market sentiment.
Where to Trade SOLUSD
You can trade SOLUSD on various cryptocurrency exchanges, including:
Binance
Coinbase
FTX
Kraken
Important Considerations
Volatility: Cryptocurrencies, including SOL, are known for their high volatility. This means that the price of SOLUSD can fluctuate significantly in a short period.
Risk: Investing in cryptocurrencies carries inherent risks, including market volatility, security risks, and regulatory uncertainty.
Do Your Own Research (DYOR): Before investing in SOLUSD, it's crucial to conduct thorough research and understand the risks involved.
Disclaimer: This information is not financial advice. Please consult with a financial advisor before making any investment decisions.

$XMR is back on track againSince the drawdown by major exchanges, OMXSTO:XMR has seen big losses
But now on the last weeks, it has regained previous price area!
One more evidence of an algorithmic price behavior in crypto markets
If you want to know more about how you can leverage your game with algorithmic price behaviors, just check my signature link

BTC to fall from a rising wedge? SHORTBTCUSD on the 15-minute chart appears to have formed a rising wedge pattern which typically
forecasts a breakdown and a fall in price. Overlaid is the LuxAlgo predictive model-based
on a gaussian regression line ( top shelf mathematics) with a lookback to the left for similar
patterns on which to found the forecast. The algo indicator validates a bias for a fall in price.
I will take a partial on my long positions here and save the profits for a re-entry when a firm
uptrend is noted.

SMG- it's spring time for SMG to make some green LONGSMG has good reason to trend up- the spring brings out consumers looking to get their lawn
off to a good start and the rise in marijuana stocks on the run-up to April 20th and the recent
legislative catalysts in Germany and Florida bring Scott's into focus as cultivators often use
it in their soil-based and hydroponic grow operations. The indicators show price momentum
and adequate volume to support a move higher. The predictive algorithm forecasts that move.
I will take a long position here targeting 86, the pivot high of 11 months ago.

DELL leaps out of the shadows of SMCI LONGDELL has risen and is now at its all time highs. Apparently, its server intrastructure business
this thriving. It is chasing SMCI and does not have the high valuation ratios that make
SMCI look overextended. The indicators document the up trending price action. A price
forecast algorithm has DELL rising into a high pivot on April 18th with 35% upside to that
forecasted pivot. I am adding to my DELL position here for the anticipated two week trade.

usdchf follow the yellow line read the caption usdchf
In the bigger picture, there is prospect of medium term bottoming at 0.8342 considering possible bullish convergence condition in W MACD, and the support from 0.8317 long term fibonacci support. Sustained trading above 55 D EMA (now at 0.8662) will affirm this case, and bring stronger rise back towards 0.9233 resistance, even as a corrective move.if you are ready to make profit follow that