EURUSD Short: Rally Stalls at Supply - Key Reaction Near 1.1800Hello traders! Here’s a clear technical breakdown of EURUSD (1H) based on the current chart structure. EURUSD has recently completed a notable structural shift after trading within a well-defined descending channel. During this phase, price consistently respected the falling resistance and printed lower highs and lower lows, confirming short-term bearish control. This bearish structure eventually reached a key pivot low, where selling pressure weakened and buyers began to step in. From this pivot point, EURUSD broke out of the descending channel, signaling the end of the corrective phase and the start of a bullish recovery.
Currently, EURUSD is pulling back from the supply area along the descending supply line, indicating a corrective retracement rather than a full trend reversal. Below the current price, the Demand Zone near 1.1800 stands out as a key level. This zone represents previous resistance turned support and aligns with the base of the impulsive move, making it a critical area for buyers to defend.
My primary scenario favors a pullback toward the 1.1800 Demand Zone while price remains below the descending supply line and the 1.1880–1.1900 Supply Zone. A controlled retracement into demand could provide a healthy correction within the broader bullish recovery structure, potentially setting the stage for another upside attempt. However, a strong rejection from the supply line followed by a clean breakdown and acceptance below 1.1800 would invalidate the bullish recovery scenario and signal a return to bearish pressure. Conversely, a decisive breakout and acceptance above the 1.1900 Supply Zone would confirm bullish continuation and open the door for further upside expansion. For now, EURUSD is at a key decision point, and patience is required as price reacts between supply and demand. Manage your risk!
Forex-analysis

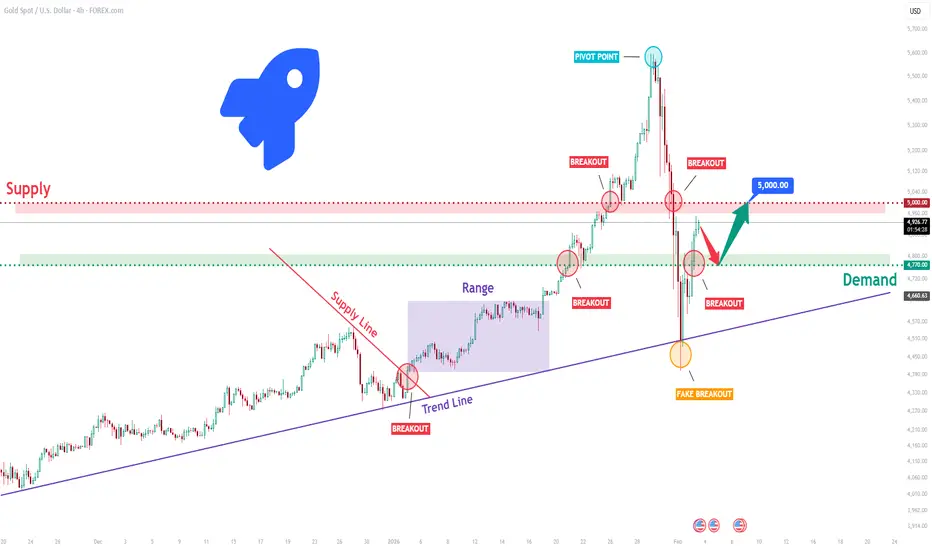
XAUUSD Long: After Fake Breakdown - $5,000 Back in SightHello traders! Here’s a clear technical breakdown of XAUUSD (4H) based on the current chart structure. Gold has been trading within a well-defined bullish environment for an extended period, supported by a rising trend line that guided price action higher. During this phase, price consistently printed higher highs and higher lows, confirming strong buyer control. After breaking above a descending supply line, XAUUSD entered a consolidation phase, forming a clear range before eventually expanding to the upside. This expansion resulted in multiple bullish breakouts, culminating in a strong impulsive rally toward the 5,000 psychological level, where price reached a major pivot point and bullish momentum began to exhaust.
Currently, XAUUSD is consolidating above the Demand Zone around 4,770, indicating stabilization after the sharp correction. This area aligns with previous breakout structure and acts as a critical decision zone. As long as price holds above this demand, the broader bullish structure remains valid despite the recent volatility. The current rebound appears corrective, suggesting the market may be building strength for the next directional move rather than entering a sustained bearish trend.
My primary scenario favors a bullish continuation as long as XAUUSD remains above the 4,770 Demand Zone and continues to show acceptance above the reclaimed structure. A successful hold in this area could allow price to gradually rotate higher, targeting a retest of the 5,000 Supply Zone as the next upside objective. This level remains a major barrier, and a clean breakout with strong acceptance above 5,000 would open the door for further bullish expansion. Alternatively, a decisive breakdown and acceptance below the 4,770 Demand Zone would invalidate the bullish continuation scenario and signal a deeper corrective move toward the rising higher-timeframe trend line. For now, structure slightly favors buyers, with the demand zone acting as the key battlefield. Manage your risk!
EURUSD: Buyers Defend 1.1780 - Upside in Focus 1.1870Hello everyone, here is my breakdown of the current EURUSD setup.
Market Analysis
EURUSD was previously trading within a well-defined downward channel, where price consistently respected the descending resistance and support boundaries, forming a series of lower highs and lower lows. This structure confirmed sustained bearish control and orderly downside continuation. During this phase, several bearish pushes developed smoothly within the channel, highlighting strong seller dominance. After breaking the channel, EURUSD continued higher and successfully reclaimed the Support Zone around 1.1780, which acted as a key decision level. The breakout and subsequent hold above this zone confirmed a change from bearish structure into a bullish recovery phase. Price then accelerated toward the 1.1870 Resistance Zone, where supply became active again, resulting in consolidation and multiple breakout attempts.
Currently, price is trading above the rising trend line, while also forming a descending corrective structure beneath the triangle resistance line. Despite the pullback, the market continues to respect higher lows, suggesting that the recent decline is corrective rather than impulsively bearish. The ability of EURUSD to hold above the support zone keeps the bullish structure intact.
My Scenario & Strategy
My primary scenario favors a long continuation as long as EURUSD holds above the 1.1780 Support Zone and respects the rising trend line. The current consolidation appears to be a corrective pause within a broader bullish structure. A successful break and acceptance above the triangle resistance and the 1.1870 Resistance Zone would likely trigger renewed upside momentum. If buyers manage to reclaim and hold above resistance, the next bullish leg could extend higher, following the direction of the dominant trend.
However, a decisive breakdown below the support zone and trend line would weaken the bullish scenario and signal a potential deeper correction or range formation. For now, structure favors buyers, with pullbacks viewed as opportunities for continuation rather than trend reversal. EURUSD remains at a key technical decision area, and price reaction around support will be critical for the next move.
That’s the setup I’m tracking. Thank you for your attention, and always manage your risk.

Gold Reclaims Support After Sharp Drop - 5,100 Resistance as TP1Hello traders! Here’s my technical outlook on XAUUSD (4H) based on the current chart structure. Gold initially traded within a clearly defined range, where price moved sideways, signaling a period of consolidation and market balance before the next impulsive move. From this range, XAUUSD broke to the upside and transitioned into a well-structured ascending channel, confirming strong buyer control with a consistent sequence of higher highs and higher lows. Price respected both the rising support line and the channel resistance, highlighting healthy bullish conditions throughout this phase. As the uptrend developed, gold eventually approached the key Resistance / Seller Zone around 5,100, where selling pressure became evident. Although price briefly broke above this level, the move lacked acceptance and resulted in a sharp rejection, forming a fake breakout and trapping late buyers. Following this rejection, XAUUSD dropped aggressively toward the Buyer Zone around 4,890–4,810, which aligns with previous resistance turned support and a key horizontal support level. The reaction from this area was strong, indicating active demand and buyer interest returning to the market. Currently, price is stabilizing above the Buyer Zone and attempting to recover after the fake breakdown. This behavior suggests a corrective rebound rather than a full trend reversal at this stage. Structurally, as long as gold holds above the Buyer Zone and maintains acceptance above support, a recovery move toward the 5,100 Resistance Level (TP1) remains possible. This area also overlaps with the Seller Zone, where selling pressure is likely to reappear. My scenario: holding above the Buyer Zone keeps the corrective bullish recovery intact, with 5,100 as the primary upside target. A strong rejection from resistance could resume downside pressure, while a decisive breakdown below the Buyer Zone would invalidate the recovery scenario and signal continuation of the broader corrective move. For now, XAUUSD is at a key decision area, with buyers attempting to defend support and build upside momentum. Please share this idea with your friends and click Boost 🚀

XAUUSD Long: Defends Trend Support, Targeting $5,190 SupplyHello traders! Here’s a clear technical breakdown of XAUUSD (2H) based on the current chart structure. Gold remains in a broader bullish environment after a strong impulsive move that developed from a well-defined accumulation range. Following this consolidation phase, price broke to the upside and began respecting a rising trend line, confirming sustained buyer control and healthy trend conditions. During the advance, multiple bullish breakouts occurred above prior resistance levels, each followed by continuation, reinforcing the strength of the underlying trend. This bullish leg ultimately pushed price into a major Supply Zone around 5,190, where upside momentum began to stall.
Currently, at the supply area, Gold faced strong selling pressure, leading to a sharp pullback and the formation of a descending supply line, signaling short-term corrective pressure within the broader uptrend. Price then dropped toward a key Demand Zone near 4,940, which aligns closely with the rising trend line and a previous breakout structure. This confluence of horizontal demand and dynamic trend support makes the zone technically significant. The recent decline appears corrective rather than impulsive, suggesting profit-taking and short-term distribution instead of a full trend reversal.
My scenario: as long as XAUUSD holds above the 4,940 Demand Zone and continues to respect the rising trend line, the broader bullish structure remains intact. A sustained reaction from this demand area could lead to a recovery move back toward the 5,190 Supply Level (TP1). A clean breakout and acceptance above this supply would confirm bullish continuation and open the door for further upside expansion. However, a decisive breakdown below the demand zone and trend line would invalidate the bullish bias and signal a deeper corrective phase. For now, Gold is at a key decision area, with buyers attempting to defend structure and resume the broader uptrend. Manage your risk!

EURUSD: Rally Stalls at Resistance - Correction To 1.1860Hello everyone, here is my breakdown of the current EURUSD setup.
Market Analysis
EURUSD has recently transitioned from a prolonged consolidation into a strong impulsive bullish move. After respecting a rising trend line and repeatedly breaking above the descending triangle resistance, price showed increasing bullish momentum, confirming a structural shift to the upside. This breakout led to a sharp rally, pushing EURUSD into the higher price area and directly into a clearly defined Resistance Zone around 1.1940–1.1950. At this resistance, price behavior has changed noticeably. After the initial breakout above the zone, EURUSD failed to sustain acceptance at higher levels and printed signs of exhaustion, including a false breakout and rejection wicks. This suggests that buyers may be losing control near this key resistance, while sellers are beginning to step in.
Currently, price action shows hesitation and consolidation below the resistance, indicating a potential distribution phase rather than continued impulsive strength. Below the current price, the Support Zone around 1.1860 stands out as a critical area. This zone previously acted as resistance and was later flipped into support during the bullish breakout, making it a key level for short-term structure. A pullback toward this support would align with a healthy corrective move within the broader context. Overall, while the higher-timeframe trend recently turned bullish, the market is now reacting at a major resistance level, and the structure suggests that the current move may be corrective rather than a continuation breakout.
My Scenario & Strategy
My primary scenario favors a short setup as long as EURUSD remains below or shows clear rejection from the 1.1940–1.1950 Resistance Zone. A confirmed rejection from this area could trigger a corrective move back toward the 1.1860 Support Zone, where buyers may attempt to re-enter. If selling pressure accelerates, a deeper pullback toward the rising trend line could follow.
However, if price achieves a clean breakout and strong acceptance above 1.1950, this would invalidate the short bias and open the door for further bullish continuation. For now, EURUSD is at a key decision point, and patience is required to see whether sellers can defend resistance or buyers regain control above it.
That’s the setup I’m tracking. Thank you for your attention, and always manage your risk.

XAUUSD: Continues Uptrend After Breakout, $5,170 in FocusHello everyone, here is my breakdown of the current XAUUSD setup.
Market Analysis
XAUUSD is trading within a strong and well-established bullish trend, supported by a clearly defined upward channel that has guided price higher over an extended period. Throughout this move, Gold has consistently respected the channel structure, printing higher highs and higher lows, which confirms sustained buyer dominance and healthy trend conditions rather than an exhausted rally. In the middle of the trend, price paused and formed a consolidation range, signaling temporary balance and accumulation before continuation. This range acted as a base, after which XAUUSD broke out decisively to the upside, triggering a powerful bullish impulse. Following the breakout, price accelerated higher and began respecting a rising triangle support line, showing that pullbacks remain shallow and corrective in nature.
Currently, Gold broke above the marked Support Zone, confirming a clean structure flip where former resistance turned into support. This breakout was followed by acceptance above the level, indicating strong buyer commitment rather than a false move. Price is now trading above the support zone and continues to trend higher toward the upper boundary of the structure. Above the current price, a clearly defined Resistance Zone around the 5,160–5,170 area stands as the next major technical obstacle. This zone represents a higher-timeframe supply area where profit-taking or temporary selling pressure may emerge. However, so far, there are no strong signs of impulsive rejection, and price action suggests continuation strength rather than distribution.
My Scenario & Strategy
My primary scenario remains bullish as long as XAUUSD holds above the Support Zone around 5,050–5,070 and continues to respect the rising structure. A controlled pullback into support, followed by bullish continuation signals, would offer a favorable continuation setup. I expect buyers to maintain control and attempt a push toward the Resistance Zone near 5,170 (TP1). A clean breakout and acceptance above this resistance would confirm trend continuation and open the door for further upside expansion within the broader bullish channel.
However, if price reaches resistance and shows clear rejection, a short-term corrective pullback toward the support zone or the rising triangle support line would be a healthy and expected move within the trend. Only a decisive breakdown and acceptance below the support zone would weaken the bullish structure and signal a deeper corrective phase. For now, structure, momentum, and price action continue to favor buyers.
That’s the setup I’m tracking. Thank you for your attention, and always manage your risk.

XAUUSD Long: Bullish Trend Intact Below the $5,000 Supply ZoneHello traders! Here’s a clear technical breakdown of XAUUSD (1H) based on the current chart structure. Gold is trading within a well-defined bullish trend, supported by a clean ascending channel that has guided price higher from the lower levels. Earlier in the move, XAUUSD respected the lower boundary of the channel and formed a sequence of higher highs and higher lows, confirming sustained buyer control. During this advance, price entered a consolidation range, signaling temporary balance and accumulation before continuation. This range eventually resolved to the upside, triggering a strong impulsive breakout and accelerating bullish momentum. After the breakout, Gold pushed higher within the ascending channel and approached a major Supply Zone near the psychological 5,000 level. At this area, price showed hesitation and formed a fake breakout above resistance, indicating that sellers were active near the highs. Following this rejection, XAUUSD pulled back toward the mid-lower area of the channel, where previous resistance has now turned into a Demand Zone around 4,870. This zone aligns with channel support and a key structural level, making it an important area for buyer reaction. The recent dip into demand appears corrective rather than impulsive, suggesting a pause within the broader uptrend.
Currently, XAUUSD is trading above the demand zone and remains inside the ascending channel, with buyers defending structure. The market is compressing after the pullback, which often precedes continuation in trending conditions.
My scenario: as long as Gold holds above the 4,870 demand zone and continues to respect the ascending channel, the bullish bias remains intact. A renewed push higher could lead to another test of the 5,000 Supply Zone (TP1). A clean breakout and acceptance above this level would confirm trend continuation and open the door for further upside expansion. However, failure to hold demand and a breakdown below channel support would weaken the bullish setup and signal a deeper corrective phase. For now, structure and momentum continue to favor buyers. Manage your risk!

EURUSD Long: Buyers Step In After Bearish Structure FailsHello traders! Here’s a clear technical breakdown of EURUSD (4H) based on the current chart structure. EURUSD previously experienced a corrective bearish phase, trading inside a descending channel after forming a rounding top near the highs. However, this bearish structure has recently weakened. Price broke above the descending channel, signaling a loss of seller control and the beginning of a potential structural shift. After the breakout, EURUSD formed a pivot low and reacted strongly from the Demand Zone around 1.1690, which aligns with previous structure and acts as a key support area. This demand zone is now being defended by buyers, and the latest bullish impulse suggests that the breakout from the descending channel is valid rather than a fake move.
Currently, price is consolidating above demand and below the Supply Zone near 1.1760, indicating short-term compression after the breakout. This consolidation looks constructive, as price is holding above former resistance turned support and is not showing strong bearish rejection.
My scenario: as long as EURUSD holds above the 1.1690 Demand Zone and continues to print higher lows, the bullish bias remains valid. I expect buyers to maintain control and attempt a continuation toward the 1.1760 Supply Zone (TP1). A clean breakout and acceptance above 1.1760 would confirm bullish continuation and open the door for a move toward higher resistance levels. Manage your risk!

XAUUSD Long: Uptrend Holds as Price Respects Rising Trend LineHello traders! Here’s a clear technical breakdown of XAUUSD (1H) based on the current chart structure. Gold is trading within a well-defined bullish structure after forming a clear pivot low earlier on the chart. From this pivot point, a rising trend line has been established, highlighting consistent buyer participation and a gradual shift in market control toward the upside. This trend line has been respected multiple times, confirming it as a key dynamic support guiding the bullish move. Following the pivot, price advanced and broke above a descending supply line, signaling a structural change from corrective pressure to bullish continuation. This breakout was impulsive, indicating strong demand entering the market. After the breakout, XAUUSD transitioned into a consolidation range, where price moved sideways as buyers and sellers reached temporary equilibrium. This range acted as a continuation structure rather than distribution.
Currently, price eventually broke out of the range to the upside, confirming renewed bullish momentum. After the breakout, gold pulled back and successfully retested the former resistance area, which is now acting as a Demand Zone around 4,700. This retest appears corrective, not impulsive, suggesting healthy price action and continued buyer dominance rather than trend exhaustion. On the upside, the next key level is the Supply Zone near 4,770, where previous selling pressure is expected to reappear. The current structure shows higher highs and higher lows, and price remains firmly above both horizontal demand and the rising trend line, keeping the bullish bias intact.
My scenario: as long as XAUUSD holds above the 4,700 Demand Zone and continues to respect the ascending trend line, the bullish structure remains valid. I expect buyers to defend this area and potentially push price toward the 4,770 Supply Zone (TP1). A clean breakout and acceptance above this level would confirm further bullish continuation. However, a decisive breakdown below the demand zone and trend line would weaken the bullish bias and signal a deeper corrective move. For now, market structure clearly favors buyers. Manage your risk!

Ethereum Is Completing a Classic Head & Shoulders1. Current Market Structure
Ethereum has transitioned from a strong bullish impulse into a clear distribution structure on the H1 timeframe. After the vertical rally from the 3,100 area, price formed a well defined Head & Shoulders pattern, signaling exhaustion rather than continuation. The left shoulder and right shoulder are symmetrical, while the head marks the final aggressive push that failed to attract sustained demand. Since then, price has shifted into lower highs and overlapping candles, confirming loss of bullish control.
This is no longer an impulsive uptrend it is a corrective-to-distributive phase.
2. Key Zones & Market Positioning
Major Supply / Head Zone: 3,390 – 3,420 → Strong rejection, distribution confirmed
Neckline / Key Support: ~3,280 – 3,265 → Structural decision level
Intermediate Demand: ~3,220
Final Downside Liquidity Target: 3,080 – 3,100
Price is currently hovering just above the neckline, which is typical behavior before a decisive breakdown in classical H&S structures.
3. EMA & Momentum Context
The EMA 98 is still rising and located below price, which explains the temporary pauses and bounces. However, price is now trading below prior momentum highs, and EMA support is flattening. This often occurs before deeper pullbacks as late buyers get trapped above the neckline.
Momentum is clearly weakening bullish candles are corrective, not impulsive.
4. Liquidity & Pattern Psychology
The Head & Shoulders structure reflects a distribution of long positions:
- Early buyers took profit near the head
- Late buyers entered near the right shoulder
- Liquidity now rests below the neckline
Once the neckline breaks and acceptance occurs, price typically accelerates quickly as stop-loss liquidity is released.
5. Market Scenarios
🔽 Primary Scenario – Bearish Continuation (High Probability)
Clean break and close below 3,265
Retest of neckline fails
Expansion toward 3,220 → 3,080
This move would be a healthy correction within the broader uptrend, not a macro reversal.
🔼 Invalidation Scenario
Strong reclaim and acceptance above 3,360
Break of right-shoulder structure
This would neutralize the H&S pattern and reopen bullish continuation — currently unlikely without volume.
6. Trading Perspective
Bias: Bearish (short-term)
Avoid longs near the neckline
Shorts favored on rejection or confirmed breakdown
Best long opportunities appear after liquidity is swept lower
Summary
Ethereum is no longer in expansion it is distributing.
The Head & Shoulders pattern is mature, momentum is fading, and liquidity is clearly building below the neckline. As long as price remains capped below the right shoulder, the roadmap remains straightforward:
Distribution → Neckline Break → Liquidity Expansion Downward

EURUSD: Sellers Take Control Below Key Resistance, Eyes 1.1600Hello everyone, here is my breakdown of the current EURUSD setup.
Market Analysis
EURUSD previously traded within a well-defined upward channel, confirming a bullish recovery phase after forming a strong base from the prior decline. Buyers maintained control by producing higher highs and higher lows, eventually pushing price toward a key Resistance Zone around 1.1690–1.1700. At this resistance area, price transitioned into a broad range, signaling a balance between buyers and sellers. Multiple attempts to hold above resistance failed, indicating growing selling pressure at the highs. Eventually, EURUSD broke down from the range, confirming a loss of bullish momentum and a shift in short-term market control.
Currently, EURUSD is trading within the descending channel and moving toward a key Support Zone around 1.1600, which previously acted as a demand area and a structural reaction level. This zone represents the next important area where buyers may attempt to slow or pause the decline.
My Scenario & Strategy
My primary scenario remains bearish as long as EURUSD stays below the 1.1690–1.1700 Resistance Zone and continues to respect the downward channel. Any pullbacks into resistance that show rejection can be viewed as potential short opportunities, with downside continuation toward the 1.1600 Support Zone as the first target.
However, a clean breakout and acceptance above resistance would invalidate the short bias and suggest a possible shift back toward consolidation or bullish recovery. Until that happens, market structure favors sellers, and rallies are considered corrective within the broader bearish context.
That’s the setup I’m tracking. Thank you for your attention, and always manage your risk.

EURUSD Short: Sellers Take Control Below 1.1680Hello traders! Here’s a clear technical breakdown of EURUSD (2H) based on the current chart structure. EURUSD previously traded within a well-defined ascending channel, confirming a strong bullish phase with consistent higher highs and higher lows. During this advance, price formed a consolidation range, which eventually resolved to the upside with a breakout, reinforcing bullish momentum. However, as price approached the key Supply Zone around 1.1680–1.1700, buying pressure started to weaken. Several attempts to hold above this area resulted in fake breakouts, signaling strong seller presence and exhaustion at the highs. Following the rejection from supply, EURUSD formed a clear rounding top near the pivot high, marking a structural transition. Price then broke below the range support and the ascending channel, confirming a short-term shift from bullish to bearish control. This breakdown led to the formation of a descending channel, where price is now producing lower highs and lower lows. Recent pullbacks into the channel resistance and supply area have failed, further confirming that the upside moves are corrective rather than impulsive.
Currently, EURUSD is trading below the 1.1680 Supply Zone and is moving toward the Demand Zone around 1.1600, which represents a key support level and the next potential reaction area. This zone aligns with previous structure and may attract buyers for a temporary pause or bounce.
My scenario: as long as EURUSD remains below the 1.1680 Supply Zone and respects the descending channel, the bearish bias remains valid. I expect sellers to maintain control and push price toward the 1.1600 Demand Zone (TP1). A clean breakdown and acceptance below 1.1600 would open the door for a deeper bearish continuation. However, a strong bullish breakout and acceptance back above 1.1680 would invalidate the short scenario and suggest a potential shift back toward consolidation or recovery. For now, market structure favors sellers. Manage your risk!

EURUSD Is Still Bearish – Rallies Are Selling OpportunitiesOANDA:EURUSD on the H1 timeframe remains firmly locked inside a well-defined bearish channel, and recent price action continues to confirm that the broader downtrend is still in control. Despite a sharp bullish reaction from the lower boundary of the channel, this move should be viewed as a technical pullback, not a structural reversal. The market is correcting, not changing direction.
From a market structure perspective, EURUSD continues to print lower highs and lower lows, which is the textbook definition of a bearish environment. The recent impulsive drop into the 1.1620 area flushed liquidity and triggered a reactive bounce, but that bounce has stalled precisely below the descending trendline and dynamic resistance. This behavior signals that sellers are still active and defending premium levels.
The zone around 1.1680 – 1.1700 is acting as a key supply area. Price is currently struggling to gain acceptance above this region, and momentum is visibly weakening as it approaches the trendline. In bearish markets, this type of slow, corrective grind higher often precedes the next impulsive sell-off, especially when price fails to break structure.
Below the market, the 1.1620 support zone remains the critical magnet for liquidity. The projected path highlights a likely scenario where EURUSD first attempts a minor push higher to rebalance inefficiencies, then rolls over and resumes the dominant trend. If price returns to this support area with momentum, the probability of a continuation move lower increases significantly.
As long as EURUSD remains below the descending channel resistance and fails to reclaim prior swing highs, the bias stays bearish by structure, bearish by trend, and bearish by context. Any bullish move at this stage is considered corrective and short-lived, offering potential opportunities for trend-following traders rather than reasons to fight the flow.
In short, this market is not bottoming it is breathing before the next leg down. Until structure is broken decisively, patience and alignment with the bearish trend remain the highest-probability approach.

Bitcoin Is Stalling at Resistance — A Deeper Pullback Bitcoin on the M30 timeframe has just completed a strong impulsive bullish leg but is now showing clear signs of exhaustion beneath a well-defined resistance zone around 95,700–95,800. After the vertical rally, price failed to continue higher and has transitioned into a sideways-to-distribution behavior, with overlapping candles and lower highs forming just below resistance. This type of price action typically reflects profit-taking and a lack of fresh buy-side momentum, rather than immediate continuation. Importantly, buyers have been unable to reclaim the highs despite multiple attempts, suggesting that supply is actively defending this area. From a liquidity perspective, the market has already swept buy-side orders above the range, and the next logical draw on liquidity now sits below current price, toward the prior demand zone around 91,700–92,000. As long as Bitcoin remains capped below resistance, the higher-probability scenario favors a pullback and rebalancing phase, potentially unfolding in a stair-step fashion rather than a straight sell-off. This would be a healthy correction within the broader bullish context, allowing the market to reset momentum and test unfilled demand. Only a clean break and acceptance above the resistance zone would invalidate this pullback thesis and reopen the upside continuation scenario. Until that happens, Bitcoin is not weak — it is distributing near highs and preparing for a deeper structural test below.

EURUSD Long: Bulls Defend 1.1620 Demand, Targeting Supply 1.1680Hello traders! Here’s a clear technical breakdown of EURUSD (2H) based on the current chart structure. EURUSD initially traded within a well-defined range, where price moved sideways for an extended period, reflecting a balance between buyers and sellers. During this consolidation phase, the market attempted several breakouts, including a fake breakout to the upside, which signaled weakness and lack of bullish continuation. Eventually, price achieved a valid range breakout, initiating an impulsive bullish move. Following this breakout, EURUSD reached a pivot point, where bullish momentum stalled and sellers began to step in. From this pivot high, price structure shifted into a descending channel, characterized by a series of lower highs and lower lows, confirming short-term bearish control. Price respected the channel boundaries well, indicating an orderly corrective move rather than panic selling. As EURUSD continued lower, it approached a strong Demand Zone around 1.1620, which aligns with a rising higher-timeframe trend line. This confluence area acted as a key support, where buyers responded aggressively. From this demand zone, price broke out of the descending channel, signaling weakening bearish momentum and a potential shift back toward bullish control.
Currently, price is reacting positively from demand and attempting to move higher. The next key level to watch is the Supply Zone around 1.1680, where previous selling pressure is expected to reappear. This level also coincides with prior structural reactions, increasing the probability of a pause or rejection.
My scenario: as long as EURUSD holds above the 1.1620 Demand Zone and respects the rising trend line, the bullish bias remains valid. I expect buyers to push price toward the 1.1680 Supply Zone, where a reaction or short-term pullback may occur. A clean breakout and acceptance above supply would confirm bullish continuation. However, a strong rejection from supply or a breakdown below demand would increase the probability of bearish continuation. For now, price is at a key decision area, and disciplined risk management is essential. Manage your risk!

XAUUSD: Descending After Fake Breakout - Bears in ControlHello everyone, here is my breakdown of the current XAUUSD setup.
Market Analysis
XAUUSD initially spent a prolonged period trading inside a well-defined range, where price respected clear support and resistance boundaries. This range reflected market indecision, with neither buyers nor sellers able to gain sustained control. Eventually, price broke out to the upside, confirming bullish intent and triggering a strong impulsive rally.
Currently, after the rejection, price broke back below short-term structure and started forming a descending triangular structure, defined by a clearly respected descending resistance line. Each bullish attempt toward this trendline has been rejected, signaling that sellers remain in control. At the same time, price is gradually rotating lower toward the 4,350 Support Zone, which previously acted as a key demand and breakout area.
My Scenario & Strategy
My primary scenario: as long as XAUUSD remains below the 4,490 Resistance Zone and continues to respect the descending resistance line, the bearish bias remains valid. Rejections from this trendline favor further downside continuation toward the 4,350 Support Zone, which is the first major downside target. If price breaks and accepts below the 4,350 Support Zone, this would confirm bearish continuation and open the door for a deeper corrective move toward lower support levels.
However, if buyers manage to reclaim the descending resistance line and achieve a clean breakout and acceptance above the 4,500 resistance area, the short bias would be invalidated and the market could transition back into bullish continuation. For now, structure favors sellers, momentum is weakening near resistance, and price remains capped below key supply.
That's the setup I'm tracking. Thank you for your attention, and always manage your risk.

XAUUSD Rising Support Holds - Next Target 4,500 ResistanceHello traders! Here’s a clear technical breakdown of XAUUSD (4H) based on the current chart structure. After a prolonged consolidation phase, Gold was trading inside a well-defined range, indicating balance between buyers and sellers. This range acted as an accumulation zone before price initiated a bullish expansion. Following the breakout from the range, XAUUSD entered an ascending channel, confirming a shift toward buyer control with a sequence of higher highs and higher lows. During this phase, price respected both the channel support and resistance lines, using them as dynamic structure levels. As price approached the upper boundary of the channel and the Resistance / Seller Zone around 4,500–4,510, bullish momentum started to weaken. Multiple fake breakouts above resistance signaled strong selling pressure at the highs. This led to a sharp corrective move lower, where price broke below short-term structure before finding support. Currently, XAUUSD is holding above the Buyer Zone around 4,400, which aligns with a key Support Level and a prior breakout area. Price has already shown a reaction from this zone and is now forming higher lows along a newly respected rising support line, suggesting buyers are attempting to regain control. The recent breakout back above local resistance reinforces the idea of a corrective pullback rather than a full trend reversal. My scenario: as long as XAUUSD holds above the 4,400 Buyer Zone and respects the rising support line, the bullish bias remains valid. I expect buyers to defend this area and attempt another push toward the 4,500 Resistance / Seller Zone (TP1). A clean breakout and acceptance above this level would confirm bullish continuation and open the path for further upside. However, a decisive breakdown below the buyer zone would weaken the structure and increase the risk of a deeper correction back toward lower support levels. Please share this idea with your friends and click Boost 🚀

EURUSD Defends Demand — Is a Bullish Reversal Setting Up?EURUSD on H1 has been trading under sustained bearish pressure, forming a clear descending trendline that has capped price action over the past sessions. Lower highs remain intact, confirming that sellers are still in control of the broader short-term structure.
However, the recent sell-off has now pushed price into a well-defined support zone around 1.1665–1.1680, where downside momentum has started to slow. The sharp reaction from this area suggests active buyer participation and hints at a potential short-term corrective rebound rather than immediate continuation lower.
At the moment, price is consolidating just above this support zone, while still trading below the descending trendline. This creates a compression scenario: buyers are defending demand from below, while sellers remain positioned at trendline resistance.
This is a key decision area. As long as the support zone holds, the market has room to attempt a recovery toward the upper structure. A failure here, however, would reopen downside risk.
Bullish scenario: If price holds above the 1.1665–1.1680 support zone and breaks above the descending trendline with acceptance, a corrective move toward 1.1720, followed by 1.1760–1.1770, becomes likely.
Bearish scenario: A confirmed breakdown and close below the support zone would invalidate the bullish recovery idea and expose further downside toward 1.1630 and potentially 1.1600.
For now, patience is essential. The market is sitting at a high-impact support level, and the next high-probability trade will come from confirmation, not anticipation.

XAUUSD Long: Demand Holds at 4,400 - Push Toward 4,500 in FocusHello traders! Here’s a clear technical breakdown of XAUUSD (2H) based on the current chart structure. XAUUSD previously moved within a steady bullish structure, respecting a rising trend line that supported price during multiple pullbacks. After a strong impulsive rally, Gold transitioned into a consolidation phase, forming a well-defined range that highlighted temporary balance between buyers and sellers. This range eventually resolved to the upside with a breakout, confirming bullish continuation and renewed buyer control.
Currently, XAUUSD is trading between the 4,400 Demand Zone and the 4,500 Supply Zone, with price holding above the rising trend line. This shows that bullish structure is still intact, but price is once again approaching a key resistance area where a reaction is likely.
My scenario: as long as XAUUSD holds above the 4,400 Demand Zone and respects the rising trend line, the broader bullish bias remains valid. A clean breakout and acceptance above the 4,500 Supply Zone would confirm continuation toward higher levels. However, if price is rejected from supply and breaks back below demand, this could trigger a deeper corrective move toward the trend line. For now, price is compressing between demand and supply, and a decisive move is expected soon. Manage your risk!

XAUUSD: Buyers Defend Support, Retest of 4,490 ResistanceHello everyone, here is my breakdown of the current XAUUSD setup.
Market Analysis
Gold previously traded under pressure near a descending triangle resistance line, where price action was compressed before buyers stepped in. After forming a solid base, XAUUSD broke above the triangle resistance and confirmed a bullish structural shift. This breakout initiated a steady upside move, supported by a rising trend line and a clear sequence of higher highs and higher lows. Following the initial breakout, price entered a range, signaling temporary consolidation and accumulation. Buyers eventually gained control again, leading to a clean breakout above the range and continuation higher. This move brought gold into the key Resistance Zone around the 4,490–4,520 area, where price was recently tested and met with strong selling pressure.
Currently, after the rejection from resistance, XAUUSD pulled back sharply but found demand near the Support Zone around 4,310, which aligns with a previous breakout level and the rising support line. The current price action shows a corrective pullback rather than a full trend reversal, with buyers stepping in to defend this support area. The structure remains constructive as long as price holds above this key demand zone.
My Scenario & Strategy
My primary scenario: as long as XAUUSD holds above the 4,310 Support Zone and respects the rising support line, the bullish bias remains intact. I expect buyers to continue defending this area and attempt another push toward the 4,490 Resistance Zone as the next upside objective.
However, a decisive breakdown below support would weaken the bullish structure and open the door for a deeper corrective move. Until that happens, the overall structure favors continuation to the upside after consolidation.
That’s the setup I’m tracking. Thank you for your attention, and always manage your risk.

EURUSD Breakdown Confirmed, 1.1640 Support in FocusHello traders! Here’s my technical outlook on EURUSD (2H) based on the current chart structure. EURUSD initially traded within a well-defined ascending channel, showing a strong bullish structure with higher highs and higher lows after the market started to grow from the lower levels. This bullish phase reflected steady buyer control, supported by a rising support line and multiple clean reactions along the channel structure. Eventually, price broke above the channel resistance, signaling momentum expansion. Following the breakout, EURUSD entered a clear range, where price consolidated between key highs and lows, indicating temporary balance between buyers and sellers. Multiple internal reactions and false moves within this range highlighted uncertainty and distribution near the highs. After topping out, price turned around and transitioned into a short-term descending channel, marking a shift in momentum. During this pullback, EURUSD broke below the range support and the descending channel support, confirming increasing bearish pressure. Price is now trading below the Resistance Level near 1.1720, which aligns with the former breakout area and the Seller Zone, reinforcing it as a strong supply region. The recent breakout below this level suggests sellers are gaining control in the short term. Currently, price is reacting around the Buyer Zone near the Support Level around 1.1670. This area aligns with prior demand and has already produced a small bounce, indicating potential short-term reaction. However, the overall structure remains corrective within the broader move. My scenario: as long as EURUSD remains below the 1.1720 Resistance Level, bearish pressure is likely to persist, with TP1 targeting the 1.1640 Support Level. A clear breakdown below support would open the door for further downside continuation. Conversely, a strong reclaim and acceptance back above resistance would invalidate the bearish bias and signal a potential trend shift. For now, price is at a key decision zone where sellers hold the advantage while support is being tested. Please share this idea with your friends and click Boost 🚀

XAUUSD Buyers Step In at Key Level - Momentum StabilizesHello traders! Here’s my technical outlook on XAUUSD (1H) based on the current chart structure. Gold is trading within a broader bullish structure after a strong impulsive rally from lower levels. Earlier, price moved inside a consolidation range, signaling accumulation before breaking out to the upside and confirming renewed buyer control. This breakout initiated a sharp bullish leg, forming a sequence of higher highs and higher lows. Following the impulsive move, XAUUSD reached the Seller Zone around the 4,400 Resistance Level, where strong selling pressure appeared. Price dropped aggressively from this area, confirming supply dominance at higher levels. After the drop, gold broke below the resistance, then performed a test and retest of the same zone, which now acts as resistance. This behavior confirms a short-term structural shift while the broader bullish trend remains intact. Currently, price is reacting around the Buyer Zone near 4,310–4,320, which aligns with a key Support Level and a previous breakout area. This zone has already shown a clear reaction, with price turning around and forming a higher low above the rising Trend Line. The recent move into support appears corrective rather than impulsive, suggesting a pause within the larger bullish structure rather than a full reversal. My scenario: as long as XAUUSD holds above the Buyer Zone and respects the rising Trend Line, the bullish structure remains valid. A strong reaction from this area could lead to a move back toward the 4,400 Resistance Level (TP1). A confirmed breakout and acceptance above resistance would signal bullish continuation. However, a decisive breakdown below the Buyer Zone would weaken the structure and signal a deeper corrective move. For now, price is at a key decision area, with buyers actively defending support while consolidation continues. Please share this idea with your friends and click Boost 🚀
