The Impact of Multinational Corporations (MNCs) on Trading1. Driving International Trade Growth
MNCs are major engines of global trade. By establishing operations in multiple countries, they create a demand for goods, services, and capital across borders. Their activities often lead to the creation of intricate global supply chains where raw materials, intermediate goods, and finished products move seamlessly between countries. For example, an automobile company headquartered in Germany may source parts from Japan, assemble vehicles in Mexico, and sell them in the United States. This not only increases the volume of trade but also diversifies trade patterns, creating new economic linkages between nations.
MNCs often promote exports from developing countries by investing in local manufacturing plants. This stimulates local economies, generates employment, and enables these countries to integrate into global markets. Countries like China, Vietnam, and India have benefited significantly from MNC-led trade, seeing their export sectors expand dramatically due to foreign direct investment (FDI) from multinationals.
2. Influence on Market Structure and Competition
MNCs can reshape trading markets by altering competitive dynamics. Their size, access to advanced technology, and global networks give them a competitive advantage over domestic firms. This can create efficiencies in production, logistics, and distribution, often resulting in lower costs for consumers. For instance, multinational retail corporations like Walmart or Amazon leverage economies of scale to offer goods at prices that domestic competitors may struggle to match.
However, MNC dominance can also lead to market concentration, where a few large players control significant shares of certain markets. This has implications for trade policies, as governments may feel pressured to create favorable conditions for MNCs to attract investment, sometimes at the expense of local businesses. Thus, while MNCs enhance efficiency and expand trade, they can also introduce competitive challenges for smaller domestic firms.
3. Shaping Global Supply Chains
The operations of MNCs often dictate global supply chain structures, which have a direct impact on trading patterns. Companies like Apple, Samsung, and Toyota rely on a network of suppliers and manufacturers spread across continents. These supply chains facilitate the cross-border movement of intermediate goods, raw materials, and components, which in turn drives international trade.
Moreover, MNCs play a critical role in setting global standards for quality, production, and logistics. By enforcing uniform standards across their global operations, they encourage trading partners to adopt similar practices, thereby enhancing trade efficiency and reliability. However, dependence on MNC-driven supply chains can also create vulnerabilities. For example, disruptions in one region—like a natural disaster or geopolitical tension—can impact global trade flows significantly, as seen during the COVID-19 pandemic when supply chains were severely affected.
4. Technological Transfer and Innovation in Trade
MNCs are often at the forefront of technological innovation. Through their international operations, they transfer knowledge, skills, and technologies to host countries, impacting trading patterns. For instance, a multinational in the electronics sector may establish a research and development (R&D) center in a developing country, equipping local talent with advanced technological know-how. This technology transfer often enhances local production capabilities, enabling these countries to produce goods for export that meet international standards.
Additionally, MNCs introduce advanced management practices, logistics solutions, and production techniques, which improve efficiency and productivity in trade operations. Over time, these innovations contribute to the growth of trade volumes and the development of competitive export sectors in host countries.
5. Impact on Foreign Exchange and Financial Markets
MNCs’ global operations have a significant influence on currency markets and international finance. Their cross-border transactions in goods, services, and capital flows impact foreign exchange demand and supply. For instance, a U.S.-based multinational importing raw materials from India would need to convert dollars into Indian rupees, thereby affecting currency exchange rates. Large-scale operations of MNCs can thus introduce volatility into foreign exchange markets, influencing trade competitiveness and pricing.
Furthermore, MNCs often participate in international capital markets through foreign direct investment (FDI), portfolio investment, or borrowing in foreign currencies. These activities facilitate global financial integration and enhance liquidity in international trade financing. Their investments can also affect trade balances by increasing exports from host countries or boosting imports to supply their global production networks.
6. Influence on Trade Policies and Agreements
Governments often design trade policies to attract or regulate MNC activity. Many countries offer tax incentives, reduced tariffs, and favorable regulatory environments to encourage MNC investments. Consequently, MNCs influence trade policies and international trade agreements. For example, the presence of MNCs in a country may motivate it to negotiate bilateral or multilateral trade agreements that facilitate smoother export and import flows.
Additionally, MNC lobbying can impact international trade rules, including labor standards, environmental regulations, and intellectual property protections. By shaping the regulatory environment, MNCs indirectly affect the flow of goods and services across borders, promoting trade liberalization in some cases while creating barriers in others.
7. Risks and Challenges Introduced by MNCs
While MNCs boost global trade, they also introduce challenges. Overreliance on multinational corporations can make countries vulnerable to global economic shocks, such as sudden shifts in investment flows or supply chain disruptions. The dominance of MNCs in certain sectors can stifle domestic entrepreneurship, reducing the diversity of trade sources. Additionally, ethical concerns related to labor practices, environmental sustainability, and profit repatriation can complicate trade relations.
Global trade is also affected by political tensions involving MNCs. For instance, disputes between home and host countries over taxation, tariffs, or sanctions can disrupt trade flows, highlighting the complex interplay between multinational operations and international commerce.
8. MNCs and the Future of Global Trade
Looking ahead, MNCs will continue to be central to trading patterns. Emerging technologies like artificial intelligence, blockchain, and automation will enable more efficient global logistics and trade tracking. MNCs will likely invest in sustainable and green supply chains, aligning with international environmental standards, which will influence the type of goods traded and the countries involved.
Moreover, geopolitical shifts, trade wars, and regional economic blocs will affect how MNCs structure their operations, creating new trade corridors while potentially reducing reliance on certain markets. Their strategic decisions will continue to have far-reaching implications for global trade, economic growth, and international financial stability.
Conclusion
Multinational corporations have fundamentally transformed international trade. By driving global supply chains, influencing market structures, transferring technology, and shaping trade policies, MNCs create opportunities and challenges for countries around the world. Their operations stimulate economic growth, expand trade volumes, and integrate emerging markets into global commerce. At the same time, their dominance introduces risks such as market concentration, supply chain vulnerabilities, and ethical concerns. Understanding the nuanced impact of MNCs is critical for policymakers, investors, and businesses seeking to navigate the complexities of global trade.
In essence, MNCs act as both facilitators and influencers of trade. Their strategies and decisions resonate across borders, shaping not only the flow of goods and services but also the broader economic and political environment in which international commerce occurs. As globalization evolves, the role of MNCs in trading will remain a defining factor in the architecture of the global economy.
Forexn1
GBP/USD Faces Resistance at Weekly Supply,Signal for Short EntryI am initiating an additional short position on GBP/USD as the currency pair has reached the Weekly Supply zone and is currently facing resistance in breaking above this area. The price action indicates a struggle to sustain upward momentum, with repeated rejections at this level. Moreover, the pair appears to be rejecting the Daily Supply zone as well, further confirming bearish pressure. Based on this technical setup, I am looking to capitalize on a potential downward move, positioning myself for a short trade.
✅ Please share your thoughts about GBP in the comments section below and HIT LIKE if you appreciate my analysis. Don't forget to FOLLOW ME; you will help us a lot with this small contribution.

Visa Stock Shows Strong Daily Rebound Amid Diverging MarketThe VISA stock chart is currently demonstrating a promising rebound on the daily timeframe, indicating a potential shift in market sentiment. This upward movement is primarily fueled by demand zones where institutional traders and larger market participants—often classified as non-commercials—are actively pushing prices higher. Their buying activity suggests confidence in VISA’s future prospects and could be a strong indicator of continued upward momentum.
Conversely, retail investors seem to be retreating or selling off, which is creating a contrasting pressure on the stock. Despite retail traders' bearish stance, the overall chart pattern and the demand levels suggest that the stock might be poised for further gains. This divergence between institutional and retail trading behaviors often signals an opportunity for savvy investors to consider a long position, especially if the demand continues to hold.
It's important to monitor key support levels and volume indicators to confirm the strength of this rebound. If the demand sustains and the stock maintains its upward trajectory, it could be a strategic entry point for those looking to capitalize on a potential bullish move in VISA.
What are your thoughts on this analysis? Do you see further upside, or are there cautionary signs to consider? Share your perspective in the comments below—I'd love to hear your insights!
✅ Please share your thoughts about VISA in the comments section below and HIT LIKE if you appreciate my analysis. Don't forget to FOLLOW ME; you will help us a lot with this small contribution.

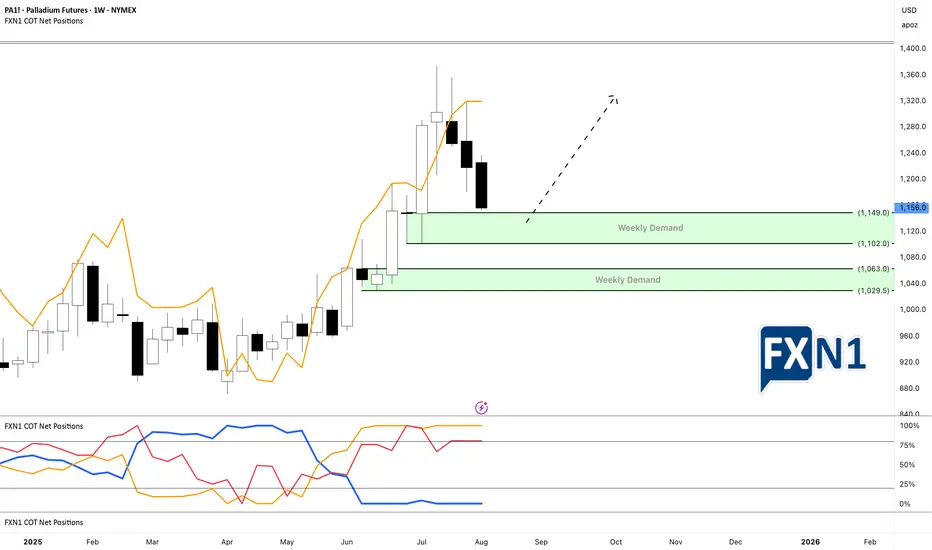
Palladium’s Bullish Outlook Amidst a Market FakeoutPalladium has emerged as the second strongest precious metal this year, demonstrating notable resilience. Over the past three weeks, however, its price has experienced a retracement, revealing two potential weekly demand zones on the chart. An analysis of the Commitment of Traders (COT) report indicates that this pullback is not driven by non-commercial traders, who are actually increasing their positions. This discrepancy suggests that the recent decline may be a false move by the market. Consequently, I am considering placing limit orders within the two identified demand areas to capitalize on a potential rebound.
✅ Please share your thoughts about PA1! in the comments section below and HIT LIKE if you appreciate my analysis. Don't forget to FOLLOW ME; you will help us a lot with this small contribution.
NZD/USD Approaches Key Supply ZoneThe NZD/USD is currently approaching a notable supply zone on the daily chart, indicating a potential area where selling pressure may intensify. According to the Commitment of Traders (COT) report, there has been a slight increase in short positions among Non-Commercial traders, suggesting that large speculators are beginning to bet on a decline. Conversely, retail traders are predominantly going long, which often acts as a contrarian indicator, hinting at possible exhaustion or a forthcoming reversal.
This confluence of signals points toward the possibility of an additional bearish impulse in the near term. Our forecast aligns with this view, as the DXY (US Dollar Index) shows signs of potential strength and could surge higher, further pressuring the NZD/USD pair. Moreover, seasonal analysis indicates a historically bearish trend during this period, adding another layer of confirmation to the outlook.
What are your thoughts on these developments? Do you see the potential for a downside move reinforcing, or are there other factors to consider?
✅ Please share your thoughts about NZDUSD index in the comments section below and HIT LIKE if you appreciate my analysis. Don't forget to FOLLOW ME; you will help us a lot with this small contribution.

EUR/USD Nears Key Supply Zone Amid Rising Short PositionsThe EUR/USD is currently approaching a significant daily supply zone. This is an area where, in the past, the price briefly touched before reversing and heading downward. Now, the currency pair is nearing a second test of this supply level, which could signal that institutional traders are preparing to add more short positions. Historically, these supply zones tend to act as resistance points, and the repeated testing suggests a potential buildup of selling pressure.
Looking at the recent positioning of different market participants, last week saw an increase in short positions among Non-Commercial traders, indicating that large speculators are betting on a decline in the EUR/USD. Conversely, Commercial traders are at their lowest levels since August 2024, which typically signals that those involved in hedging or commercial transactions are less inclined to support the current price levels. Meanwhile, retail traders continue to add to their positions, often acting as a contrarian indicator.
In tandem, the US dollar itself is entering a demand zone, as evidenced by the increase in Non-Commercial contracts on the dollar index. This suggests that speculative traders are betting on the dollar strengthening, which aligns with the potential for a downside move in EUR/USD.
Given these combined signals—the approaching supply zone, the increase in short positions among large traders, and the dollar entering a demand area—I am looking for a possible shift towards the downside for EUR/USD. This could lead to a strengthening of the US dollar as the market prepares for a potential reversal or continuation of the bearish trend.
Additionally, I will include my analysis of the DXY (US Dollar Index), which remains valid and supports this perspective. The DXY’s current positioning and technical setup reinforce the likelihood of the dollar gaining strength in the near term. Overall, the market is showing signs that favor a downside move, and I will be monitoring these levels closely for confirmation.
✅ My DXY Point of view:
✅ Please share your thoughts about EURUSD index in the comments section below and HIT LIKE if you appreciate my analysis. Don't forget to FOLLOW ME; you will help us a lot with this small contribution.

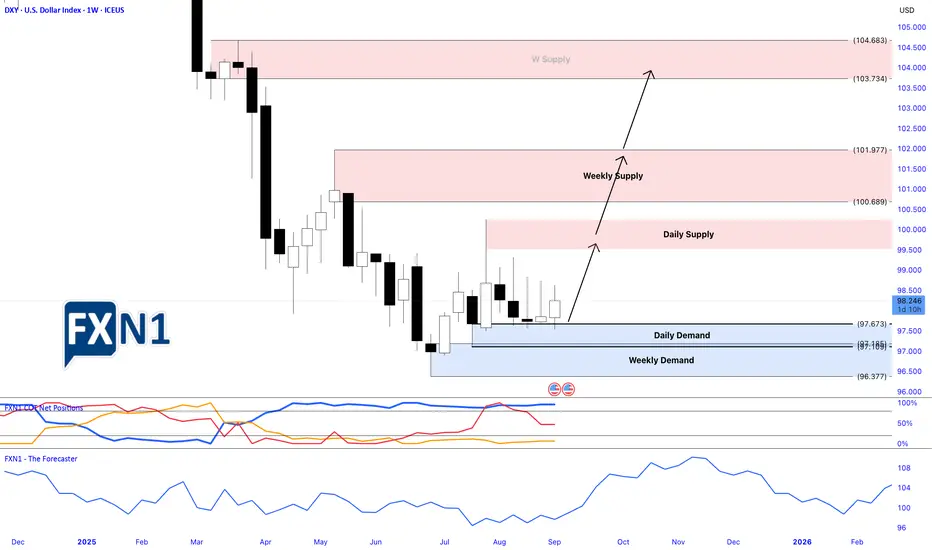
Is the DXY Poised for a Breakout?Analyzing the Bullish PotentialThe DXY (US Dollar Index) appears to be on the verge of a significant upward rally. Last week, I shared my analysis highlighting a potential trigger point for a long entry, which the price subsequently surpassed, confirming the setup. According to the latest COT reports, commercial traders have reached their highest net positions of 2023. Historically, whenever commercials hit new highs, it often signals the beginning of a bullish trend in the DXY.
Additionally, we observe that many currencies measured against the dollar have weakened recently, supporting my thesis of a continued upward move for the DXY. Seasonal patterns also point toward a potential bullish phase.
Is this the moment for the DXY to initiate a strong bullish trend? Only time will tell, but the technical and fundamental signals are aligning in favor of a possible rally.
✅ Please share your thoughts about Dollar index in the comments section below and HIT LIKE if you appreciate my analysis. Don't forget to FOLLOW ME; you will help us a lot with this small contribution.
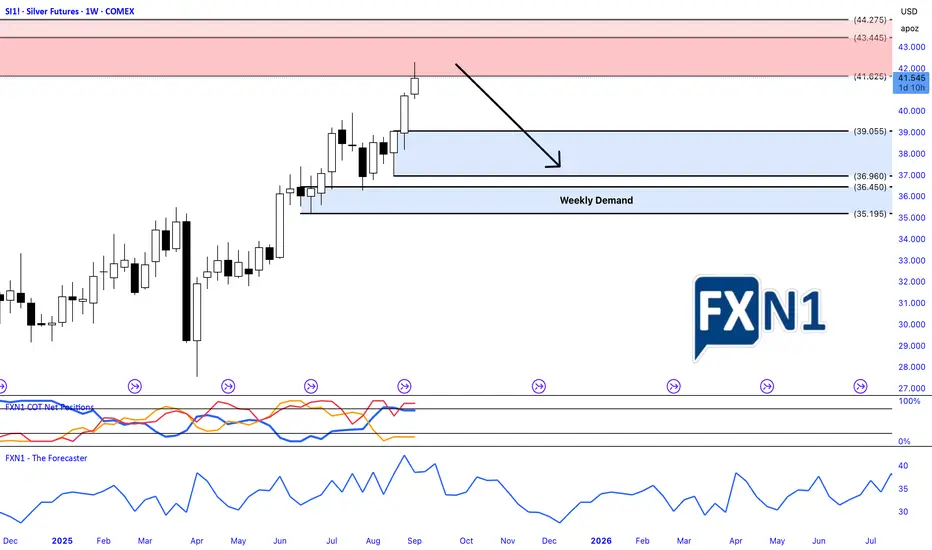
Silver Trade Insights: Supply Levels, Seasonality and COTI have initiated a short position in silver as the price approaches a significant weekly supply zone. This entry was strategically determined based on an intra-day supply level identified on the daily chart. My outlook is primarily bearish, supported by seasonal patterns suggesting a potential downward trend. Additionally, non-commercial traders and institutional investors have been increasing their short positions, while retail traders continue to build long positions. I'm anticipating a possible trend reversal, but I also remain cautious of a retest of my designated supply area before any decisive move. As always, I recommend conducting thorough personal research before making any trading decisions.
✅ Please share your thoughts about Silver in the comments section below and HIT LIKE if you appreciate my analysis. Don't forget to FOLLOW ME; you will help us a lot with this small contribution.
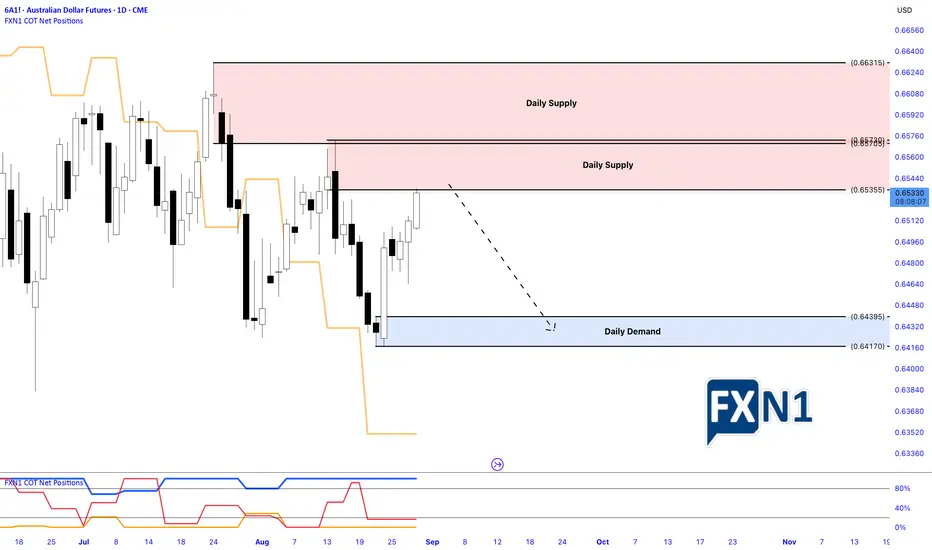
AUD: Revisit Key Supply Zone, Potential Short Setup.The AUD Futures 6A1! has revisited a key supply zone established earlier this month, presenting a potential opportunity for another short trade setup. According to the latest COT report, non-commercial traders have increased their short positions, indicating a bearish sentiment. However, it's crucial to keep an eye on the DXY, as recent price movements over the past two days suggest a possible shift in its trend. Given that August often brings uncertainty and lack of clear direction, this environment requires careful monitoring. Consider this analysis as one of several factors in your trading decision-making process.
✅ Please share your thoughts about 6A1! in the comments section below and HIT LIKE if you appreciate my analysis. Don't forget to FOLLOW ME; you will help us a lot with this small contribution.
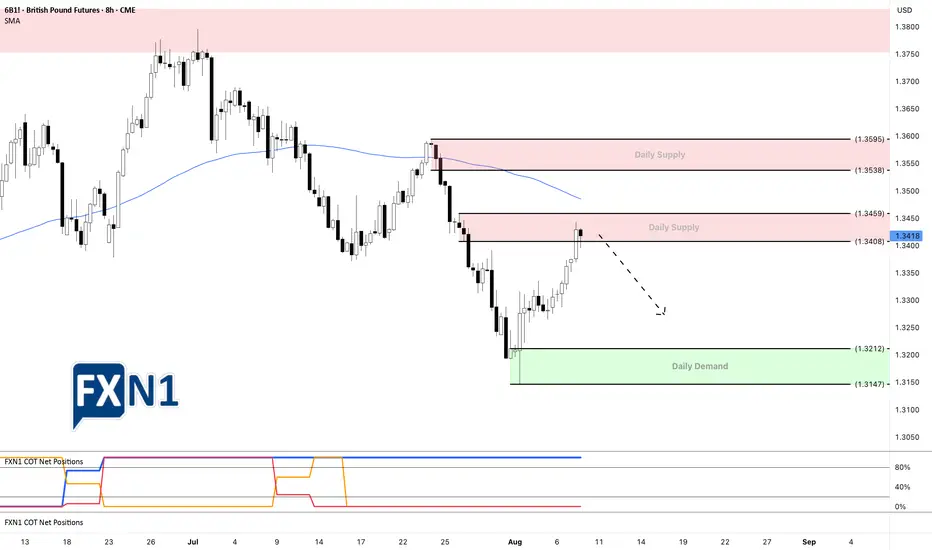
6B1!: GBPUSD Futures Outlook: Bearish Momentum Persists The GBPUSD CFD continues its cautious descent following a rejection from the critical 1.3590 supply area. This level, historically a significant resistance point, has thwarted recent bullish attempts, reinforcing the prevailing bearish sentiment among traders and investors alike.
Technical Breakdown
After failing to sustain gains above 1.3590, sellers have gained momentum, targeting lower levels of support. The immediate focus now shifts to the daily demand zone around 1.3300. Should the price reach this level, it is plausible that buyers will emerge, viewing it as an attractive entry point with a well-defined risk below the zone. A successful bounce here could trigger a rally, offering traders an opportunity to position for a potential reversal.
Potential for Further Decline
If market conditions remain unchanged—particularly in terms of Commitment of Traders (COT) data and fundamental factors—there is a possibility that the pair could test even lower support levels. Currently, the next significant demand zone lies near 1.3230, which could serve as the next target for bears if selling pressure intensifies.
Broader Market Context
Meanwhile, the US dollar index (DXY) appears to be demonstrating resilience, finding demand at current levels. This inverse relationship suggests that, despite the weakening GBP, the USD might be strengthening or stabilizing, adding weight to the bearish outlook for GBPUSD.
Trading Strategy and Outlook
Our current stance is to maintain our short positions with a close eye on the 1.3300 support zone. If the price holds above this level, it could serve as a foundation for a potential rebound, provided macroeconomic fundamentals and sentiment remain unchanged. Conversely, a decisive break below 1.3230 could accelerate the decline toward next support levels, confirming a sustained bearish trend.
✅ Please share your thoughts about 6B1! in the comments section below and HIT LIKE if you appreciate my analysis. Don't forget to FOLLOW ME; you will help us a lot with this small contribution.

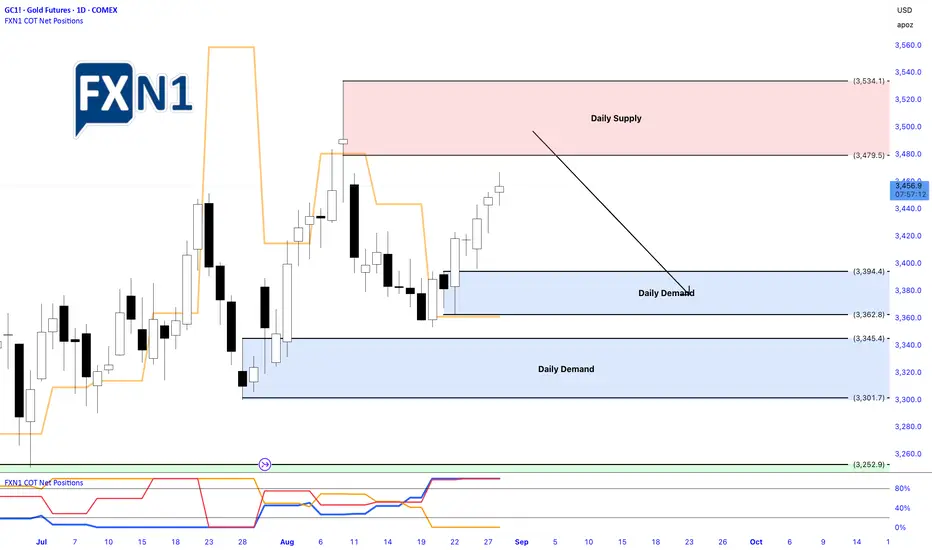
Gold Surge: Preparing for a Possible Pullback at Supply ZoneThroughout August, gold has steadily risen in value, experiencing only minor retracements along the way. Currently, the price is approaching a significant daily supply zone, situated at the top of the market. Recent data indicates that non-commercial traders have been increasing their short positions over the past few weeks, hinting at a potential capitulation or liquidation of positions soon. Meanwhile, retail investors continue to push longs, whereas commercial traders remain positioned more neutrally, gradually adding to their holdings. Moving forward, I will closely monitor the next supply zone, as it could present an ideal opportunity to initiate a short position, capitalizing on potential market exhaustion at this resistance level.
✅ Please share your thoughts about GC1! in the comments section below and HIT LIKE if you appreciate my analysis. Don't forget to FOLLOW ME; you will help us a lot with this small contribution.
USD/CAD - 6C1! : Trade update FundamentalThe US dollar index (DXY) gained strength against major currencies on Monday following a landmark trade agreement between the United States and the European Union. During the meeting in Scotland on Sunday, President Donald Trump and European Commission President Ursula von der Leyen announced a new trade framework, which includes a 15% import tariff on EU goods—half of the 30% rate Trump had initially threatened to impose starting August 1.
The DXY opened higher at the start of the week, and it’s clear that most currencies are likely to see a decline in response. This trend also extends to pairs like the 6C1! (USDCAD), where the USD has been increasing its long positions. Last week, non-commercial traders added to their holdings, while commercial traders remain at their highest levels since 2021. Based on this setup, we are maintaining a bullish outlook and expect the continuation of our long position strategy.
Previous Idea :
✅ Please share your thoughts about USD/CAD in the comments section below and HIT LIKE if you appreciate my analysis. Don't forget to FOLLOW ME; you will help us a lot with this small contribution.

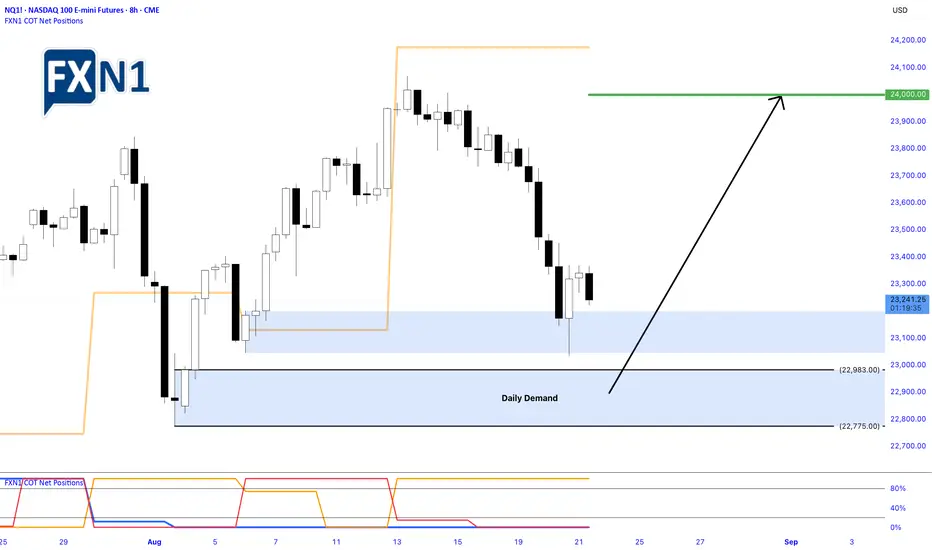
Nasdaq Bounces Off Demand Zone: Opportunities for a Bullish Rev.Yesterday, the Nasdaq experienced a notable rebound from the daily demand zone around 23,201, signaling buying interest at that level. However, as the EU trading session commenced, the index quickly shifted to a bearish impulse, reflecting ongoing market uncertainties and cautious sentiment among traders.
Key Levels and Opportunities
Despite the short-term pullback, the chart presents a compelling opportunity for traders to consider a "buy low" approach near the next demand zone at approximately 22,983. If the market finds support there, it could set the stage for a recovery, with the potential for the Nasdaq to rally back toward the 24,000 mark or even higher.
Market Outlook and Analyst Projections
Analysts remain optimistic about the index’s prospects, with many projecting a strong finish to the year. The Nasdaq, known for its volatility and lucrative trading opportunities, continues to attract traders seeking to capitalize on its upward momentum. As always, projections are optimistic, but the current technical setup suggests that there could be a favorable risk/reward ratio for those willing to position for a rally.
Final Thoughts
In a market characterized by rapid shifts and unpredictable moves, identifying key demand zones and monitoring reaction levels is crucial. The upcoming sessions could provide a prime entry point for those looking to buy dips, with the potential for the Nasdaq to forge ahead into the year’s final stretch with gains.
✅ Please share your thoughts about NQ1! in the comments section below and HIT LIKE if you appreciate my analysis. Don't forget to FOLLOW ME; you will help us a lot with this small contribution.
AUD/USD Breaks Daily Supply Zone Despite Fundamental CautionThe U.S. dollar maintained its decline yesterday, driven by dovish comments from Federal Reserve official Kashkari, who joined other policymakers in hinting at a possible interest rate cut as soon as September. This shift in tone was mainly triggered by the softer-than-anticipated Non-Farm Payroll (NFP) figures released last Friday, signaling a more cautious outlook on the economy.
Meanwhile, the AUD/USD pair broke through our previous Daily Supply zone. However, from a fundamental perspective, nothing has significantly changed, as non-commercial traders increased their short positions last week. This suggests that there may be a second opportunity to target the next Daily Supply zone, as indicated by the chart.
✅ Please share your thoughts about AUDUSD in the comments section below and HIT LIKE if you appreciate my analysis. Don't forget to FOLLOW ME; you will help us a lot with this small contribution.

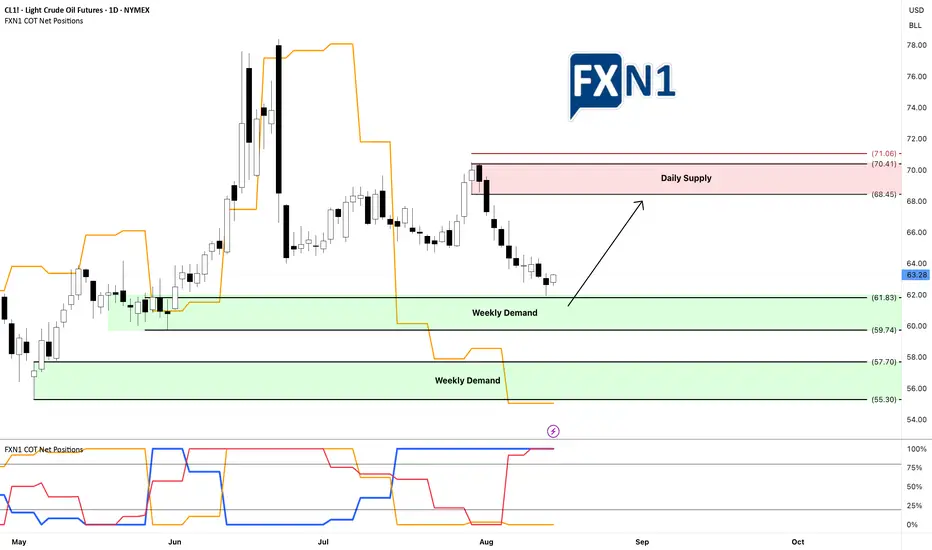
Oil Market Insights: Demand Zones and Future FundamentalsYesterday, CL1! oil tested and rebounded from my weekly demand zone without triggering my entry, resulting in a missed opportunity for several points. This suggests to me that there is buying interest at this level, regardless of the fact that non-commercial traders are short. I am now looking for a retest of this area—if I'm fortunate—to enter a long position. I am also awaiting the new COT data tomorrow to assess any potential shifts in fundamentals. Additionally, I am considering the presence of a stronger demand zone below, which appears even more promising. We'll see how it unfolds.
✅ Please share your thoughts about CL1! in the comments section below and HIT LIKE if you appreciate my analysis. Don't forget to FOLLOW ME; you will help us a lot with this small contribution.
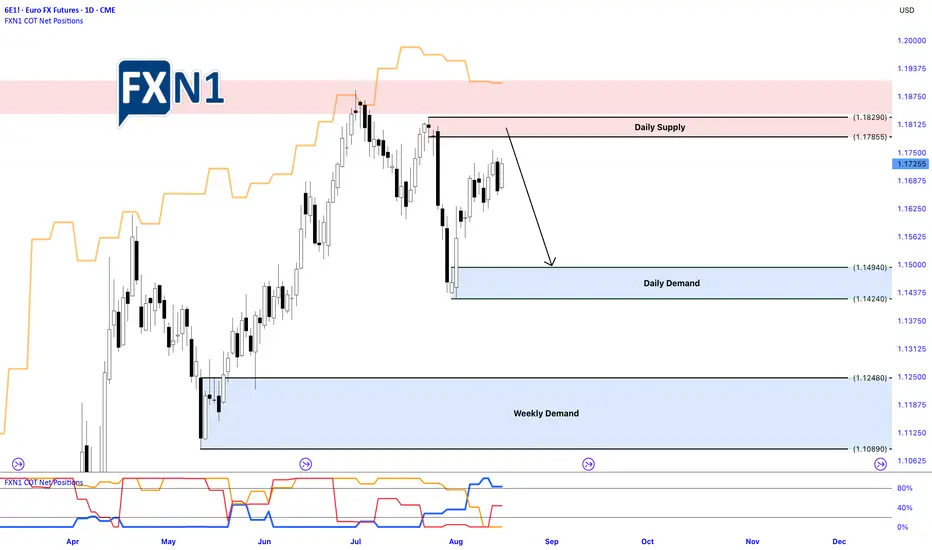
EUR: COT Data Indicates Dollar ResilienceThe EURUSD pair closed the previous week with a bullish weekly candle, positioned within the bounds of a significant two-week-old bearish candle. This pattern suggests a potential pause or consolidation phase after a strong downtrend, but traders should remain cautious as the overall trend still bears the mark of the larger bearish candle.
Recent COT (Commitment of Traders) data provides additional insights into market sentiment. Retail traders have increased their long positions, indicating a more bullish outlook among individual traders. Conversely, both commercial and non-commercial traders are shifting towards bearish positions, signaling a potential underlying strength in the US dollar and a cautious stance among large market participants.
Given these dynamics, there is a high probability that the EURUSD may retest the recent daily supply zone, which has already been touched during the week. If the price moves down from this level, it could signal a continuation of the overall bearish trend, especially considering the COT data's favor towards dollar strength.
What are your thoughts on this setup? Do you see a potential reversal, or will the bullish weekly candle lead to further upside?
✅ Please share your thoughts about 6E1! in the comments section below and HIT LIKE if you appreciate my analysis. Don't forget to FOLLOW ME; you will help us a lot with this small contribution.
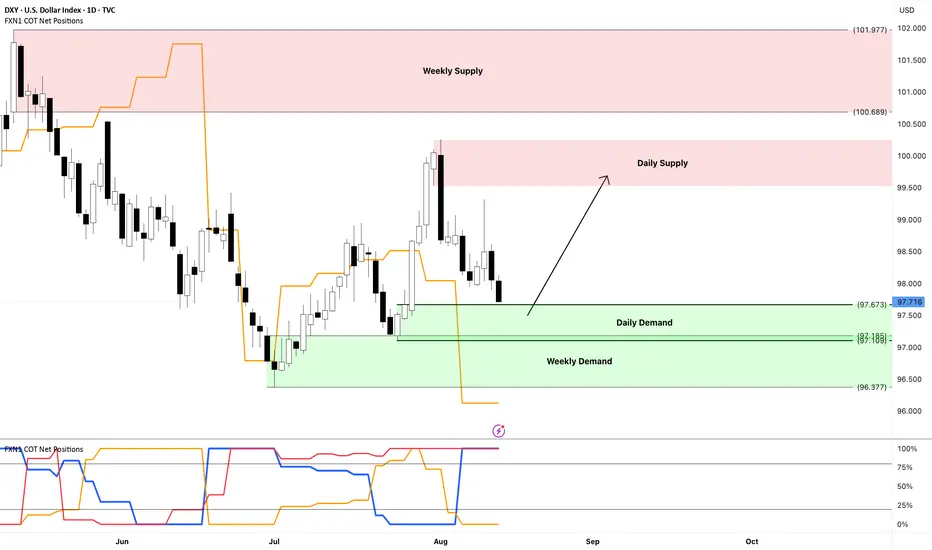
DXY: Potential Reversal Zone as CPI Jobs Data Send Mixed SignalsThe US Consumer Price Index (CPI) report released yesterday acted as a headwind for the dollar. Although core inflation rose to 3.1% year-over-year and 0.33% month-over-month—figures that are not ideal—they are not severe enough to overshadow the recent weakening in the jobs market. On the USD chart, the price is approaching a significant daily demand zone, which is anchored by a weekly demand area. This confluence could potentially serve as a turning point, offering a possible opportunity for the USD to rebound.
✅ Please share your thoughts about DXY in the comments section below and HIT LIKE if you appreciate my analysis. Don't forget to FOLLOW ME; you will help us a lot with this small contribution.
NZD/USD Chart Breakdown and Divergence Amid Market UncertaintyThe U.S. dollar continued its downward trend yesterday, influenced by dovish remarks from Federal Reserve's Kashkari, who aligned with other policymakers in suggesting a potential rate cut as early as September. This shift in tone was largely prompted by the softer-than-expected Non-Farm Payroll (NFP) report released last Friday.
While the employment data wasn’t as dire as initial market reactions suggested, it did cause some reevaluation. Prior to the report, market positioning was geared toward a robust labor market, and the Fed’s hawkish stance had already been priced in. The unexpectedly weak data, therefore, prompted a swift adjustment in expectations, leading to a rapid reprice of the dollar.
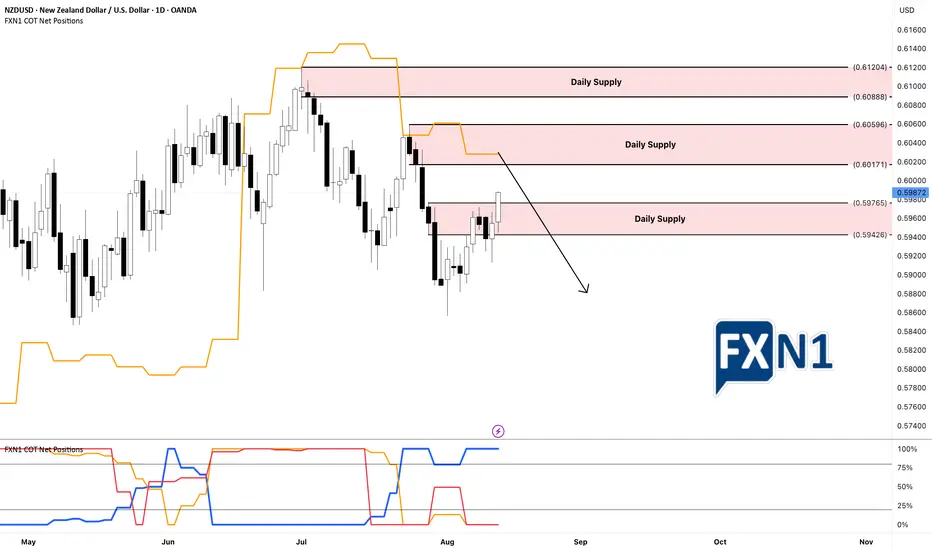
On the technical front, the NZD/USD chart highlights the breach of our previous daily supply zone following the release of the CPI data. However, I’ve decided to place a limit order at the next supply level. From a fundamental perspective, the recent activity of non-commercial traders adding short positions last week indicates a potential divergence between the chart pattern and underlying fundamentals. This divergence suggests opportunities for strategic entries as market sentiment and macroeconomic signals appear to be at odds.
✅ Please share your thoughts about NZDUSD in the comments section below and HIT LIKE if you appreciate my analysis. Don't forget to FOLLOW ME; you will help us a lot with this small contribution.
Gold Prices Slide as Geopolitical Calm Sparks Market DivergenceIn a surprising turn of events, gold prices experienced a sharp decline on Monday, reflecting shifting investor sentiment driven by easing geopolitical concerns and evolving market dynamics. The precious metal fell approximately 1.65% overnight, with the current trading price around $3,399 as of this writing. This downtrend marks a significant departure from recent stability, highlighting the complex interplay of global events and market positioning.
Geopolitical Factors and US Dollar Dynamics
The primary catalyst behind the recent slump has been the easing of geopolitical tensions, particularly surrounding the ongoing Ukraine conflict. Investors are increasingly optimistic about the prospects of diplomatic resolution, bolstered by the upcoming US-Russian summit scheduled for Friday. Many market participants believe that this high-level meeting could pave the way for de-escalation and possibly bring an end to the prolonged war, reducing the perceived need for safe-haven assets like gold.
Simultaneously, a surge in US Dollar buying has contributed to gold's decline. As the dollar strengthens, the relative attractiveness of gold diminishes since it is priced in dollars, making it more expensive for holders of other currencies. This dynamic has compounded the downward pressure on gold prices, further amplifying the current bearish momentum.
Market Positioning: Divergence Between Retail and Institutional Traders
A noteworthy aspect of the current market landscape is the divergence observed between different trader groups. Non-commercial traders, often institutional investors and hedge funds, have increased their long positions on gold. This suggests a continued belief in the metal’s potential as a safe haven or a strategic asset. Conversely, retail traders appear to be shifting towards short positions, possibly reacting to the recent price decline or attempting to capitalize on a short-term correction.
This divergence signals a potential imbalance in market sentiment and could hint at an upcoming volatility spike. Typically, such divergences between large institutional positions and retail sentiment can precede significant price movements, either a reversal or a deeper correction.
Technical Outlook and Upcoming Data Releases
Looking ahead, technical analysts are eyeing the possibility of a further spike down in gold prices before any potential rebound. The current trend suggests a bearish movement, but a volatile market environment could see a sharp correction or a "spike down" between today and the end of the week.
Adding to the market's uncertainty are upcoming macroeconomic data releases, notably the Core Consumer Price Index (CPI) month-over-month and the overall CPI figures. These indicators are critical as they influence expectations regarding Federal Reserve policies and can significantly impact dollar strength and precious metals’ prices. A surprise in these data points could either reinforce the bearish trend or trigger a reversal, especially if inflation figures diverge from consensus estimates.
Trading Strategy: Looking for a Long Setup
Despite the current bearish tone, there is a strategic opportunity for traders to position themselves for a potential rebound. Given the divergence and upcoming data releases, many are eyeing a long setup—buying opportunities that could capitalize on a short-term correction or a reversal once market fears subside.
Traders should monitor key support levels around current prices and watch for confirmation signals in price action and volume. A strong bounce or reversal pattern following the release of inflation data could present an ideal entry point for long positions, aligning with the broader view of a potential spike down followed by a recovery.
Conclusion
Gold remains a dynamic asset influenced by geopolitical developments, currency movements, and trader positioning. While the recent decline signals caution, the divergence in trader sentiment and upcoming economic data provide traders with a strategic landscape ripe for potential opportunities. As always, careful analysis and risk management are paramount in navigating these volatile markets.
✅ Please share your thoughts about GC1! in the comments section below and HIT LIKE if you appreciate my analysis. Don't forget to FOLLOW ME; you will help us a lot with this small contribution.

NZD/USD Faces Resistance at Daily Supply Zone Amid Rising Short On the daily chart, the NZD/USD pair has approached and responded to a significant supply zone. Notably, there has been a marked increase in short positions among non-commercial traders. These initial short entries were established in July, and current market dynamics suggest a potential continuation of the bearish trend. If, throughout this week, the Dollar Index gains momentum and sees an increase in long positions, it could further drive the NZD downward.
✅ Please share your thoughts about NZDUSD in the comments section below and HIT LIKE if you appreciate my analysis. Don't forget to FOLLOW ME; you will help us a lot with this small contribution.

AUD/USD Show Mixed Signals,Market Sentiment Remains Wait-and-SeeThe Dollar Index kicked off the new week with an optimistic tone; however, the overall outlook for the currency appears to be in a state of hesitation. In my view, August may likely see limited volatility, with few significant movements on the horizon. Meanwhile, AUD futures (6A1!) indicate a consolidation around a previous supply zone, suggesting a potential pullback before reaching the next major supply level. Additionally, data shows an increase in short positions among non-commercial traders, which could hint at a possible bearish trend emerging in the near future.
✅ Please share your thoughts about AUDUSD in the comments section below and HIT LIKE if you appreciate my analysis. Don't forget to FOLLOW ME; you will help us a lot with this small contribution.

GBP/USD Faces Key 8-Hour Supply ZoneToday, the GBP/USD futures approached an 8-hour supply zone, presenting a potential shorting opportunity. The price action indicates the beginning of a possible downtrend within this timeframe. Additionally, the latest COT report reveals that non-commercial traders are increasing their short positions, reinforcing the bearish outlook.
It will be crucial to review the upcoming COT report over the weekend for a clearer market perspective. However, based on current signals, the market may be poised for decline. Should this 8-hour supply zone be breached or ignored, another supply area lies just above, which could serve as an alternative resistance level to monitor.
✅ Please share your thoughts about 6B1! in the comments section below and HIT LIKE if you appreciate my analysis. Don't forget to FOLLOW ME; you will help us a lot with this small contribution.
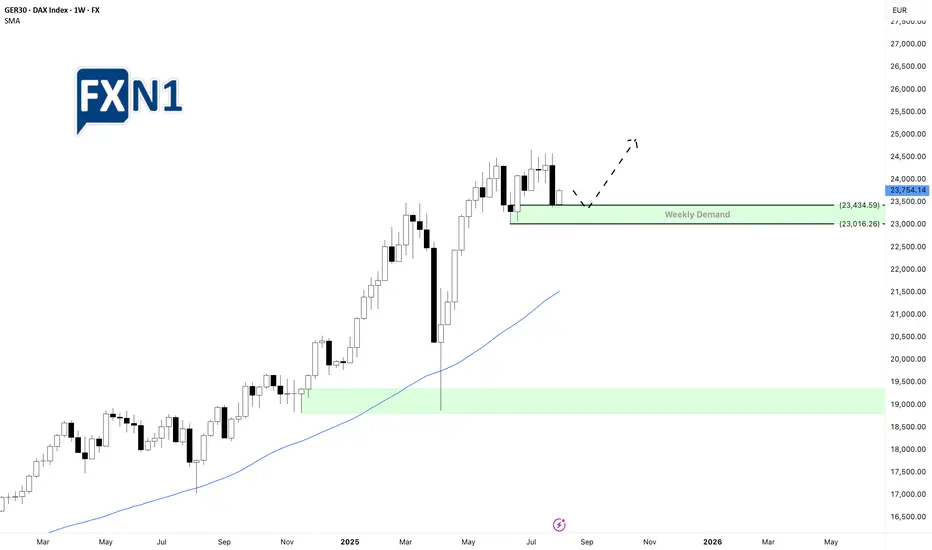
DAX Futures Rebound Amid Shifting US Economic SentimentThe DAX futures are showing a more optimistic tone today, shifting from concerns over weak US labor market data—which initially signaled economic trouble—to a more hopeful outlook that this might prompt the Federal Reserve to consider cutting interest rates, a move that investors see as positive. This shift in sentiment has provided some reassurance as the new week begins.
Following a brief decline on Friday, the market experienced a rebound today, supported by a weekly demand zone. We’re now watching for a retest of key levels within this zone, which could serve as a potential entry point for long positions, aiming for a continuation of the upward momentum driven by the weekly support area.
✅ Please share your thoughts about GER30 in the comments section below and HIT LIKE if you appreciate my analysis. Don't forget to FOLLOW ME; you will help us a lot with this small contribution.