Support Hold & Continuation Toward Premium ResistanceChart Analysis
On the 1H timeframe, Gold is showing a bullish continuation setup after a corrective phase.
Market Structure
Price previously made a strong impulsive drop, then mitigated the FVG (fair value gap) around the 4,65x–4,75x area.
After mitigation, price formed higher lows, signaling a shift from bearish correction to bullish intent.
Current structure is range-to-expansion rather than trendless chop.
Key Levels
Support zone (≈ 5,000–5,030)
This area has been:
Previously resistance
Successfully flipped into support
Multiple candle rejections confirm buyers defending the level
Resistance / Target zone (≈ 5,220–5,260)
Clear supply zone
Likely resting liquidity from prior highs
Logical bullish target if support holds
Trade Idea Logic (as drawn)
Entry: Near support after consolidation
Bias: Bullish continuation
Target: Premium resistance zone
Rationale:
Support hold
Higher-low structure
Previous imbalance already mitigated
Price building acceptance before expansion
What Would Invalidate This Setup
A clean H1 close below the support zone
Loss of higher-low structure → opens risk of deeper retrace toward the FVG again
Overall Bias
📈 Bullish while above support
This is a classic buy-the-dip into support → target premium liquidity setup.
Forexnews

Demand ZXAUUSD (Gold) H1 – one Reversal Trade IdeaMarket Structure
Gold is trading within a broader descending trendline, indicating a short-term bearish structure. However, price has reacted strongly from a well-defined H1 demand zone, suggesting buyers are stepping in at discounted levels.
Key Levels
Demand Zone: ~4,670 – 4,720
Immediate Resistance: ~4,895 (trendline + horizontal resistance)
Target 1: ~4,965
Target 2: ~5,059
Trade Idea (Counter-trend Bounce)
Bias: Short-term bullish correction within a bearish trend
Entry: Bullish confirmation from the demand zone (engulfing / strong H1 close above minor resistance)
Stop Loss: Below the demand zone low
Take Profit:
TP1 at first resistance / structure high
TP2 near the descending trendline resistance
Invalidation
A strong H1 close below the demand zone would invalidate the bullish setup and favor continuation to the downside.
Summary
This setup focuses on a technical bounce from demand, targeting nearby resistance

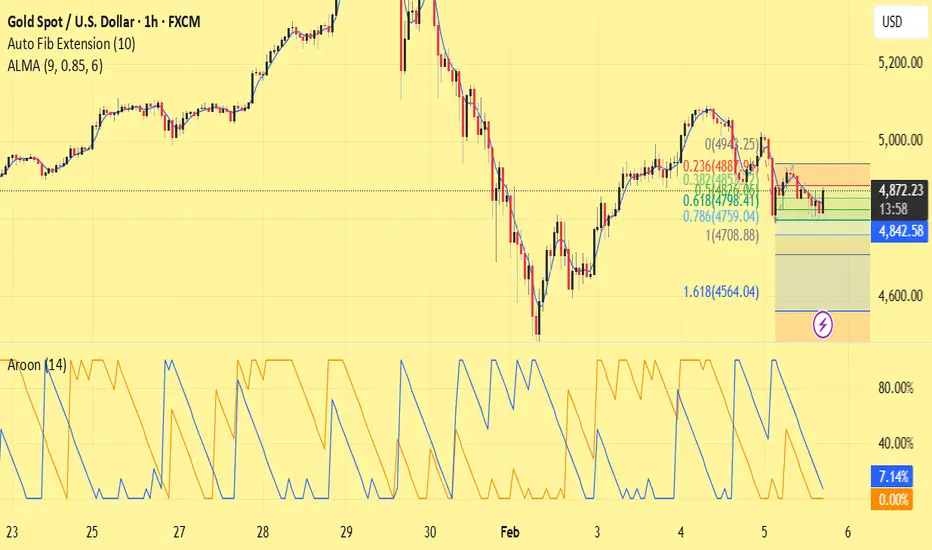
Fibonacci Resistance Caps the Recovery | Consolidation PhaseChart Analysis
Market Structure
After a sharp sell-off, Gold staged a technical rebound but is now trading in a sideways to corrective phase below a key Fibonacci resistance zone. The structure suggests a corrective pullback within a broader bearish swing, rather than the start of a new uptrend.
Technical Confluence
Fibonacci Retracement: The 0.236 – 0.382 zone is acting as resistance and limiting further upside.
ALMA (9): Price is hovering around the moving average, indicating weak momentum and indecision.
Auto Fib Extension: The 1.618 extension remains a potential downside target if selling pressure resumes.
Aroon (14): Weak Aroon Up and relatively stronger Aroon Down point to fading bullish strength.
Price Action
Repeated upper wicks and small-bodied candles near resistance signal supply pressure. Buyers have so far failed to achieve a clean breakout above the resistance area.
Trade Idea
Bias: Neutral to Bearish
Sell Zone: Rejection from the Fibonacci resistance zone
Targets:
First target: Recent swing low
Extended targets: 0.786 retracement / 1.618 extension
Invalidation: A clear and sustained close above the 0.382 Fibonacci level
Conclusion
As long as XAUUSD remains below the Fibonacci resistance and momentum stays weak, the current price action is best viewed as consolidation ahead of a potential downside continuation.
Always manage risk and wait for confirmation.
XAUUSD H1 – Corrective Pullback Within Broader Bullish StructureGold (XAUUSD) on the 1-hour timeframe remains within a broader bullish structure, but price is currently undergoing a corrective phase. After reaching a major swing high, the market faced strong rejection from the descending red trendline, triggering a sharp pullback.
The recent decline respected the Fibonacci retracement zone, with price reacting strongly between the 0.618–0.786 levels, indicating active demand from buyers. This zone aligns with prior structure support, reinforcing its technical significance. The recovery from the lows shows higher lows, suggesting short-term bullish intent, though momentum is slowing near resistance.
Price is now trading below the descending trendline and near the upper Fibonacci retracement area, where sellers are showing interest. A clear break and hold above the trendline would open the door for a continuation toward the previous highs. Conversely, rejection from this area could lead to another retest of the mid or lower Fibonacci support levels.
The Aroon Oscillator is turning negative, signaling weakening bullish momentum and increasing risk of consolidation or a short-term pullback before the next directional move.
Key Levels to Watch:
Resistance: Descending trendline / recent swing high zone
Support: 0.618–0.786 Fibonacci retracement area
Bias: Neutral to cautiously bullish while above key support
This setup favors patience—waiting for either a confirmed breakout above resistance or a bullish reaction from support for higher-probability entries.

XAUUSD – Bullish Reversal from Demand Zone (H1)Gold (XAUUSD) previously traded within a well-defined ascending channel, confirming a strong bullish structure. After reaching the upper boundary, price experienced a sharp bearish correction, breaking down from the channel and forming a capitulation-style move to the downside.
Following this decline, price found strong support at a key demand zone around the 5,000 area, where buyers stepped in aggressively. The reaction from this zone formed a rounded bottom / V-shaped recovery, indicating a shift in momentum from bearish to bullish.
Price has now reclaimed the demand zone and is showing continuation strength to the upside. As long as price holds above this zone, bullish continuation remains the higher-probability scenario.
Trade Bias: Bullish above demand zone
Entry Zone: Demand zone retest / bullish continuation above 5,000
Targets:
Target 1: 5,120
Target 2: 5,198
Invalidation:
A sustained break and close below the demand zone would invalidate the bullish setup.
This setup aligns with demand–supply theory, trend continuation, and momentum shift, favoring buyers in the near term.

XAUUSD Bullish Reversal from Demand Zone Upside Continuation SetGold (XAUUSD) shows a strong bullish reversal after a sharp corrective move from the recent highs. Price declined aggressively and formed a rounded bottom structure, signaling exhaustion of selling pressure and a shift in momentum.
The market found solid support at a key demand zone, from where buyers stepped in decisively. After the bounce, price retraced back into a previous supply-turned-demand area, which is now acting as a valid buy entry zone. This level has been respected, confirming bullish intent.
With higher lows forming and momentum turning positive, price is expected to continue its upside move toward the next resistance / target zone highlighted above. A clean break and hold above the entry zone strengthens the bullish continuation scenario.
Bias: Bullish
Structure: Rounded bottom / demand-based reversal
Entry Area: Marked demand zone
Target: Prior resistance zone
Risk management is advised in case of a breakdown below the demand zone.

GBP/USD Forecast: Navigating Volatility in 2026The GBP/USD pair currently consolidates near the 1.37 mark as February 2026 begins. A partial U.S. government shutdown has clouded the immediate outlook. This event delays critical labor market data, leaving traders in a state of cautious observation. While Sterling remains resilient, the Greenback faces unique pressures from domestic policy shifts.
Geostrategy and the US Power Shift
Geopolitical maneuvers define the current currency landscape. President Trump’s recent decision to lift tariffs on India has improved global risk appetite. This move reduced the immediate demand for the "safe-haven" U.S. Dollar. However, tensions remain high as the administration balances aggressive trade stances with domestic economic stability. Investors now watch for shifts in global alliances that could redefine the Dollar’s dominance.
Leadership Tensions at the Federal Reserve
A significant legal cloud hangs over the American central bank. Recent news of a Grand Jury subpoena targeting the Federal Reserve has shaken investor confidence. Markets fear that political pressure on Chairman Jerome Powell could undermine the Fed’s independence. If leadership changes occur, a more "interest-rate-friendly" chair might take over. Such an event would likely weaken the Dollar and drive the Pound higher.
Bank of England: Professional Stability
The Bank of England (BoE) provides a contrast in leadership style. Ahead of the February 5th policy meeting, the BoE maintains a steady, data-led approach. While analysts expect interest rates to remain unchanged, recent inflation upticks suggest a hawkish tone. This professional consistency supports Sterling’s value. It positions the Pound as a stable alternative to the volatile American political environment.
Technological Innovation and Patent Analysis
London’s "Silicon Roundabout" continues to drive Sterling’s long-term appeal. The UK leads in blockchain and fintech patent filings for 2026. These high-tech innovations attract significant foreign direct investment (FDI) into the British economy. Institutional investors view these patents as a "moat" protecting the UK's financial services sector. As a result, the Pound benefits from structural support beyond simple interest rate differentials.
Macroeconomics: The Shutdown Effect
The U.S. government shutdown is the primary macroeconomic driver today. It creates "data gaps" that make traditional fundamental analysis difficult for novice traders. Without non-farm payroll reports, the market relies on behavioral sentiment. Historically, prolonged shutdowns hurt GDP growth, which weighs on currency valuation. Traders must navigate this uncertainty by focusing on technical support levels near 1.3650.
Cybersecurity and Financial Science
Cybersecurity has become a core pillar of currency stability. Both the Fed and BoE have invested heavily in "Quantum-Resistant" encryption for payment systems. These scientific advancements ensure the integrity of the GBP/USD exchange infrastructure. A successful defense against rising global cyber threats prevents sudden, catastrophic drops in currency trust. For traders, this technological "shield" provides a layer of invisible security.
Summary for Traders
The GBP/USD pair is currently in a "wait-and-see" phase. The combination of U.S. political instability and UK technological resilience keeps the rate range-bound. Watch the 1.3745 resistance level closely this week. A breakout above this point could signal a new bullish trend for the Pound. Conversely, a prolonged shutdown could eventually trigger a flight to safety, ironically boosting the Dollar.

EUR/USD – 1H | Range Breakdown & Bearish Continuation SetupEUR/USD previously traded in a clear accumulation range (green box), which acted as a base for a strong bullish impulsive move. After the breakout, price entered a distribution / consolidation zone (blue box), where upside momentum weakened and sellers gradually gained control.
Price has now broken below the range support, confirming a bearish range breakdown. The current structure shows:
Lower highs forming inside the range before the breakdown
Strong rejection from the upper boundary of the blue zone
Acceptance below the range, indicating bearish continuation potential
Bias: Bearish
Key Level: Former range support acting as resistance
Expectation: A corrective pullback toward the broken support, followed by continuation to the downside.
Trade Idea (Conceptual):
Look for sell opportunities on retracements into the broken range
Bearish continuation favored while price remains below the range low
Downside targets lie toward the next demand zone / liquidity below
Market Logic:
This is a classic range expansion → distribution → breakdown scenario. Once price fails to reclaim the range, continuation moves often follow as trapped buyers exit positions.

BTCUSD – Bearish Continuation After Range Breakdown (1H)Bitcoin was previously moving inside a clear consolidation range (highlighted in green). Price broke below the range support, triggering strong bearish momentum and confirming a bearish market structure shift.
Key Technical Levels
Range High / Supply Zone:
The upper red zone represents previous support that has now flipped into resistance.
Range Low / Demand Zone:
The lower red zone marks a key liquidity area where price may react.
Break & Retest:
Price retraced back into the broken support zone and faced strong rejection, validating the bearish bias.
Trade Idea
Bias: Bearish
Entry Area: Sell on pullback into resistance (around 81,500 – 82,500)
Target 1: Lower consolidation support (Target 1)
Target 2: Deeper downside continuation (Target 2)
Stop Loss: Below invalidation level (around 75,700)
Technical Confluence
Clear range breakdown
Strong impulsive bearish move
Lower highs forming on retracement
Support turned resistance confirmation
Outlook
As long as price stays below the broken range and supply zone, the bearish continuation scenario remains valid. Any retracement into resistance may offer high-probability short setups with favorable risk-to-reward.

XAUUSD (Gold) – Bearish Continuation After Channel BreakdownGold previously respected a well-defined ascending channel, showing a strong bullish trend. However, price broke decisively below the channel, signaling a trend shift from bullish to bearish. The breakdown was followed by strong bearish momentum, confirming seller dominance.
Key Technical Zones
Broken Support → Resistance:
The marked red zones are former support areas that have now turned into supply / resistance.
Rejection Confirmation:
Price retested these zones and faced strong bearish rejection, validating them as sell areas.
Trade Idea
Bias: Bearish
Entry Zone: Sell on pullback into resistance (around 4,980 – 5,100)
Target 1: Previous demand zone (Target 1)
Target 2: Lower support / continuation target (Target 2)
Stop Loss: Below the invalidation level (around 4,726)
Confluence Factors
Ascending channel breakdown
Lower highs and lower lows forming
Strong bearish impulse after retest
Clear risk-to-reward structure
Conclusion
As long as price remains below the broken channel and resistance zones, the bearish scenario remains valid. Any retracement into resistance may offer high-probability sell opportunities targeting lower liquidity zones.

XAUUSD – Buy Zone ReactionContext: Strong bullish move → distribution → sharp selloff.
Current structure: Price dumped into a prior demand / liquidity area (your buy zone).
Reaction: Clear bullish response from the zone (long lower wick + impulse candle).
Plan:
Buy zone: Prior demand / sweep of lows
Target: Previous support-turned-resistance (that blue box above)
Why the idea makes sense
✅ Liquidity sweep below recent lows before the bounce
✅ HTF bullish bias still intact despite the pullback
✅ Discount entry relative to the prior range
✅ Target aligns with a retest of broken structure
This is a classic pullback → mitigation → continuation setup. Clean and logical.
What to watch out for (important)
⚠️ If price closes strongly below the buy zone, idea is invalid
⚠️ That target zone is likely to be reaction-heavy (partial profits make sense)
⚠️ Best confirmation would be:
Lower-timeframe BOS
Bullish engulfing / strong displacement candle
Volume expansion on the bounce
How I’d manage it
Entry: Inside buy zone only after confirmation
Stop: Below the liquidity sweep low
TP1: Mid-range / first resistance
TP2: Your marked target zone

EURUSD 1H – Demand Zone Rejection Setup EURUSD previously moved in a strong bullish channel, indicating healthy upward momentum. After reaching the channel high, price faced selling pressure and transitioned into a consolidation phase.
The marked demand zone is acting as a key resistance-turned-supply area. Price is currently reacting below this zone, forming a lower high structure, which suggests potential bearish continuation.
A rejection from the demand zone combined with the current structure opens the door for a pullback toward the lower support / target zone, highlighted on the chart.
Key Levels
Demand Zone: Upper red zone (sell pressure area)
Entry Area: Rejection below demand
Target: Lower red support zone
Trade Bias
Bias: Bearish below demand zone
Invalidation: Strong breakout and close above demand

BTCUSD 1H – Range Support Buy SetupBitcoin is currently trading inside a well-defined range structure on the 1-hour timeframe. Price has repeatedly respected the range support zone, indicating strong demand at lower levels.
The highlighted green zone represents a key buy area, where price previously consolidated and reacted multiple times. The recent pullback into this zone suggests a potential bullish continuation if support holds.
A clear support line is marked below the range. As long as price remains above this level, bullish bias remains valid. The stop-loss is placed below structural support to protect against a range breakdown.
Upside targets are positioned toward the upper range resistance, where previous selling pressure was observed.
Key Levels
Buy Zone: Range support / demand area
Stop Loss: Below support line
Target: Upper range resistance / liquidity zone
Trade Bias
Bias: Bullish while above support
Invalidation: Strong close below support

XAUUSD (Gold Spot) – Bullish Continuation Setup | 1HGold is trading within a well-defined ascending channel, confirming strong bullish structure with higher highs and higher lows. Price has broken above recent resistance and is now showing signs of healthy continuation.
🔹 Entry Zone:
Buying interest is expected around the marked buy zone, where previous resistance has flipped into support.
🔹 Re-entry Area:
If price retraces slightly, the highlighted re-entry zone offers another opportunity to join the trend in line with bullish momentum.
🔹 Stop Loss:
Placed below the structure low and channel support to protect against a trend invalidation.
🔹 Target:
Upside target is aligned with the upper resistance zone, following the channel projection and momentum continuation.
📌 Bias: Bullish
📌 Market Structure: Higher highs & higher lows
📌 Risk Management: Trade only with proper position sizing
⚠️ Always wait for confirmation and manage risk accordingly. This analysis is based purely on technical structure.

XAUUSD Bullish Structure | Trendline + DemandGold is in a strong bullish trend (clean higher highs & higher lows).
Price respected the ascending trendline, showing buyers are in control.
The green zones mark demand / buy-on-dip areas where price previously reacted.
After a strong impulse up, price is doing a healthy pullback into demand.
The arrow up shows expectation of trend continuation toward the upper liquidity / target zone.
Trading Logic:
Bias: Bullish
Setup: Impulse → Pullback to demand + trendline → Continuation
Entry idea: Buy from the demand zone / trendline support
Invalidation: Clear break below the demand zone
Target: Previous highs and the upper green (premium) area

XAUUSD (Gold) – Bullish Continuation Setup | 1HGold is trading within a well-defined ascending channel, indicating a strong bullish structure on the 1-hour timeframe. Price recently made a healthy pullback into a key demand zone, which aligns with the lower boundary of the rising channel.
The highlighted zone has already acted as support, and buyers are stepping back in, suggesting bullish continuation. As long as price holds above this support area, the probability favors a move toward the upper resistance / previous highs.
🔹 Market Structure: Higher highs & higher lows
🔹 Key Confluence: Ascending channel + demand zone
🔹 Bias: Bullish continuation
🔹 Invalidation: Clean break and close below the demand zone
📌 Waiting for bullish confirmation inside the zone can improve risk-to-reward.
⚠️ Always manage risk and wait for confirmation before entry.

XAUUSD (Gold) – Bullish Pullback From Buy Zone Targeting PreviouThis chart shows Gold Spot / U.S. Dollar (XAUUSD) on the 1-hour timeframe. Price is in a strong bullish trend, having made a sharp impulsive move to the upside followed by a corrective pullback.
The lower highlighted area represents a buy zone, aligned with prior structure support and demand.
Price reacted from this zone, indicating buyer interest and potential continuation of the uptrend.
The upper highlighted area marks the target / resistance zone, corresponding to previous highs where partial or full profit can be considered.
The overall structure suggests a buy-the-dip setup, with bullish continuation expected as long as price holds above the buy zone.
This setup reflects trend continuation after correction, favoring bullish momentum toward the marked target area.

Gold (XAU/USD) Price Action – Resistance Breakout & Target SetupThis image shows a Gold (XAU/USD) 45-minute TradingView chart illustrating a strong bullish move.
Price has sharply moved up from the lower levels, indicating strong buying momentum. A support level is marked around 4804, from where price accelerated upward. The chart highlights an entry zone near 4858–4872, which is also marked as a resistance level. Price is currently testing this resistance area.
Above the resistance, a target level is marked around 4910–4920, suggesting a potential upside objective if price breaks and holds above resistance. Overall, the chart represents a bullish breakout setup, where confirmation above resistance could lead to further upward movement in gold prices.

XAUUSD – Major Range Breakout Followed by Rejection SetupGold spent an extended period trading within a well-defined accumulation range, repeatedly respecting the lower support zone. Multiple failed breakdown attempts from support indicated strong buyer interest and absorption of sell pressure.
Price eventually delivered a high-momentum bullish breakout from the range, confirming a structural shift and aggressive participation from buyers. However, upon reaching the higher-timeframe resistance zone near 4,730–4,740, bullish momentum stalled, signaling potential exhaustion.
The current structure suggests a rejection from resistance, with price showing signs of a pullback toward the previous breakout base and demand area.
Key Levels:
Resistance / Sell Zone: 4,730 – 4,740
Invalidation: Sustained acceptance above resistance
Support / Target Area: 4,665 – 4,658
Intermediate Reaction Level: 4,705 – 4,695
Trade Idea Logic:
A rejection from resistance favors a corrective move back into the breakout structure, where buyers may attempt to defend price. Failure to hold above intermediate support increases the probability of a deeper retracement toward the marked demand zone.
Bias: Short-term bearish (pullback), overall bullish structure intact

USD/ARS Outlook: Milei’s Inflation-Linked PivotArgentina has officially changed how it manages the Peso. President Javier Milei’s government introduced a new currency band tied to inflation. This move replaces the old fixed system. The goal is to stop the Peso from becoming too expensive. Markets reacted calmly, with the Peso shifting slightly. This analysis explores why this matters for the USD/ARS pair.
Macroeconomics: The Inflation Link
The Central Bank of Argentina (BCRA) changed its trading rules. Previously, the Peso devalued by a fixed 1% monthly. Now, the trading band adjusts based on official inflation data. This prevents the currency from lagging behind real prices. The bank aims to build $17 billion in reserves. This liquidity is vital for stabilizing the economy. GDP is forecast to grow 3.5% next year, signaling a recovery.
Geopolitics & Strategy: Pleasing the IMF
This monetary shift is a strategic diplomatic move. The International Monetary Fund (IMF) openly urged Argentina to rebuild reserves. By loosening controls, Milei aligns with Western financial standards. This compliance is crucial for regaining access to international debt markets. It signals to global investors that Argentina is serious about paying its debts. This reduces the risk of default and attracts foreign capital.
Management & Leadership: The "Turnaround CEO"
View Milei’s administration as a corporate restructuring team. He acts like a CEO saving a bankrupt company. The "culture" has shifted from spending to austerity. He prohibited the Central Bank from printing money to fund the government. This is a massive leadership change. It forces the public sector to manage budgets strictly. This discipline builds trust in the management of the Argentine economy.
Industry Trends: The Tourism Flip
Currency value dictates tourism flow. A strong Peso made Brazil cheap for Argentines. Record numbers flocked to Brazilian beaches, spending money abroad. Conversely, foreign tourism to Argentina dropped 14% because it became too expensive. The new policy corrects this. A weaker Peso makes Argentina attractive to visitors again. This supports local hotels and restaurants that were losing business to neighbors.
Business Models: Exporters vs. Importers
The previous rigid exchange rate hurt Argentine exporters. Their costs rose with inflation, but their revenue stayed flat due to the currency peg. The new inflation-linked band fixes this broken business model. Farmers and manufacturers can now predict margins accurately. They no longer fear that inflation will eat their profits. This stability encourages them to sell goods abroad, bringing dollars into the country.
Technology & Cyber: Fintech Stability
A predictable currency is essential for the technology sector. Volatile exchange rates force tech companies to focus on financial hedging rather than product innovation. Stability allows fintech startups to plan long-term. It also reduces the need for citizens to use complex crypto-channels to hide wealth. A normalized economy reduces the incentive for digital black markets and cyber-financial crimes.
Science & Patent Analysis
Scientific progress requires long-term investment. Investors tend to avoid funding research in countries with unstable currencies. Milei’s push for a market-based currency helps value intellectual property (IP) correctly. International firms can now assess the value of Argentine patents without currency risk. This clarity could boost foreign direct investment (FDI) into Argentina’s scientific and biotech sectors.
Conclusion
The USD/ARS pair is entering a phase of controlled adjustment. The government will let the Peso weaken, but only to match inflation. This is a smart, calculated decline. It protects reserves and supports local industry. For traders, this means the trend is predictable. The volatility of the past may be replaced by a steady, managed trend.

EURUSD: Pre-NFP Analysis - Key Breakdown LevelsFocus on EURUSD ahead of today's Non-Farm Payroll and major US economic data releases (December 16th, 2025).
📰 Market Context:
Major News Events Today:
Non-Farm Payroll (NFP)
Additional major US economic releases
Market participants in wait-and-see mode
Current Price Action:
Following Monday's break above 1.17627, price has entered a sideways consolidation pattern. This pause indicates market participants are positioning ahead of the news before committing to the next directional move.
📊 Technical Analysis:
Recent Structure:
From last week's analysis, EURUSD has shown multiple bearish trend-changing patterns. These patterns suggest underlying weakness despite the recent rally.
Current Setup:
The extended rally has pushed price significantly higher. At current levels, it wouldn't take much to trigger profit-taking from buyers who entered earlier in the move. The NFP data could be the catalyst.
🎯 Key Levels to Watch:
Level 1 - Breakdown Point: 1.17379
Initial breakdown confirmation. Break below signals weakness.
Level 2 - Major Breakdown: 1.17193
Critical support. Break here confirms major bearish structure shift.
💼 Trade Setup:
Sell Entry: Close below 1.17734
Wait for candle close below this level for confirmation.
Stop Loss: 1.0780
Invalidation above this level.
Risk: 46 pips
Targets: Breakpoint Two
T1: 1.17379 (initial breakdown)
T2: 1.17193 (major breakdown)
⚠️ Risk Management:
Be cautious of NFP volatility:
Expect increased noise immediately after news release
Wider spreads possible
Potential whipsaws before directional move
Wait for candle close confirmation, not just spikes
Strategy: Let the news settle, then trade the confirmed direction rather than the initial spike.
Trading Principle:
News creates volatility, but structure determines direction. Multiple bearish patterns + profit-taking zone + news catalyst = high-probability setup IF structure confirms.
👍 Hit the boost button if this pre-NFP analysis helps
👤 Follow for post-NFP follow-up analysis
💬 Drop your questions in the comments

Global Trade in the Modern MarketStructure, Dynamics, and Strategic Importance
Global trade in the modern market represents one of the most powerful engines of economic growth, innovation, and international interdependence. Unlike earlier eras—when trade was limited by geography, slow transportation, and fragmented information—today’s global trade ecosystem operates at high speed, across digital platforms, and through deeply integrated supply chains. Goods, services, capital, data, and technology now move across borders with unprecedented scale and complexity, reshaping how nations compete and collaborate.
1. Evolution of Global Trade
Modern global trade has evolved from simple bilateral exchange into a sophisticated, multi-layered network. Containerization revolutionized logistics, reducing costs and transit times. The rise of multinational corporations (MNCs) fragmented production into global value chains (GVCs), where design, manufacturing, assembly, and marketing occur in different countries. Digitalization further transformed trade by enabling real-time coordination, e-commerce, and cross-border services that require no physical shipment at all.
2. Key Drivers of Modern Global Trade
Several forces define today’s trading environment:
Technology and Digital Platforms: Cloud computing, AI, and data analytics optimize inventory, pricing, and demand forecasting. Digital marketplaces allow even small firms to access global customers.
Trade Liberalization: Free trade agreements (FTAs) and regional blocs reduce tariffs, harmonize standards, and encourage cross-border investment.
Capital Mobility: Global finance supports trade through credit, hedging instruments, and risk management tools such as futures, options, and insurance.
Consumer Demand: Rising incomes in emerging markets fuel demand for diverse products, while developed markets seek cost efficiency and innovation.
3. Structure of Global Trade Flows
Modern trade flows extend beyond physical goods:
Merchandise Trade: Includes commodities (energy, metals, agriculture) and manufactured goods (electronics, automobiles, machinery).
Services Trade: Finance, IT services, logistics, consulting, tourism, and digital services are growing faster than goods trade.
Intellectual Property and Data: Licensing, software, patents, and data flows are now critical trade assets.
Capital and Investment: Foreign direct investment (FDI) supports production hubs and market access.
4. Role of Global Value Chains (GVCs)
Global value chains are the backbone of modern trade. A single product—such as a smartphone—may involve raw materials from Africa, components from East Asia, design from the US or Europe, and assembly in Southeast Asia. This specialization increases efficiency but also creates vulnerability. Disruptions like pandemics, geopolitical tensions, or natural disasters can ripple across the entire chain, forcing firms to rethink resilience and diversification.
5. Emerging Markets and Trade Power Shifts
The modern trade landscape reflects a gradual shift from a unipolar system to a multipolar one. Emerging economies—particularly in Asia, Latin America, and parts of Africa—are no longer just low-cost manufacturers. They are becoming:
Major consumer markets
Innovation hubs
Strategic suppliers of critical resources
Countries like China, India, Vietnam, and Mexico play increasingly central roles in global production and trade negotiations, influencing pricing, standards, and supply-chain strategies.
6. Geopolitics and Trade Policy
Trade today is inseparable from geopolitics. Tariffs, sanctions, export controls, and industrial policies are used as strategic tools. Governments prioritize:
Economic security (semiconductors, energy, food)
Supply-chain sovereignty
Strategic alliances and friend-shoring
This has led to partial de-globalization or “re-globalization,” where trade is restructured around trusted partners rather than purely cost-based efficiency.
7. Financial Markets and Trade Integration
Modern trade is closely linked with global financial markets:
Foreign Exchange (FX): Currency movements directly impact trade competitiveness and profitability.
Derivatives: Futures and options help exporters and importers hedge price and currency risks.
Trade Finance: Letters of credit, guarantees, and supply-chain finance enable liquidity and trust across borders.
This integration allows trade to scale rapidly but also exposes it to financial volatility and capital flow reversals.
8. Sustainability and ESG in Global Trade
Environmental, Social, and Governance (ESG) considerations are reshaping trade decisions. Companies and governments now factor in:
Carbon footprints and green logistics
Ethical sourcing and labor standards
Circular economy principles
Carbon border taxes, sustainability-linked financing, and green trade corridors are emerging as defining features of modern global commerce.
9. Digital Trade and the Future of Commerce
Digital trade is one of the fastest-growing segments:
Cross-border e-commerce platforms connect sellers and buyers directly.
Digital payments and blockchain improve transparency and settlement.
Services like cloud computing, online education, and remote work are traded globally without physical borders.
Regulation of data flows, cybersecurity, and digital taxation will heavily influence the next phase of global trade.
10. Risks and Challenges in the Modern Trade System
Despite its scale and efficiency, modern global trade faces key challenges:
Supply-chain disruptions
Trade wars and protectionism
Currency volatility
Regulatory fragmentation
Climate-related risks
Managing these risks requires diversification, strategic inventory management, and advanced risk-hedging tools.
11. Strategic Importance of Global Trade
Global trade is more than economic exchange—it is a strategic asset. It shapes:
National growth and employment
Corporate profitability and competitiveness
Innovation diffusion
Global political influence
Countries that master trade logistics, financial integration, and technological adoption gain long-term strategic advantages.
Conclusion
Global trade in the modern market is a complex, fast-moving, and deeply interconnected system. It blends physical goods, digital services, finance, and geopolitics into a single global framework. While efficiency and scale have reached historic highs, resilience, sustainability, and strategic alignment are now equally important. The future of global trade will not be defined solely by how cheaply goods move across borders, but by how intelligently, securely, and sustainably global markets are connected.
Cross-Border Payments: The Future of Global Money MovementUnderstanding Cross-Border Payments
At its core, a cross-border payment occurs when the payer and the recipient are located in different countries and the transaction involves at least two different currencies or financial systems. Examples include an Indian exporter receiving payment from a US buyer, a migrant worker sending money to family back home, or a multinational company paying overseas suppliers.
Unlike domestic payments, cross-border payments must navigate differences in currencies, banking regulations, time zones, compliance standards, and settlement systems. This makes them slower, costlier, and more complicated than local transactions.
How Cross-Border Payments Work
Traditional cross-border payments are typically processed through correspondent banking networks. In this system, banks maintain relationships with foreign banks (correspondent banks) to facilitate international transfers. When a payment is initiated, it may pass through multiple intermediary banks before reaching the final beneficiary. Each intermediary charges a fee and adds processing time.
The SWIFT (Society for Worldwide Interbank Financial Telecommunication) network plays a major role by providing secure messaging between banks. However, SWIFT itself does not move money; it only sends payment instructions. Actual fund settlement happens through bank accounts held across borders.
In recent years, alternative mechanisms have emerged, including fintech platforms, digital wallets, and blockchain-based systems, which aim to simplify and speed up cross-border transfers.
Key Participants in Cross-Border Payments
Several entities are involved in the cross-border payment ecosystem:
Banks and Financial Institutions: Provide traditional wire transfers and trade finance services.
Payment Service Providers (PSPs): Companies like PayPal, Wise, and Stripe offer faster and more transparent international payments.
Central Banks: Regulate currency flows and oversee payment systems.
Clearing and Settlement Systems: Ensure final transfer of funds between institutions.
Businesses and Individuals: End users such as exporters, importers, freelancers, students, and migrant workers.
Costs and Fees in Cross-Border Payments
One of the biggest challenges in cross-border payments is cost. Fees may include:
Transfer fees charged by banks or PSPs
Currency conversion or foreign exchange (FX) margins
Intermediary bank charges
Compliance and documentation costs
For small-value transactions like remittances, these costs can be disproportionately high. Reducing fees has become a global priority, especially for developing economies where remittances are a major source of income.
Speed and Transparency Issues
Traditional cross-border payments can take anywhere from one to five business days to settle. Delays occur due to manual processing, time zone differences, compliance checks, and multiple intermediaries. Additionally, senders often lack transparency on where their money is during the transfer process and what total fees will be deducted.
Modern digital payment platforms are addressing these issues by offering near real-time transfers, upfront fee disclosure, and end-to-end tracking.
Regulatory and Compliance Challenges
Cross-border payments are subject to strict regulatory requirements, including anti-money laundering (AML), combating the financing of terrorism (CFT), and know-your-customer (KYC) rules. Each country has its own regulatory framework, which can create friction and increase compliance costs.
Sanctions, capital controls, and geopolitical tensions further complicate cross-border transactions. Financial institutions must continuously monitor regulatory changes to avoid penalties and ensure smooth operations.
Role of Technology in Cross-Border Payments
Technology is transforming the cross-border payments landscape. Fintech innovations are reducing reliance on correspondent banking and improving efficiency. Key technological trends include:
Blockchain and Distributed Ledger Technology (DLT): Enables faster settlement and reduced intermediaries.
Application Programming Interfaces (APIs): Allow seamless integration between payment systems.
Real-Time Payment Networks: Enable instant or near-instant transfers across borders.
Artificial Intelligence (AI): Enhances fraud detection and compliance monitoring.
These innovations are making cross-border payments more accessible, especially for small businesses and individuals.
Cross-Border Payments and Global Trade
International trade depends heavily on efficient cross-border payment systems. Exporters need timely payments to manage cash flows, while importers seek secure and cost-effective settlement options. Trade finance instruments such as letters of credit, bank guarantees, and documentary collections are closely linked to cross-border payment mechanisms.
Efficient payment systems reduce transaction risks, improve trust between trading partners, and support global supply chains.
Importance of Cross-Border Remittances
Remittances are one of the most significant components of cross-border payments, particularly for emerging economies. Millions of migrant workers send money home regularly to support families, education, healthcare, and housing. These flows contribute significantly to national income and economic stability.
Improving the affordability and speed of remittance services can have a direct positive impact on financial inclusion and poverty reduction.
The Future of Cross-Border Payments
The future of cross-border payments is moving toward greater speed, lower cost, and enhanced transparency. Central bank digital currencies (CBDCs), global payment interoperability, and standardized compliance frameworks are expected to play a major role.
Collaboration between banks, fintech firms, regulators, and international organizations will be crucial in building efficient global payment infrastructure. As technology evolves, cross-border payments are likely to become as seamless as domestic transactions.
Conclusion
Cross-border payments are a vital pillar of the global financial system, enabling trade, investment, and personal financial connections across nations. While traditional systems face challenges related to cost, speed, and complexity, technological innovation and regulatory cooperation are driving meaningful improvements. As the world becomes more interconnected, efficient and inclusive cross-border payment systems will be essential for sustainable global economic growth.
