Market next move 1. Weak Momentum Into Resistance
The candles near resistance are small-bodied and lack strong bullish volume.
Disruption: This signals buying exhaustion. Price could consolidate or reverse sharply, especially if buyers fail to defend this level.
---
2. Resistance Zone Saturation
The resistance zone (highlighted in red) has already been tested multiple times.
Disruption: This could either lead to a breakout or—more likely in a weak volume context—a liquidity trap and reversal, as market makers use the expectation of a breakout to trap long positions.
---
3. Potential Double Top Pattern
Look closely at the two peaks around the resistance zone. They resemble a developing double top.
Disruption: If price fails to break out convincingly and starts dropping, this double top may trigger a fall back to $105,000 or even lower.
---
4. Bearish Divergence Possibility
While not shown on this chart, in cases like this, it's common for momentum indicators (like RSI or MACD) to show bearish divergence.
Disruption: Even if price hits slightly higher highs, a divergence could signal that momentum is fading and a deeper pullback is incoming.
---
5. High Sell Volume on the Spike (May 19)
That long wick candle with high volume around May 19 suggests strong seller interest above $107K.
Disruption: Buyers could struggle again in this zone, especially if that volume spike was from whales distributing.
Forexpower

Market next move 1. Overconfidence in Breakout:
The chart predicts a clean breakout, but the resistance zone has already been tested multiple times, indicating seller strength.
Disruption: Price might fake out above resistance and sharply reverse (bull trap).
2. Volume Confirmation Missing:
The breakout prediction lacks strong volume spike confirmation.
Disruption: Without increasing volume, any breakout attempt might fail and lead to a false breakout.
3. Short-Term RSI/Overbought Conditions (Not visible here):
If RSI or similar indicators are approaching overbought, it increases the chances of a pullback rather than immediate continuation.
4. Liquidity Sweep Risk:
Price may intentionally break the resistance to trigger stop-loss orders before reversing sharply (common in crypto markets).
Disruption: A stop-hunt move followed by a retrace to $105,000 or lower.
5. Macroeconomic or External Event Sensitivity:
If an external catalyst (e.g., Fed speech, ETF news, regulatory action) emerges, it can easily invalidate the bullish scenario.

Market next move 1. False Breakout from Resistance Zone
Disruption: The price is testing a resistance zone (marked red box). If it fails to hold above this zone and falls back below 32.70, it could signal a bull trap.
Impact: This could invalidate the projected upward move and initiate a drop toward 32.20 or lower.
---
2. Divergence Warning
Disruption: If momentum indicators (RSI, MACD—not visible here) show bearish divergence while price climbs, it’s a warning sign of weakening buying pressure.
Impact: This often precedes a pullback or reversal despite bullish chart patterns.
---
3. Lack of Volume Confirmation
Disruption: The breakout is not supported by a significant increase in volume (volume bar is relatively modest).
Impact: Weak volume may mean the breakout lacks conviction and can reverse quickly.
---
4. Overhead Liquidity Zone Near 34.04
Disruption: The projected target of 34.0448 could act as a liquidity magnet, but also a selling zone where large orders may get filled.
Impact: Price might spike into that area and reverse sharply.
---
5. Macroeconomic Uncertainty
Disruption: Unexpected Fed comments, inflation data, or geopolitical shifts can cause Silver to defy technical expectations.
Impact: Could result in abrupt volatility that wipes out structured setups.

Market next move
1. Red Zone Retest Failure
Disruption: If the price breaks back below the red highlighted zone (around 3,265–3,270), it may indicate a false breakout.
Impact: This would invalidate the bullish continuation and could lead to a sharp decline toward 3,240 or even lower.
---
2. Low Volume on the Breakout
Disruption: The breakout rally appears strong, but if upcoming candles show declining volume, it may suggest weak momentum.
Impact: A drop in volume could precede a reversal or sideways consolidation instead of the projected move to 3,306.
---
3. Double Top or Bearish Rejection at 3,306
Disruption: The price could reach the 3,306 target and form a double top, leading to bearish rejection.
Impact: This could be the start of a downtrend or extended consolidation.
---
4. Overbought Conditions
Disruption: If momentum indicators like RSI or Stochastic (not shown on chart) are in overbought territory, this could suggest a pullback is likely before continuation.
Impact: May lead to a deeper retracement than expected.
---
5. Macroeconomic or News Catalyst
Disruption: Unforeseen macro events (e.g., interest rate announcements, geopolitical tension) could cause sudden shifts against the technical outlook.
Impact: Could override technical structure entirely.

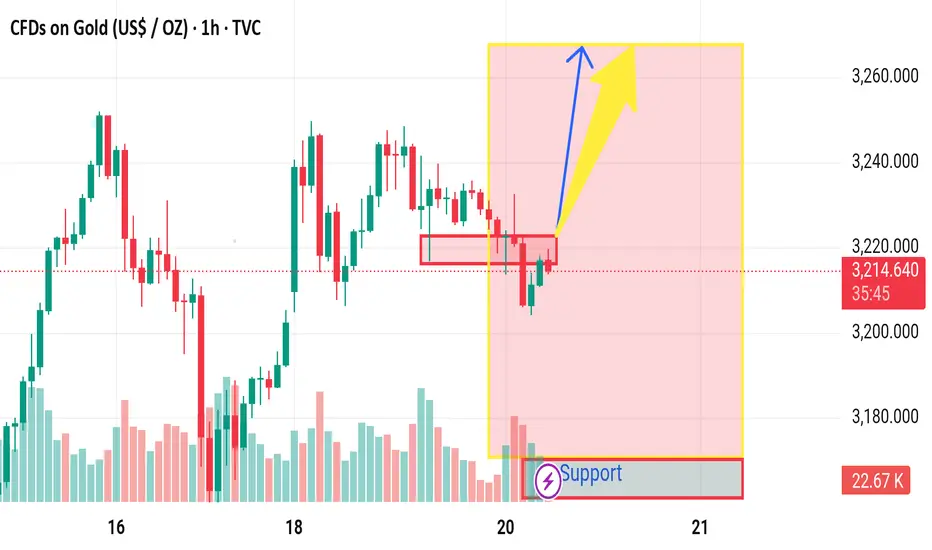
Market next move 1. Over-Reliance on Support Zone
The analysis heavily leans on the assumption that the support zone (marked with the purple "Support" label) will hold.
However, this support has already been tested multiple times, which weakens its strength.
A break below this zone could trigger significant stop-loss hunting, leading to a bearish breakdown instead of a bullish reversal.
2. Volume Analysis Suggests Weak Momentum
The recent bounce lacks strong volume. This suggests that buying interest is not convincing at this level.
Without volume confirmation, any bullish move is less likely to sustain.
3. Lower Highs Pattern
Despite small rallies, the chart is forming lower highs, which is typically a bearish signal.
This hints at seller dominance, and the yellow bullish projection might be overly optimistic.
4. Resistance Overhead
The price is approaching a short-term resistance zone (red box), which has rejected the price previously.
Without a clear breakout above that, the bullish case is speculative.
5. Fundamental Factors Unaccounted
The chart doesn’t account for macro factors like U.S. dollar strength, interest rates, or geopolitical influences that often affect gold.
If the dollar strengthens, gold may drop, breaking the support.
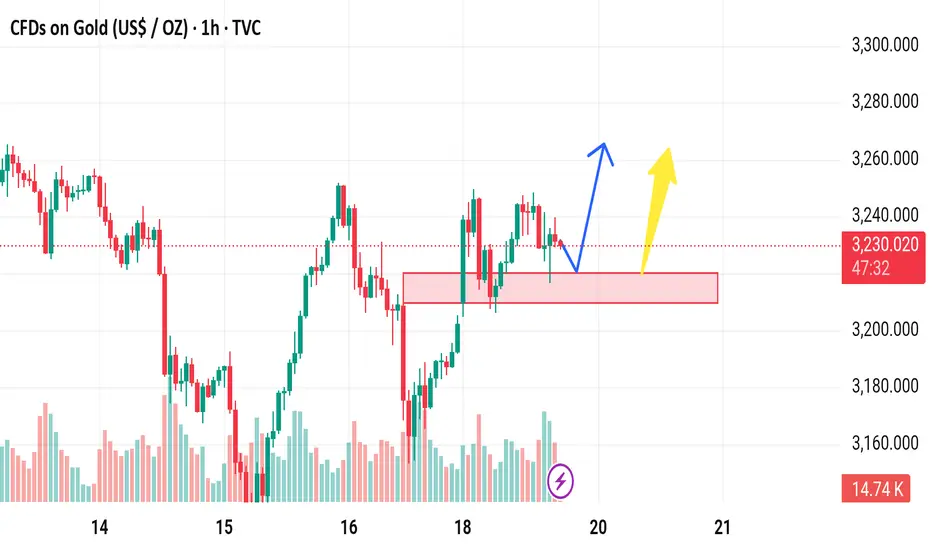
Market next moveBearish Disruption Scenario:
1. False Breakout Trap:
If the price breaks above the rectangle but lacks strong volume or fails to sustain above resistance, it may turn into a bull trap.
This could lead to a sharp reversal and shake out long positions.
2. Volume Divergence:
Notice that volume is decreasing during the consolidation. Without a spike in volume on breakout, the move could lack conviction.
This weakens the bullish case.
3. Resistance Zone Overhead:
There's likely a resistance zone just above the rectangle (around 3,240–3,260), where selling pressure could resume.
Price may test the zone, reject it, and fall back inside or below the range.
4. Double Top Risk:
The price action on the 18th and current range-top could form a double-top pattern if rejected.
A drop below the lower bound of the rectangle (~3,210) would confirm the pattern, suggesting bearish continuation.
5. Macro or Fundamental Risks:
Any unexpected strong U.S. dollar movement or interest rate expectations could push gold lower, invalidating bullish technical setups.

Market next move
1. Bearish Rejection from Resistance
Disruption: The price has struggled to break above the 3,240–3,250 area multiple times. This could indicate strong resistance.
Implication: If the price fails again, we may see a rejection and a move down towards the 3,180–3,160 support range instead of a bullish breakout.
---
2. Volume Analysis Caution
Disruption: The volume during recent upward moves is not significantly higher than the downswings.
Implication: Weak buying volume might not support a strong breakout, suggesting a fakeout could occur.
---
3. False Breakout Possibility
Disruption: A possible fake breakout above the red box might lure in buyers before a reversal.
Implication: Watch for a "bull trap" where the price briefly breaks up and then reverses sharply downward.
---
4. Macro Events Ahead
Disruption: The timing (around May 20) could align with macroeconomic news (e.g., Fed minutes, CPI, etc.).
Implication: News can trigger volatility and negate technical expectations.
---
5. RSI or Momentum Indicators?
Disruption: Without checking RSI or other momentum indicators, the analysis might lack confirmation.
Implication: Overbought/oversold conditions could shift the bias unexpectedly.

Next move Disruption Analysis: Bearish Risk Perspective
1. Sideways Consolidation (Red Box Zone):
The price is consolidating in a tight range between roughly 32.20 and 32.40, showing indecision and potential for either a breakout or breakdown.
Repeated rejections near the top of this box can signal exhaustion of buying pressure.
2. Volume Observation:
There’s no strong volume surge indicating accumulation; volume appears mixed and doesn't strongly support a bullish breakout.
A potential fakeout risk exists if the price spikes above the consolidation range only to fall back in (bull trap).
3. Potential Bearish Breakdown:
If the price breaks below the red box, especially under 32.20, it could trigger stop-losses and initiate a short-term bearish trend.
First downside target: 32.00 psychological level, followed by 31.80 support from previous lows.
4. Wick Rejection on Top:
The recent candles inside the box show long upper wicks — signs of selling pressure at higher levels.

Next move Bearish Disruption Perspective:
1. Failure to Break Above Supply
Price is struggling near 32.40–32.50, a visible resistance area from prior swing highs.
Repeated rejections here can signal seller strength or profit-taking.
2. Exhaustion Patterns
The price is forming sideways consolidation (highlighted in red).
A failure to break upward from this box and a false breakout wick would suggest buyer exhaustion.
3. Bearish Breakdown Scenario
If price breaks below the red box support (~32.30), this range could flip into resistance.
A clean drop below 32.30 would likely open the path toward 32.00 and potentially 31.80.
4. Volume Spike on Red Candle
Volume on red bars (10.64K) suggests aggressive selling pressure creeping in.
Watch for confirmation if next candles close red with high volume.

Next target Bearish Disruption Points
1. False Breakout Risk
Price is hovering near the recent highs but hasn’t made a convincing higher high.
A fakeout above 32.42 followed by a sharp rejection could trap buyers and trigger a sell-off.
2. Exhaustion at Resistance
The current level (~32.33–32.42) was a previous distribution zone on May 13–14.
Low volume follow-through may indicate weak buying interest, increasing the odds of a reversal.
3. Bearish Divergence (Potential)
If RSI or MACD shows lower highs while price pushes up, that’s a bearish divergence—a common reversal signal.
(You’d need to check indicators for confirmation.)
4. Support Flip to Resistance
If the price breaks back below the red box (~32.25), the same zone could act as resistance, turning into a supply zone.
5. Volume Clue
Volume appears lower during the recent bullish attempts, hinting at buyer fatigue.
Higher volume on red candles would validate a bearish shift.

Silver next move Weak Demand Zone Bounce
The current price action shows only a minor bounce from the demand zone.
A lack of strong bullish candles or volume confirmation may indicate weak buying interest.
2. Lower High Structure
The chart appears to be forming lower highs, suggesting a possible downtrend continuation.
If price fails to break the recent swing high near 32.70, bears might gain control.
3. Volume Concern
Recent bullish candles have decreasing volume, while the latest red candle has higher volume—this could signal a bearish divergence.
4. Bearish Trap Possibility
The current consolidation above support might turn into a distribution zone, leading to a fake breakout downward.

Gold next move The price is currently at a prior resistance level (~3,229) which may act as a supply zone. The market has already failed to break above this level multiple times in the past, indicating strong selling pressure.
2. Volume Divergence
If we analyze the volume at the most recent peaks, there's a possibility of lower buying volume despite higher prices—this could signal weakening bullish momentum.
3. False Breakout Risk
The chart suggests a possible pullback to the red demand zone before continuation. However, if the price fakes out into the zone and fails to hold above ~3,210, this could trigger a deeper selloff.
4. Double Top Formation Risk
There appears to be a potential double top pattern around 3,250–3,260, which may signal a bearish reversal if neckline support (~3,210) is broken.
5. Macroeconomic Influence
Unless supported by strong fundamentals (e.g., dovish Fed signals, rising inflation), any bullish breakout might lack fuel to sustain a rally beyond resistance.
Disruptive Bearish Scenario:
Price breaks below the red demand zone (~3,210).
Retests it as resistance.
Targets the next major support zone near 3,175–3,180.
EURUSD Bearish Structure Forming Amid Dollar UncertaintyEURUSD appears to be carving out a series of lower highs, showing potential signs of distribution. With price compressing inside a symmetrical triangle following multiple failed breakout attempts, the stage could be set for a bearish breakdown. This comes as U.S. inflation and Fed policy hold the spotlight and the euro faces political and structural crosswinds.
📉 Technical Breakdown (4H Chart)
Triple Top / Head & Shoulders Variant Forming:
Price action has traced a rounded top sequence, forming a triple top or complex head and shoulders structure.
Each rally attempt has been followed by steeper declines and faster recoveries—typical of a topping process.
Triangle Contraction Zone:
Current price is consolidating into a symmetrical triangle, which is often a continuation pattern.
Bearish breakout is expected if support around 1.1330–1.1320 fails.
Key Bearish Targets:
TP1: 1.1090 – former resistance turned support.
TP2: 1.0890 – April breakout base and key structure low.
Trade Setup (as per chart):
Sell Entry Zone: Break and retest of 1.1320–1.1300.
Stop Loss: Above 1.1527 (supply zone high).
Targets:
TP1: 1.1090
TP2: 1.0890
🌐 Macro Context
USD Side:
Fed is holding rates steady amid rising inflation fears triggered by tariffs
Tariff shocks are already pushing prices up, while growth slows—a tough environment for the Fed.
Dollar could strengthen if market sentiment shifts risk-off.
Euro Side:
Former EU Commissioner Gentiloni calls for unified borrowing to boost the euro’s global role, as U.S. stability is questioned
Political uncertainty around German leadership transitions may also weigh on the euro short term.
✅ Conclusion
EURUSD is trading at the apex of a tightening triangle pattern following a distribution structure. With a clean break of 1.1320 support, expect increased volatility and bearish momentum toward 1.1090 and 1.0890.

USDCAD – Reversal Setup Ahead of FOMC DecisionUSD/CAD has bounced off strong support near 1.3770, forming a clean bullish structure into a pivotal week dominated by the FOMC meeting. Price action shows higher lows and a tightening range, signaling a potential breakout. With the Fed expected to hold rates but maintain a hawkish tone, the USD may regain strength — especially against the CAD, which remains under pressure from trade risks and weak oil prices.
🔹 Technical Setup:
Structure: Rejection at 1.3770 support with ascending trendline developing.
Pattern: Bullish flag breakout (visible on 2H chart).
Momentum: Recovery candles suggest buyers regaining control ahead of resistance.
Key Levels:
Support: 1.3770 – 1.3780
Resistance:
TP1: 1.3852 (Fib 61.8%)
TP2: 1.3891 (swing high zone)
TP3: 1.3950 (major breakout target)
Invalidation: Below 1.3760
🧠 Fundamental View:
USD Outlook:
The Fed is widely expected to hold interest rates steady on May 7, but officials are pushing back against early rate-cut expectations. Chair Powell is likely to emphasize inflation risks and signal no imminent easing. This stance supports USD resilience, especially if the Fed reiterates “higher for longer” messaging.
CAD Outlook:
The Canadian economy continues to face export challenges from U.S. tariffs, weakening business sentiment. Meanwhile, softening oil prices reduce support for the CAD. With the Bank of Canada having already delivered several rate cuts, it remains more dovish than the Fed — creating a widening policy divergence.
💡 Trade Idea:
Bias: Bullish above 1.3780
Entry Zone: 1.3800–1.3820
Target 1: 1.3852
Target 2: 1.3891
Target 3: 1.3950
Stop Loss: Below 1.3760
📌 Watch for volatility during and after the FOMC statement and Powell’s press conference. A hawkish surprise could fuel a sharp move toward 1.39+.

GOLD UPWARD SOONThis chart showcases a liquidity grab followed by a potential bullish reaction in Gold (XAU/USD).
Key Technical Highlights:
- Resistance Zone: Clearly defined around the 3,370 level, where price has consistently faced rejection.
- Support Level: Identified near the 3,220–3,230 zone, which was recently swept to collect liquidity.
- Liquidity Zone: Price dipped below support to trigger stop-losses before rebounding, signaling a possible bullish reversal.
Projected Move:
The chart suggests a bounce toward the next target at 3251.225, aligning with a previously broken support now turned resistance.
If momentum sustains, further upside could be explored toward the mid-supply zone.
Summary: The recent liquidity sweep hints at a potential short-term bullish move, with a target retracement to 3251.225. Traders should monitor price reaction at that level for confirmation or rejection.

TARGET SUCCESSFUL
This chart displays a successful bullish breakout on Bitcoin (BTC/USD) from the previous consolidation range.
Key Levels & Zones:
-Resistance Zone: Around 95,576, which was clearly broken with strong bullish momentum.
Support Level: Maintained around 93,592, where price previously bounced from.
Fair Value Gap (FVG): Efficiently filled, providing the base for the bullish rally.
Target Achieved: The price decisively hit and exceeded the projected target of 95.576, confirming the bullish setup.
Market Sentiment: Strong bullish bias with volume surge, indicating continued interest above resistance.
Conclusion: The breakout and target completion validate the strength of the structure and buyer control in this range. Further bullish continuation could be expected if momentum sustains.

BTCUSD (BTC/USD) highlights a consolidation phase within clearly defined support and resistance zones, with price currently poised for a potential move upward.
Key Technical Zones:
- Resistance Area: Around 95,576, which has been tested multiple times with rejections—indicating strong supply.
- Support Level: Strong buying interest observed near the 92,500 region, keeping the structure intact.
- FVG (Fair Value Gap): The price filled the FVG recently, suggesting equilibrium and potential for another leg up.
Current Outlook:
- Price is holding above the FVG and is attempting a bullish rebound.
- If price maintains support above the recent lows, we may see continuation toward the target at 95,576.
Next Target: 95,576
Watch For: Rejection at resistance or volume confirmation to validate a breakout.

GOLD UPWARD COMING SOON Gold (XAU/USD) shows the price currently trading within a defined range between the support level at 3272.581 and the resistance zone around 3367.926.
Technical Highlights:
- Support Level: Strong demand seen around 3272.581 where price has previously rebounded.
- Resistance Zone: 3367.926 marks a key supply area that has held several past tests.
- Current Structure: A bullish corrective move appears underway with the potential to test the target area at 3338.838, aligning with a minor resistance zone.
- Price Behavior: Recent rejection from the support zone indicates bullish pressure; if momentum holds, price is likely to challenge the next resistance.
Next Target: 3338.838
Outlook: If gold sustains above the mid-range support, bullish continuation toward 3338.838 is favored. However, price must break minor resistance cleanly for further upside confirmation.
Would you like a social media caption or short signal text for this as well?

USOILOil shows price moving between a clear support level and a strong order block resistance above. Currently, price is trading inside a resistance zone around 63.25.
The chart indicates a potential bullish move, targeting the 64.22 level, where the order block resides.
Key Technical Points:
- Support Level: Strong demand area near 62.00.
- FVG (Fair Value Gap): Gap filled below current price.
- Resistance Zone: Price facing resistance around 63.00-63.50.
- Order Block: Major target area near 64.22.
Target Projection: $64.22
Outlook:
If buyers sustain momentum above the resistance zone, we could see a rally toward the 64.22 target at the order block. Confirmation of a breakout and retest would strengthen the bullish bias.
Would you like me to also create a quick short caption for social media posting?

BTCUSD Bitcoin (BTC/USD) highlights price movement between a key resistance zone and a strong support level. Price has currently pushed back into the Fair Value Gap (FVG) zone near 94,600, setting up a potential short-term reversal.
The expectation shown on the chart is for price to react from the FVG/resistance area and move lower toward the support level, targeting around 92,947.
Key Technical Points:
- Resistance Zone: 95,500 -95,750
- FVG Area: Current price is testing imbalance at 94,600.
- Support Level: Strong demand zone near92,750.
- Target Projection: $92,947
Outlook: Price is likely to face selling pressure around the FVG and resistance zone, leading to a possible drop towards the support zone. Traders should monitor bearish confirmations for potential short opportunities.
Would you also like me to create a short caption for posting this chart on social media?

GOLD Gold (XAU/USD) shows price action ranging between a strong support level and a visible order block above. Price recently tested the support zone near 3,260.000, showing potential signs of a bullish reaction.
The chart highlights a possible upward move toward the Fair Value Gap (FVG) zone, targeting around 3325.626.
Key Technical Points:
- Support Level: Price bounced from the 3,260.000 zone.
- FVG Area: Gap available for price to fill up toward 3325.626.
- Order Block: Major resistance near the 3,440.000 region.
- Structure: A potential bullish short-term recovery setup.
Target Projection: $3325.626
If buyers maintain control around the current support, we could see a move into the FVG before facing major resistance at the order block above. Watch closely for bullish confirmations or possible rejections around the FVG area.

euraud buy signalIn this signal, it has exited a descending channel and entered an ascending channel, and it has formed a powerful candle on the daily time frame, and the risk to reward is 1 to 5, and according to our analysis, it will see the target.

SILVER Silver (XAG/USD) shows a potential bearish correction setup forming after rejection from the upper resistance channel. Price is currently consolidating below the resistance zone after testing the upper band and is projected to move downward toward the order block and potentially the support trendline.
The chart suggests a bearish move targeting the next level at 32.8153, which aligns with a confluence of support between the lower trendline and the order block zone.
Key Technical Elements:
- Resistance Zone: Price failed to break above33.70, confirming a strong supply area.
- Bearish Projection: Lower highs and consolidation hint at possible downside movement.
- Next Target: 32.8153
- Order Block Trendline Support: Could serve as a bounce zone or continuation support.
Outlook: If price breaks below the intermediate channel support, it may trigger further downside toward32.81. However, watch for reactions around the order block for potential bullish reversals. This setup is ideal for short-term traders monitoring key levels for entry and risk control.
