Gold wants to above 2350 read the caption Gold is ending the week in unchartered territory as traders look to hedge against a further escalation of tensions between Israel and Iran. Earlier this week at least eleven Iranian people were killed, including a senior commander of the Islamic Revolutionary Guard Corps, with Iran now vowing to take retaliatory action against Israel. According to newspaper reports, Israel is preparing itself for imminent missile attacks from Iran,
Forextrader

Gbpusd continue bearish trend go with sell read the caption No change in GBP/USD’s outlook and intraday bias stays neutral. On the downside, decisive break of 1.2517/31 support zone will suggest that rise from 1.2032has completed at 1.2891already, and turn near term outlook bearish. On the upside, however, firm break of 1.2672 will suggest that fall from 1.2892 has completed at 1.2537 Intraday bias will be turned back to the upside for 1.2802 resistance next.

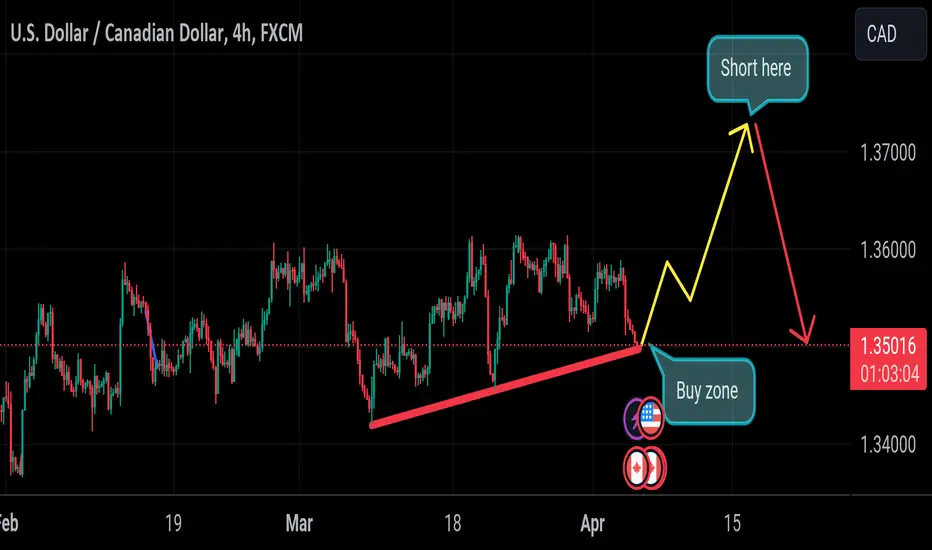
Usdcad aside trendline bulls and bears read the caption Logan, saying that it’s much too soon to think about cutting interest rates in the wake of the upside risk to inflation. This, in turn, forced investors to further scale back their expectations for the total number of rate cuts in 2024 to two as against three projected by the Fed, pushing the US Treasury bond yields higher across the board. The rate-sensitive two-year US government bond and the benchmark 10-year Treasury note surged to a four-month peak, which, in turn, lends support to the US Dollar (USD). Moreover, the disappointing Canadian jobs report, along with a fall in Crude Oil prices, is seen undermining the commodity-linked Loonie and acting as a tailwind for the USD/CAD pair.
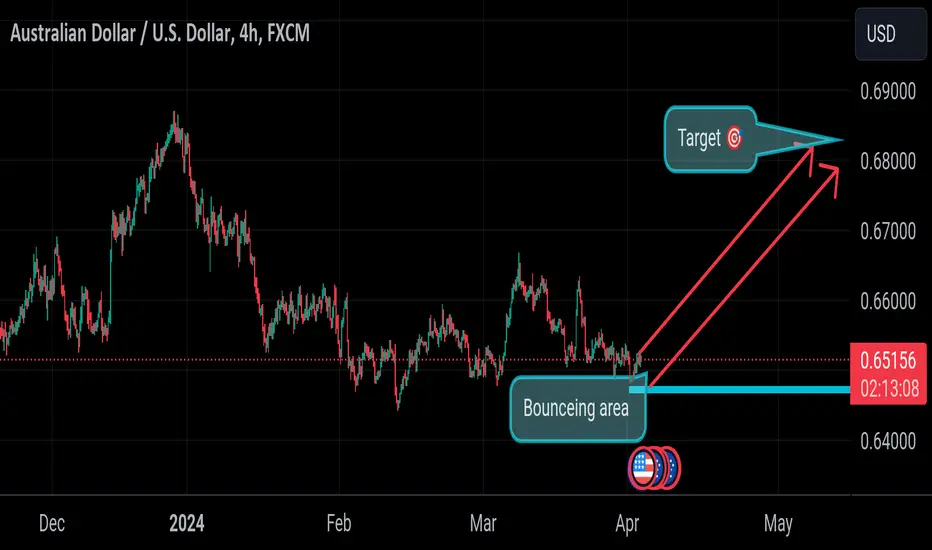
Audusd will cross all time high read the caption The US dollar eased slightly after the US published strong jobs numbers on Friday. According to the Bureau of Labor Statistics (BLS), the economy created over 303k jobs in March, higher than last month’s 270k. The figure was higher than the median estimate of 212k.
Additional data revealed that the unemployment rate retreated from 3.9% to 3.8% while the participation rate rose from 62.5% to 62.7%. The two figures were higher than the median estimate of 3.9% and 62.5% Wages also continued growing at a faster pace than EXPECTED

GBP/USD Short and NZD/USD ShortGBP/USD Short
Minimum entry requirements:
• If 3 touch 1H continuation or 2 touch 1H continuation with 3 touch structural approach, 15 min risk entry within it.
NZD/USD Short
Minimum entry requirements:
• If 3 touch 1H continuation or 2 touch 1H continuation with 3 touch structural approach, 15 min risk entry within it.

Eurusd confirm analys of buy read the caption The European Central Bank (ECB) in Frankfurt, Germany, is the reserve bank for the Eurozone. The ECB sets interest rates and manages monetary policy. The ECB’s primary mandate is to maintain price stability, which means either controlling inflation or stimulating growth. Its primary tool is the raising or lowering of interest rates. Relatively high interest rates – or the expectation of higher rates – will usually benefit the Euro and vice versa. The ECB Governing Council makes monetary policy decisions at meetings held eight times a year. Decisions are made by heads of the Eurozone national banks and six permanent members
Nzdusd head to go higher read the caption On the 1 hour chart, we can see more closely the recent price action with the pair now trading at the support zone. If the price were to break above the black counter-trendline, we can expect the buyers to gain even more conviction and increase the bullish momentum, although a lot will depend on the US NFP report today as strong figures across the board will likely trigger

EUR/USD Long, EUR/CAD Long and USD/CHF ShortEUR/USD Long
Minimum entry requirements:
• If 3 touch 1H continuation or 2 touch 1H continuation with 3 touch structural approach, 15 min risk entry within it.
EUR/CAD Long
Minimum entry requirements:
• If 3 touch 1H continuation or 2 touch 1H continuation with 3 touch structural approach, 15 min risk entry within it.
USD/CHF Short
Minimum entry requirements:
• If 3 touch 1H continuation or 2 touch 1H continuation with 3 touch structural approach, 15 min risk entry within it.

Usdjpy dropping level read the caption In the bigger picture, correction from 151.81 (2023) high could have completed at 140.25 already. Rise from 127.20 (2023 low), as part of the long term up trend, is probably ready to resume. Decisive break of 151.93 resistance (2022 high) will confirm this bullish case. Next medium term target will be 61.8% projection of 127.22 to 151.88 from 140.22 at 155.21 This will remain the favored case as long as 146.46 support holds, in case of another pullback.

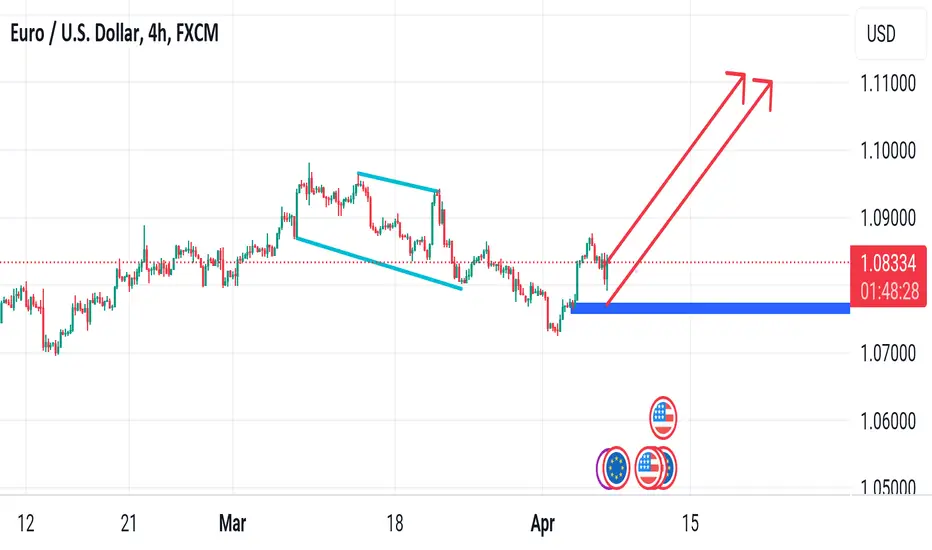
EURUSD cross the sell trendline bulls back read the caption The Hamburg Commercial Bank (HCOB) and S&P Global released the final estimates of the March Services and Composite Producing Managers Index (PMI), which indicated a subtle yet pivotal shift in the services sector's trajectory. The HCOB Germany Services PMI edged up to 50.1 from 48.3 in February. The survey's findings of sustained job creation and strategic hiring, coupled with a more optimistic business outlook

Gbpusd bullish trend a good opportunity read the caption The US will also publish the final estimate of Q4 GDP data. In its last report, the statistics agency said that the economy expanded by 3.2% in Q4 after growing to 4.9% in the previous month. The US will publish this week’s initial and continuing jobless claims.
The most important data of the week will be the US personal consumption expenditure (PCE) report set for Friday. This figure will come on the same day when most markets

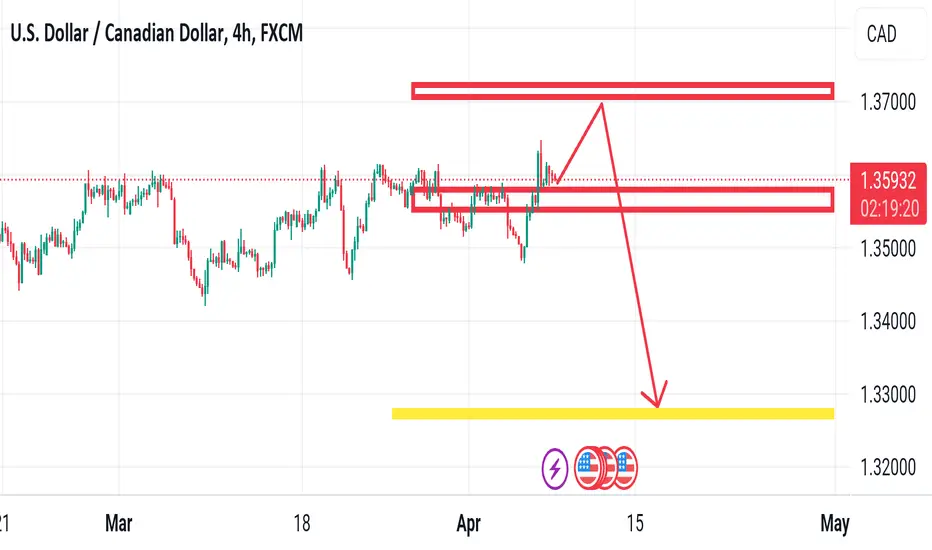
Usdcad bullish and bearish read the caption The 14-period Relative Strength Index (RSI) oscillates inside the 40.00-60.00 range, indicating indecisiveness among investors.
A downside move below February 22 low at 1.3442 would expose the asset to February 9 low at 1.3423. A breakdown below the latter would extend downside towards January 15 low at 1.3383
On the flip side, the Loonie asset would observe a fresh upside if it breaks above December 7 high at 1.3622. This will drive the asset towards May 26 high at 1.3655, followed
Gbpusd confirm buy read the caption This opens the door to this currency pair to advance well above $1.2667, with room to rise as high as $1.2720 without reaching another resistance level.
So, I see the best potential opportunity today as a long trade above $1.2667, but a bullish signal is needed to trigger entry – ideally this would be two consecutive higher closes above $1.2662 during today’s London session.

GBP/USD Short and GBP/CAD ShortGBP/USD Short
Minimum entry requirements:
• Tap into area of value.
• 1H impulse down below area of interest.
• If 2 touch 5 min continuation, reduced risk entry on the break of it.
• If 2 touch 15 min continuation, 5 min risk entry within it, or reduced risk entry on the break of it.
GBP/CAD Short
Minimum entry requirements:
• If 3 touch 1H continuation or 2 touch 1H continuation with 3 touch structural approach, 15 min risk entry within it.

Bitcoin show us new peak level read the caption The price of Bitcoin whipped to a new high in the US morning session and in the process extended above the high price for the week at $71572. The high for the day was reached at $71754, but buyers
The subsequent run to the downside, next took the price below the lows for the day and in the process entered into a swing area between $68249 and $68864. THe low price reached $68556

USDCHF trendline fully bullish read the caption The USDCHF earlier today reached up to the highest level of the year at 0.90949. However the last three or four hours have seen a rotation to the downside after the weaker than expected ISM nonmanufacturing data. Fed's Powell also, the market at that sending yields lower and the US dollar lower in the process.
That good news sent the price of the USDCHF down below is 100 hour moving average at 0.9043 and down to the 200 hour moving average 0.90296 Hundreds road lower, the prior highs from last week at 0.9061 and 0.90636

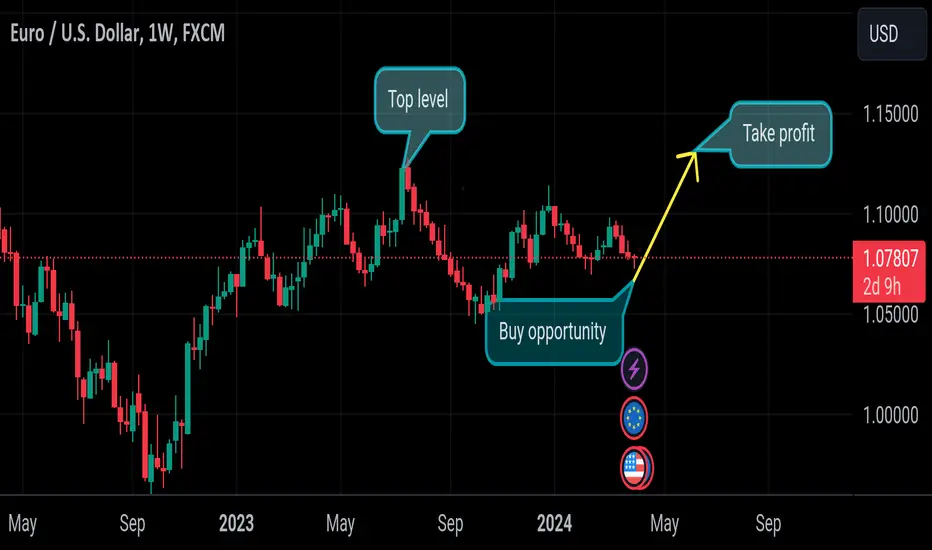
Eurusd will go to top level read the caption Inflation in the eurozone continues to decline. March CPI eased to 2.4% y/y, down from 2.6% in February and below of the market estimate of 2.6%. This matched November’s 28-month low and was driven by the continued slowdown in food inflation. Monthly, CPI rose to 0.8%, up from 0.6% but below the forecast of 0.9%.
Core CPI also declined, with a reading of 2.9% y/y. This was below the February gain of 3.1% and just shy of the market estimate of 3.0%. Core CPI, which is considered more significant than the headline release, has declined for an eighth straight month and dropped to its lowest level since February 2022. Germany’s inflation report
GOLD BIG TERMS TRADE BUY SHORT LITTLE BIT READ THE CAPTION Meanwhile, any corrective decline now seems to find support near the $2,275 area ahead of the $2,255 level. This is followed by the weekly low, around the $2,227 region, which, if broken, might prompt some technical selling and drag the Gold price back toward the $2,220 psychological mark. The latter should act as a key pivotal point, and a convincing break below might shift the near-term bias in favor of bearish trader

Audusd uptrend expected pattern clear bullish read the caption As a result, they expect that the Fed will start cutting rates in the second half of the year. Mester wants to see more data while Mary Daly estimated that the bank would deliver three cuts as it hinted in the last meeting.
Michele Bowman and James Williams spoke on Tuesday but did not provide any details about rate cuts. Jerome Powell, the Fed Chair
Usdjpy wanna go up they show very bullish read the caption Range trading continues in USD/JPY and intraday bias remains neutral. On the downside, break of 150.25 support should confirm short term topping, and turn bias back to the downside for 55 D EMA (now at 149.35). Nevertheless, sustained break of 151.92 key resistance will confirm long term up trend resumption. Next near term target will be 61.8% projection of 140.25 to 150.77 from 146.27 at 153.02

Bitcoin big fall now ready to big jump to hit 75k read the captiTherefore, the BTC/USD pair will likely react to the upcoming statements by several Federal Reserve officials like Mary Daly, Loretta Mester, and John Williams. Jerome Powell, the Fed Chair, will have a speech on Wednesday.
The other important BTC/USD news will be the upcoming Bitcoin halving event, which will happen later this month. Halving will reduce the block rewards

Gbpusd another buy setup read the caption This was not a great call as the price rose strongly over the course of the day. However, the price quickly fell back to where it had been and has been consolidating below $1.2653 ever since.
The picture looks bearish if the price remains below $1.2656 and looks likely to fall further – the price action look

Gold get ready to above 2300 read the caption Gold price trades higher, near all-time highs around $2,260. The precious metal strengthened after breaking above the prior lifetime high of $2,223 on March 21. More upside in the Gold price is possible as it is trading in an unchartered territory. All short-to-long term Exponential Moving Averages (EMAs) are sloping higher, suggesting strong near-term demand.
The 14-period Relative Strength Index (RSI) hovers near 78.00, indicating a strong upside momentum. However
