USD/CHF Falls to Two-Week LowUSD/CHF Falls to Two-Week Low
This morning, the USD/CHF exchange rate slipped below 0.7944 for the first time since 1 October, as demand for safe-haven assets intensified — a trend also reflected in yesterday’s record gold price above $4,200.
The traditionally stable Swiss franc is strengthening amid rising global uncertainty and risk aversion:
→ In Japan, the upcoming prime ministerial election could significantly impact monetary policy, while France faces ongoing political turmoil.
→ In the United States, the government shutdown continues, and traders are closely watching developments around a potential trade deal with China, possibly to be discussed during an expected meeting between the two countries’ leaders.
Technical Analysis of the USD/CHF Chart
As noted in our 25 September analysis, the Swiss franc has appreciated through 2025 amid elevated geopolitical and macroeconomic risks, forming a downward channel on the USD/CHF chart (shown in red).
We also highlighted:
→ the possibility of a trend reversal around the 0.7900 support area;
→ potential breakout targets (shown in blue).
Since then, the bulls have indeed made progress, driving the price up towards point A and:
→ breaking above the red channel’s upper boundary;
→ overcoming the psychological 0.8000 level.
However, that progress has not been sustained. Among the bearish signals:
→ the median line of the blue channel acted as resistance;
→ the brief move above local highs around 0.8072 resembles a bearish liquidity grab.
From the bullish perspective, USD/CHF has now retreated into a zone that could act as support:
→ the upper boundary of the red channel;
→ the lower boundary of the blue channel.
The arrow highlights signs of a bullish engulfing pattern, suggesting that buyers may be using these support zones to stage a rebound within the blue channel. The 0.8000 psychological mark could serve as the first key test of their resolve.
This article represents the opinion of the Companies operating under the FXOpen brand only. It is not to be construed as an offer, solicitation, or recommendation with respect to products and services provided by the Companies operating under the FXOpen brand, nor is it to be considered financial advice.
Forextrading
Gold Pulls Back From All-Time High – Correction Looks Limited📊 Market Overview
Gold slightly corrected from its all-time high near $4,239, showing early signs of a short-term pullback, but the overall trend remains bullish.
Despite the correction, fundamental sentiment still supports Gold:
💬 US–China trade tensions and geopolitical risks continue to fuel demand for safe-haven assets.
💵 The US Dollar remains under pressure amid expectations of a Federal Reserve rate cut later this year.
⚖️ Ongoing concerns about a possible US government shutdown further enhance Gold’s attractiveness.
These factors suggest that the current dip is likely a healthy correction within a strong uptrend, not a reversal.
🧠 Technical Structure (MMFLOW Wave View)
Gold has likely completed a minor Wave (V) on the M30 chart, forming a new ATH Zone near 4,239.
Currently, price is unfolding a corrective A–B–C pattern, expected to find support at key liquidity zones before resuming the uptrend.
Our model highlights two potential BUY setups and a short-term SELL scalp opportunity for today’s trading session.
🔑 Key Levels to Watch
🔵 BUY Setup 1
Zone: 4,184 – 4,182
SL: 4,178
TP: 4,188 – 4,192 – 4,196 – 4,200 – 4,210 – 4,220 – ???
🟢 BUY Setup 2 (Deeper Retrace)
Zone: 4,148 – 4,146
SL: 4,140
TP: 4,152 – 4,156 – 4,160 – 4,170 – 4,180 – 4,190 – 4,200
🔴 SELL SCALP Opportunity
Zone: 4,230 – 4,234
SL: 4,238
TP: 4,220 – 4,215 – 4,210 – 4,200 – 4,190 – ???
⚙️ MMFLOW Trading View
📈 Price is currently respecting Wave (A) of the correction.
We expect a possible (B) retracement toward 4,220 – 4,230, followed by (C) decline completing near 4,147 – 4,150 (Fibo 0.618 / CP Buy Zone).
From there, Smart Money may re-enter long positions targeting a fresh liquidity sweep toward the 4,285 SELL ZONE.
In short:
The uptrend remains intact, only a short-term correction is unfolding.
Patience is key — best opportunities will likely appear around 4,150 – 4,180 range.
The structure aligns perfectly with both technical confluence (Elliott + Liquidity Zones) and macro sentiment.
If the market holds above 4,140, Gold could aim for new highs toward 4,285 – 4,300 in the next few sessions.
However, traders should:
✅ Always use Stop Loss — volatility is high near record highs.
✅ Avoid overtrading in narrow pullback zones.
✅ Focus on reaction at key liquidity levels before entering.
⚡ Summary
Gold remains technically bullish with limited downside correction.
Watch for price reaction around 4,184 and 4,147 — both zones represent strong liquidity areas where Smart Money may look to buy again.
After completing this correction, a new impulsive leg up toward 4,285+ could unfold, potentially marking the next all-time high.

AUDCAD: Bearish Move From Resistance Confirmed 🇦🇺 🇨🇦
There is a high chance that AUDCAD will retrace from the underlined resistance.
A bearish violation of a support line of a rising channel after its test
provides a strong intraday bearish confirmation.
Goal - 0.9123
❤️Please, support my work with like, thank you!❤️
I am part of Trade Nation's Influencer program and receive a monthly fee for using their TradingView charts in my analysis.

How Spot Forex Trading Works1. Understanding the Concept of Spot Forex Trading
Spot Forex trading, also known as spot FX, refers to the direct exchange of one currency for another at the current market rate, known as the spot price. Unlike futures or options contracts, where settlement happens at a later date, a spot transaction is settled “on the spot”, typically within two business days (T+2) for most currency pairs.
The Forex market is the largest and most liquid financial market globally, with a daily trading volume exceeding $7 trillion. It operates 24 hours a day, five days a week, allowing traders from around the world to speculate on currency price movements. Spot Forex trading forms the foundation of global currency trading, providing real-time exchange of currencies between participants such as banks, corporations, investors, and retail traders.
2. The Participants in the Spot Forex Market
The Spot Forex market involves multiple participants who trade for different purposes:
Central Banks – Manage currency reserves, stabilize exchange rates, and implement monetary policies.
Commercial Banks and Financial Institutions – Facilitate interbank trading and currency exchange for clients.
Multinational Corporations – Exchange currencies for international trade and investment purposes.
Hedge Funds and Investment Firms – Engage in speculative trading to profit from currency fluctuations.
Retail Traders – Individuals using online platforms to speculate on short-term price movements.
Each participant contributes to market liquidity, influencing price dynamics based on supply and demand.
3. Currency Pairs and Price Quotation
In the Forex market, currencies are always traded in pairs, such as EUR/USD, GBP/JPY, or USD/INR. The first currency is the base currency, and the second is the quote currency.
The price quote represents how much of the quote currency is required to buy one unit of the base currency. For example, if EUR/USD = 1.0900, it means 1 Euro = 1.09 US Dollars.
Each pair has:
Bid Price – The price at which the market (or broker) is willing to buy the base currency.
Ask Price – The price at which the market (or broker) is willing to sell the base currency.
The difference between these two is called the spread, which represents the broker’s commission or transaction cost.
4. How Spot Forex Transactions Are Executed
Spot Forex trading operates through over-the-counter (OTC) networks rather than centralized exchanges. When a trader places a buy or sell order on a trading platform, the broker executes it through liquidity providers or the interbank market.
For instance, if a trader buys EUR/USD, they are effectively buying Euros while selling US Dollars at the current spot rate. The transaction is typically settled within T+2 days, though in practice, many brokers offer rolling spot contracts, which are automatically extended daily for speculative purposes.
Execution types include:
Market Orders – Executed instantly at the best available price.
Limit Orders – Executed when the market reaches a specified price level.
Stop Orders – Triggered when the price crosses a set threshold to limit losses or capture breakouts.
5. The Role of Leverage in Spot Forex Trading
Leverage is one of the most distinctive features of the Forex market. It allows traders to control large positions with relatively small amounts of capital. For example, a 1:100 leverage ratio means that a trader can control a $100,000 position with only $1,000 of margin.
While leverage amplifies potential profits, it also magnifies losses, making risk management essential. Professional traders typically use moderate leverage and implement stop-loss mechanisms to protect against adverse movements.
Regulators in different regions impose varying limits on leverage — for example, 1:30 in the EU (ESMA regulations) and 1:50 in the US.
6. Determinants of Spot Forex Prices
Spot exchange rates are influenced by numerous macroeconomic, geopolitical, and technical factors:
Interest Rate Differentials: Higher interest rates attract foreign capital, boosting demand for the currency.
Economic Indicators: GDP growth, employment data, inflation, and trade balances affect currency valuation.
Central Bank Policies: Monetary tightening or loosening directly impacts currency strength.
Political Stability: Political risk or uncertainty weakens investor confidence, depreciating the currency.
Market Sentiment and Speculation: Traders’ collective expectations drive short-term fluctuations.
Global Events: Wars, pandemics, and natural disasters can trigger volatility across the Forex market.
In short, Forex prices are a reflection of global economic health and investor confidence.
7. Profit and Loss Calculation in Spot Forex
The profit or loss in a spot Forex trade is determined by the change in exchange rate between the time the position is opened and closed.
For example, if a trader buys EUR/USD at 1.0900 and sells it later at 1.1000, they gain 100 pips (the fourth decimal point represents a pip in most pairs).
Profit calculation formula:
Profit (USD)
=
Pip Movement
×
Lot Size
×
Pip Value
Profit (USD)=Pip Movement×Lot Size×Pip Value
For a standard lot (100,000 units), one pip in EUR/USD equals $10. Thus, a 100-pip move equals $1,000 profit.
Conversely, if the trade moves against the trader, losses occur at the same rate. Hence, understanding position sizing and pip value is crucial for effective risk management.
8. Settlement and Delivery in Spot Forex
While traditional spot Forex transactions involve physical delivery of currencies within two business days, retail traders rarely take delivery. Instead, brokers provide contract-based trading that simulates real exchange but is settled through cash differences in profit or loss.
For institutional participants, however, settlement occurs through systems like CLS (Continuous Linked Settlement), which eliminates settlement risk by synchronizing payments between major financial institutions globally.
Thus, while the spot market technically implies immediate delivery, in practice, most participants engage for speculative or hedging purposes without currency delivery.
9. Risk Management in Spot Forex Trading
Spot Forex trading carries inherent risks due to volatility, leverage, and unpredictable global events. To mitigate these, traders adopt structured risk management strategies:
Stop-Loss and Take-Profit Orders – Automatically close positions at predefined levels to control losses or lock in profits.
Position Sizing – Limiting trade size relative to account equity, often 1–2% per trade.
Diversification – Avoiding concentration in one currency pair or region.
Economic Calendar Monitoring – Tracking major events like central bank meetings and GDP releases to anticipate volatility.
Technical and Fundamental Analysis – Combining chart patterns with macroeconomic insights to make informed decisions.
Effective risk management ensures long-term sustainability and consistent returns in the Forex market.
10. Advantages and Challenges of Spot Forex Trading
Advantages:
High Liquidity: Tight spreads and minimal slippage due to massive global participation.
24/5 Availability: Traders can operate across global time zones without limitation.
Low Entry Barriers: Retail traders can start with small capital using micro or mini accounts.
Leverage Access: Enables higher market exposure with limited funds.
No Centralized Exchange: Global accessibility through OTC trading networks.
Challenges:
High Volatility: Sharp fluctuations can trigger significant losses.
Leverage Risk: Over-leveraging can wipe out accounts quickly.
Information Overload: Constant economic updates require active monitoring.
Broker Reliability: Unregulated brokers pose counterparty risks.
Psychological Pressure: Emotional control is essential for success in a fast-paced market.
Despite these challenges, spot Forex trading remains one of the most popular avenues for both institutional and retail investors due to its liquidity, flexibility, and potential for profit.
Conclusion
Spot Forex trading represents the core of the global currency market, enabling participants to exchange currencies directly at real-time rates. Its structure—comprising major participants, dynamic pricing, leverage, and decentralized execution—creates immense opportunities and risks alike. Understanding how the market functions, the economic forces behind exchange rates, and effective risk management techniques is crucial for success. Whether used for speculation, hedging, or international trade, the Spot Forex market remains a cornerstone of global finance, reflecting the heartbeat of the world’s economic and political landscape.
EURUSD Outlook: Dollar Dominance Extends as Euro WeakensThe EURUSD pair remains under downward pressure as investors continue favoring the U.S. dollar amid global economic uncertainty. The Federal Reserve’s consistent stance on keeping interest rates higher for longer has reinforced the dollar’s appeal, while weak Eurozone data — including sluggish industrial output and fading consumer confidence — has weighed on the euro’s recovery.
Market sentiment shows limited bullish strength for the euro, with traders closely monitoring upcoming U.S. inflation and ECB policy comments. Unless the Eurozone presents stronger economic momentum or fiscal support, the euro is likely to remain on the defensive.
Overall, the fundamental tone supports continued USD dominance. The broader market structure reflects bearish tendencies for EURUSD in the medium term, with investors preferring dollar exposure as a safer bet amid global uncertainty.

Reversal About to Happen for EUR/USD? Or is it a trap? - Oct 14So the EUR/USD has come up today, breaking almost a week long selling trend. the question for Today is... is the move for real? or is it a trap?
In this video, not only do we tackle this important question, but we also review what happened with yesterday´s selling trend and we dive into the potential setups we can expect over the coming day both for bulls and also for bears
Thanks so much

Demand Zone Formed, Bulls Eyeing BSLHello Traders 👋
Hope your week is off to a strong and focused start!
Today on EURUSD, we’ve seen price shifting its fractal bias multiple times—clear signs of market indecision. But here’s where it gets interesting: after the latest shift in fractal structure, price delivered a strong bullish push, forming a fresh demand zone.
With this momentum, I’m anticipating a continued move to the upside, targeting the Break of Structure Liquidity (BSL). That said, LTF (Lower Time Frame) confirmation is essential before entering any buy trades—stay patient and let price validate your setup.
Stay sharp and trade with discipline

AUDUSD: Bearish Move From Resistance Confirmed?! 🇦🇺🇺🇸
There is a high chance that AUDUSD will retrace
from the underlined blue resistance.
As a confirmation, I spotted a descending triangle pattern
on an hourly time frame.
I expect a bearish move to 0.6488 level.
❤️Please, support my work with like, thank you!❤️
I am part of Trade Nation's Influencer program and receive a monthly fee for using their TradingView charts in my analysis.

USDJPY: Morning Gap Trading 🇺🇸🇯🇵
Monday's morning traditionally starts with trading gap openings.
One of the gaps that I spotted is on USDJPY pair.
With a high probability, it is going to get filled today.
Target level - 151.3
❤️Please, support my work with like, thank you!❤️
I am part of Trade Nation's Influencer program and receive a monthly fee for using their TradingView charts in my analysis.

XAUUSDXAUUSD If the price cannot break above 4077, it is expected that in the short term the price will likely go down. Consider selling in the red zone.
🔥Trading futures, forex, CFDs and stocks carries a risk of loss.
Please consider carefully whether such trading is suitable for you.
>>GooD Luck 😊
❤️ Like and subscribe to never miss a new idea!

EURUSDHello Traders! 👋
What are your thoughts on EURUSD?
In the EUR/USD chart, we can see that price failed to close above the marked resistance zone and was rejected from that area.
Additionally, the pair has broken its ascending trendline and closed below it, signaling a potential shift in short-term momentum.
We expect a pullback toward the broken trendline or resistance zone, followed by a downward continuation toward the next support level.
If a weekly candle closes above the resistance zone, this bearish scenario will be invalidated.
Don’t forget to like and share your thoughts in the comments! ❤️

EURUSD: Support & Resistance Analysis for Next Week 🇪🇺🇺🇸
Here is my latest structure analysis and important
supports and resistances for EURUSD for next week.
Consider these structures for pullback/breakout trading.
❤️Please, support my work with like, thank you!❤️
I am part of Trade Nation's Influencer program and receive a monthly fee for using their TradingView charts in my analysis.

EUR/USD – Bearish Continuation in MotionEUR/USD continues to display a bearish market structure, reflecting persistent downside pressure as the euro struggles to maintain stability against the U.S. dollar. Recent price action shows a period of consolidation followed by a liquidity grab near short-term highs, indicating that buyers are losing strength and the market is positioning for a potential continuation of the decline. The broader market tone suggests that sentiment remains cautious, with traders favoring the dollar due to its resilience amid global uncertainty and steady U.S. economic performance. The pair’s inability to establish higher highs further confirms weakness in bullish momentum. This behavior often signals distribution, where institutional players offload long positions before another leg downward. Short-term movements could still present small corrective bounces as the market seeks liquidity, but overall conditions favor sellers. Unless a strong shift in macro sentiment occurs, EUR/USD is likely to maintain its downward trajectory, targeting lower levels as the bearish momentum unfolds and traders continue aligning with dollar strength.

XAUUSDXAUUSD overall trend remains strong uptrend and the price made a new high of 4056$. After that, the price corrected downwards. We expect a correction. Currently, if the price cannot break through the 4023$-4031$ zone, there is a possibility of a downward trend. Consider selling in the red zone (high risk trade).
🔥Trading futures, forex, CFDs and stocks carries a risk of loss.
Please consider carefully whether such trading is suitable for you.
>>GooD Luck 😊
❤️ Like and subscribe to never miss a new idea!

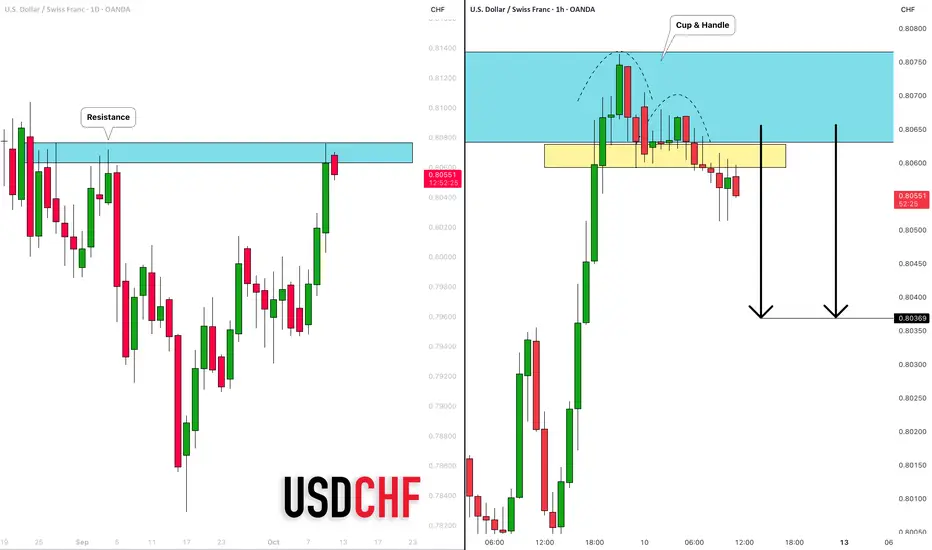
USDCHF: Overbought Market & Pullback 🇺🇸🇨🇭
There is a high chance that USDCHF will retrace from the underlined
horizontal daily resistance.
A cup & handle pattern formation on that on an hourly time frame
suggest an overbought state of the pair.
Goal - 0.8037
❤️Please, support my work with like, thank you!❤️
I am part of Trade Nation's Influencer program and receive a monthly fee for using their TradingView charts in my analysis.
Gold (XAU/USD) – Bullish Continuation Setup Toward $4,000 Target
You said:
Uploaded image
analyze this chart and give suitable chart
ChatGPT said:
This chart shows the Gold Spot (XAU/USD) on the 1-hour timeframe, and it outlines a potential long (buy) setup. Let’s break down the analysis:
🧠 Chart Overview
Instrument: Gold Spot / U.S. Dollar (XAU/USD)
Timeframe: 1 Hour
Broker Feed: OANDA
Current Price: ≈ 3,960.21 USD
Date: October 7, 2025
📊 Technical Analysis
1. Trend Context
The recent candles show higher lows forming after a small pullback — a sign of bullish continuation.
Price structure indicates accumulation around the 3,950–3,960 range before a potential push upward.
2. Support and Resistance
Support Zone: ~3,940.93
→ This acts as the base for the bullish setup; a break below may invalidate the trade.
Target / Resistance Zone: ~4,001.07
→ This is the projected take-profit zone, near a psychological level (4,000), which often acts as a strong barrier.
3. Trade Setup Summary
Entry Zone: Around 3,960.60 (current price)
Stop Loss: Around 3,935.12
Take Profit: Around 4,000.84
This gives an approximate Risk-to-Reward Ratio (RRR) of 1:2, which is a favorable setup for swing or intraday traders.
📈 Outlook
Bias: Bullish (buy)
Confirmation Needed: A break and close above 3,965 on the 1H chart with increasing volume.
Invalidation: A 1-hour candle close below 3,940 would suggest bearish momentum or a false breakout.

Gold settles near record high on support of China's purchases Gold prices are hovering around $3,960 an ounce, near a record high reached earlier in the session, supported by economic uncertainty and China's central bank's growing gold holdings for the eleventh consecutive month in September. Gold is up 51% so far this year , supported by resilient safe-haven demand, and expectations of #Federal_Reserve_easing.
Technically, the metal fell slightly in a downward corrective movement at the beginning of today's trading, after holding above the $3940 levels, so we expect the downward correction to stop around the $3940 per ounce level, and then rebound again and target the resistance levels of $3996.75 per ounce

AUDUSDHello Traders! 👋
What are your thoughts on AUDUSD?
The pair has broken its ascending trendline and completed a pullback to the broken level.
It is now trading below a key resistance zone, showing signs of bearish pressure.
After some consolidation in this area, the price is expected to continue declining toward the highlighted support levels.
As long as the pair remains below the resistance zone, the downside bias will stay in play.
Don’t forget to like and share your thoughts in the comments! ❤️

USD/JPY Analysis: Yen Weakens to Two-Month LowUSD/JPY Analysis: Yen Weakens to Two-Month Low
As the USD/JPY chart shows, the Japanese yen has weakened sharply at the start of this week. Trading opened with a bullish gap, and today the exchange rate has risen to ¥150.65 per US dollar.
The yen’s decline followed the recent election, during which Japan’s ruling Liberal Democratic Party elected Sanae Takaichi as its new leader, paving the way for her to become the next prime minister. According to Reuters, Takaichi supports the late former Prime Minister Shinzo Abe’s “Abenomics” strategy, which focuses on stimulating the economy through aggressive spending and ultra-loose monetary policy.
Technical Analysis of the USD/JPY Chart
The political factor has led to a sequence of higher highs and higher lows (A→B→C→D) on the chart – and it is already evident that the next peak, E, will form above the previous one. This suggests that the USD/JPY market has entered an upward trend following a flat phase that was particularly pronounced in August.
At the same time:
→ The A low has a long lower shadow, and the D low shows signs of a double-bottom pattern, indicating strong demand.
→ The ¥149 level may serve as support going forward, marking the edge of the gap.
→ The price has broken above the key psychological level of ¥150 per dollar.
→ These reversal points justify constructing an ascending channel (shown in blue).
The chart highlights the dominance of demand, as the price remains:
→ In the upper half of the channel;
→ Above a curved support line – trajectories of this kind often appear after strong market impulses.
Given the above, it is reasonable to assume that:
→ The USD/JPY rate may continue its upward movement;
→ However, bullish momentum is weakening, as suggested by the potential bearish divergence on the RSI indicator.
It is worth noting that in February and March, the price reversed several times near ¥151 per dollar, which may act as significant resistance – adding weight to the possibility of a corrective move in USD/JPY, perhaps towards the median of the current channel.
This article represents the opinion of the Companies operating under the FXOpen brand only. It is not to be construed as an offer, solicitation, or recommendation with respect to products and services provided by the Companies operating under the FXOpen brand, nor is it to be considered financial advice.

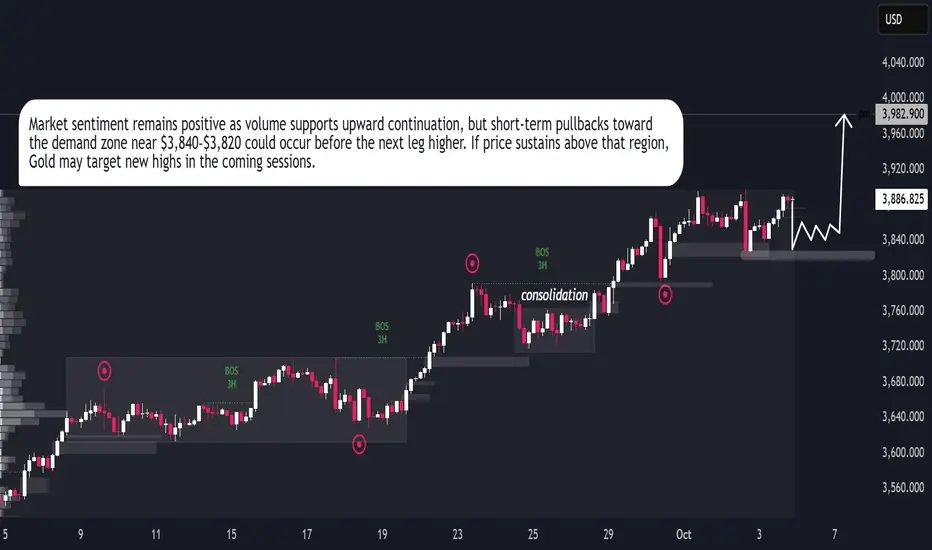
GOLD → Structural Rebalance Before Next Bullish LegGOLD → Structural Rebalance Before Next Bullish Leg
Gold remains in a strong bullish structure, showing consistent higher highs and steady momentum after each correction. The market has been consolidating above the $3,800 zone, where buyers continue to absorb liquidity and prevent deeper declines. This zone acts as a solid base for potential upward expansion. Current market behavior indicates controlled accumulation, suggesting that institutional buyers are maintaining dominance. If gold holds above $3,840–$3,820, the next bullish leg may target the $3,960–$4,000 region. A short-term retracement could occur, but overall momentum favors continuation. The price structure and volume behavior both support further upside, reflecting strong buyer control and stable sentiment in the market.
EURUSD LONGI have maintained a buy position for quite a while, based on last week's performance, the bullish momentum is slowing down. Going forward the bulls will depend on a new catalyst. The fed officials have maintained a divergent rate cut rhetoric while at the same the US government is experiencing a shutdown. These has made traders to remain cautious. This week we have quite a number of events lined up, including FOMC and NFP. Any negative news towards the dollar while at the same time ECB's Christine Largade maintaining a stability will mean a retest for the pair towards the years high around 1.19200. Better news for the dollar will mean on lower time frames reversal and higher time frames deeper retracements.

EURUSD: Support & Resistance Analysis for Next Week 🇪🇺🇺🇸
Here is my latest structure analysis and important supports & resistances
for EURUSD for next week.
Consider these structures for pullback/breakout trading.
❤️Please, support my work with like, thank you!❤️
I am part of Trade Nation's Influencer program and receive a monthly fee for using their TradingView charts in my analysis.

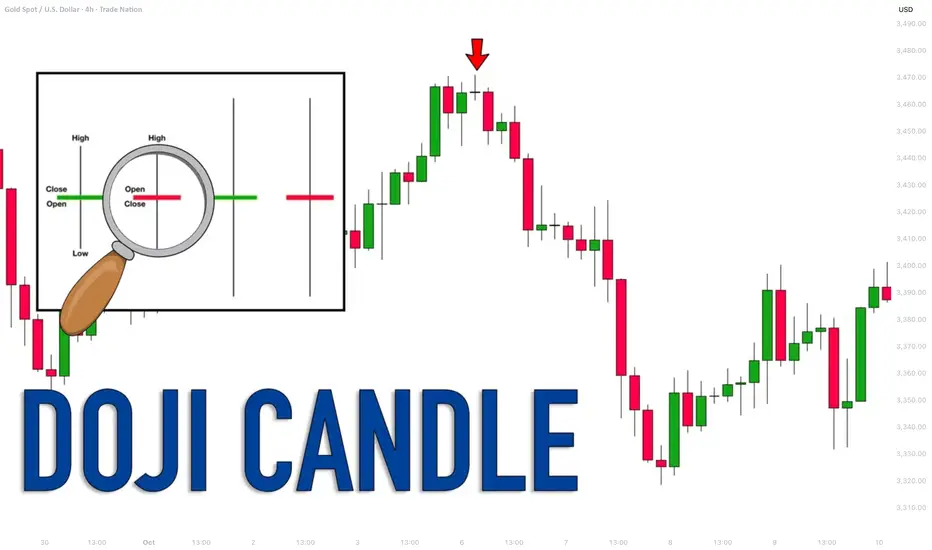
Learn Profitable Doji Candle Trading Strategy (GOLD, FOREX)
In the today's post, I will share my Doji Candle trading strategy.
This strategy combines the elements of multiple time frame analysis, price action and key levels.
Step 1
Analyze key levels on a daily time frame.
Identify vertical and horizontal supports and resistances.
Here are the key structures that I spotted on AUDUSD.
Step 2
Look for a formation Doji Candle on a key structure.
This rule is crucially important: we will trade only the Doji candles that are formed on key levels.
From key supports , we will look for buying , and we will look for shorting from key resistances .
Look at this Doji Candle that was formed on a key daily support on AUDUSD.
Step 3
Look for a horizontal range on a 4h/1h time frames.
Doji Candle signifies indecision . Quite often, you will notice the horizontal ranges on lower time frames when this candlestick is formed.
Here is a horizontal range that was formed on a 4H time frame on AUDUSD after a formation of Doji.
Step 4
Look for a breakout of the range.
To sell from a key resistance, we will need a bearish breakout of the support of the range. That will be our bearish confirmation.
To buy from a key support, we will need a bullish breakout of the resistance of the range. It will be our bullish signal.
Here is a confirmed breakout of the resistance of the range with a 4H candle close above. That is our bullish confirmation on AUDUSD.
Step 5
Buy aggressively or on a retest.
After you spotted a confirmed breakout of the range, open a trading position aggressively or on a retest.
Personally, I prefer trading on a retest.
If you sell, a stop loss should be above the high of the range and your target should be the closest key daily support.
If you buy, your stop loss should be below the low of the range and a take profit will be on the closest daily resistance.
On AUDUSD, a long position was opened on a retest. Stop loss is lying below the lows. Take profit is the closest resistance.
Here is how this great strategy works!
Always patiently wait for a confirmation! That is your key to successful trading Doji Candle.
❤️Please, support my work with like, thank you!❤️
I am part of Trade Nation's Influencer program and receive a monthly fee for using their TradingView charts in my analysis.