Trading Discipline – The Defining Edge of Professional TradersIn Forex and Gold trading, there is one truth every trader eventually learns: discipline matters more than strategy.
A simple system executed with discipline can deliver consistent results.
A brilliant system without discipline will collapse under pressure.
🧠 Stop-loss & Take-profit – Your Survival Tools
Stop-loss: Not surrender, but capital protection.
Take-profit: Not prediction, but securing gains before greed erodes them.
👉 Rule of pros: Set SL/TP before entering a trade – and never move them out of fear or hope.
📊 Case Study: Discipline vs Emotion
Undisciplined trader: Moves stop-loss further when price goes against him. Small loss turns into account damage.
Disciplined trader: Keeps stop-loss intact, loses 1%. Over 20 trades, system edge delivers net profits.
➡️ Lose small to win big.
🚀 Habits That Build Discipline
Have a trading plan: Entry rules – SL – TP – risk – time frame.
Use alerts: Reduce stress, stop staring at charts.
Walk away after entry: Don’t let emotions interfere.
Fixed risk: 1–2% per trade, no exceptions.
Keep a trading journal: Track not only results but emotions behind decisions.
🏆 Why Discipline Separates Pros from Amateurs
Amateurs let the market control them.
Professionals control themselves.
In the long run, success doesn’t come from one “perfect trade” but from hundreds of disciplined executions.
📈 Conclusion
The market is uncontrollable. But you can control yourself.
Discipline is the edge that:
Protects your capital.
Stabilizes your mindset.
Turns strategy into consistent results.
👉 Have you ever broken your stop-loss or take-profit rules? What did it teach you about discipline?
Forextrading
Euro Dollar Analysis – Corrective Rebound or Bearish Setup?EUR/USD continues to operate within a controlled market cycle. The sharp decline earlier this week highlighted strong bearish momentum, followed by a corrective rebound that served as a liquidity reset. This rebound is less about trend reversal and more about rebalancing order flow after an aggressive selloff.
The current structure suggests the market may still seek liquidity higher before resuming its dominant direction. A sweep toward the 1.1780 area could attract late buyers, providing larger players the opportunity to offload positions before driving price lower again.
Overall, EUR/USD remains tilted toward the downside. The corrective phase is acting as a preparation stage, positioning the pair for another potential bearish leg once redistribution completes.

Gold price analysis October 3In the last two New York sessions, gold has been under constant selling pressure as it approaches the peak. The market is showing a strong tug-of-war between buyers and sellers, reflecting the indecision after the previous long-term rally.
Currently, the 3862 area is considered an important resistance level. If the London session does not create enough momentum to break through this area, the bearish scenario will be prioritized with the target falling back to the support levels of 3825 and deeper at 3805.
SELL setup: Watch for price rejection signals around the resistance of 3862.
🎯 Target: 3825 – 3805.
BUY setup: Only consider when the H1 price closes a stable candle above 3862, opening up the opportunity to continue the uptrend.

GBPCHFGBPCHF price is in the key support zone. If the price fails to break above 1.06703 a rebound is likely. Consider buying in the red zone.
🔥Trading futures, forex, CFDs and stocks carries a risk of loss.
Please consider carefully whether such trading is suitable for you.
>>GooD Luck 😊
❤️ Like and subscribe to never miss a new idea!

Gold Market Outlook – Bullish Trend Building MomentumGold continues to follow a structured bullish cycle, where each consolidation phase has been followed by a breakout and expansion. Market behavior shows liquidity being collected in sideway ranges, then released to fuel upward momentum.
At the current stage, price is trading around $3,870, showing signs of a potential short-term pullback to gather liquidity from the mid-zone. Once this corrective move stabilizes, the chart suggests a renewed bullish impulse with a projected upside target toward the $3,965 level.
This pattern highlights that the market remains in a controlled bullish phase, where temporary retracements are acting as setups for continuation rather than reversal. The underlying flow still favors higher levels as long as buyers maintain activity after corrections.

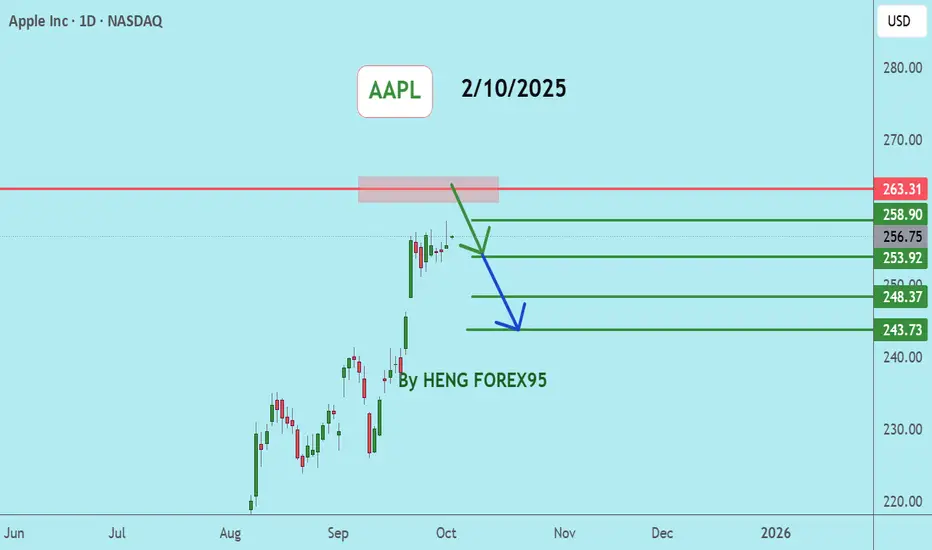
AAPLApple (AAPL) price is in a strong uptrend, there is a chance that the price will test the $261-$265 level. In this zone, if the price cannot break above $265, the short-term price is likely to go down, consider selling the red zone.
🔥Trading futures, forex, CFDs and stocks carries a risk of loss.
Please consider carefully whether such trading is suitable for you.
>>GooD Luck 😊
❤️ Like and subscribe to never miss a new idea!
GBPCHF: Pullback Trade From Support 🇬🇧🇨🇭
There is a high chance that GBPCHF will bounce from
a key intraday support cluster.
A bullish imbalance candle that was formed after its test
suggest a strong buying pressure.
Goal - 1.0763
❤️Please, support my work with like, thank you!❤️
I am part of Trade Nation's Influencer program and receive a monthly fee for using their TradingView charts in my analysis.

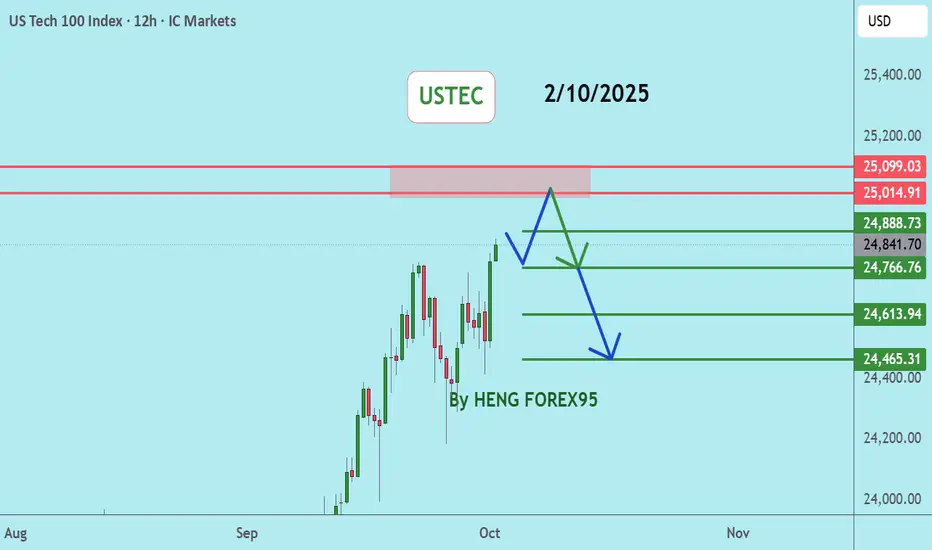
USTEC, NASDAQNasdaq price is still in a strong uptrend, there is a chance to test the 25014-25124 level. If the price cannot break through the 25124 level, it is expected that the price will have a chance to go down. Consider selling in the red zone.
🔥Trading futures, forex, CFDs and stocks carries a risk of loss.
Please consider carefully whether such trading is suitable for you.
>>GooD Luck 😊
❤️ Like and subscribe to never miss a new idea!
GBPNZD: Confirmed BoS 🇬🇧🇳🇿
GBPNZD successfully broke and closed above a resistance cluster
based on the year's high.
It opens a potential for more growth and bullish continuation.
Next resistance - 2.33
❤️Please, support my work with like, thank you!❤️
I am part of Trade Nation's Influencer program and receive a monthly fee for using their TradingView charts in my analysis.

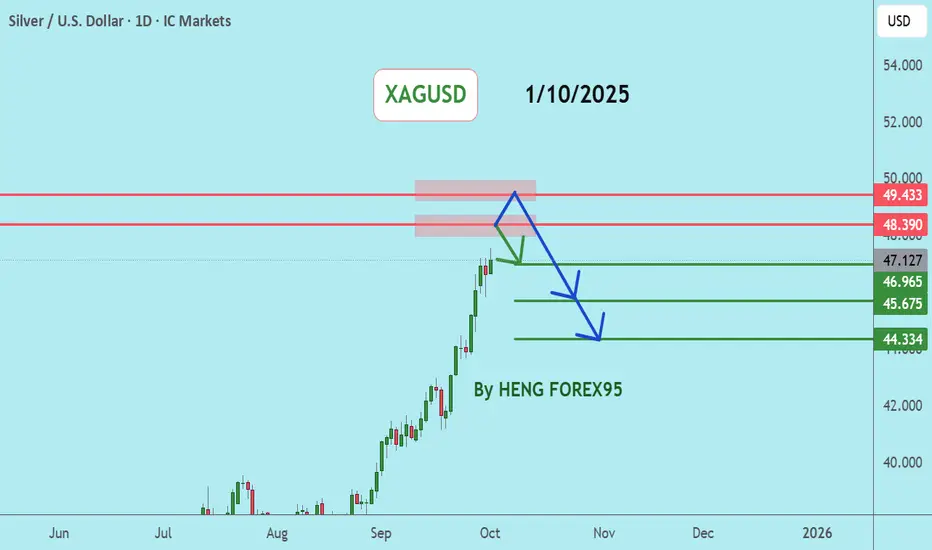
XAGUSDSilver price is in a strong uptrend. The price has a chance to test the 48.39-49.75 level, which is a key resistance zone. If the price cannot break through the 49.75 level, it is expected that the price has a chance to go down in the short term. Consider selling in the red zone.
🔥Trading futures, forex, CFDs and stocks carries a risk of loss.
Please consider carefully whether such trading is suitable for you.
>>GooD Luck 😊
❤️ Like and subscribe to never miss a new idea!
XAUUSDGold price today has risen to a new high of $3871 and the price has failed to break above $3871 and selling has occurred. We expect that in the short term, there is a possibility of price correction. Consider selling in the red zone.
**Very Risky Trade
🔥Trading futures, forex, CFDs and stocks carries a risk of loss.
Please consider carefully whether such trading is suitable for you.
>>GooD Luck 😊
❤️ Like and subscribe to never miss a new idea!

AUD/USD Technical Roadmap – From TMA Pullback to Resistance Zone🦘 The Aussie Heist: AUD/USD Wealth Strategy Map (Swing/Day Trade) 💰
Asset: AUD/USD ("The Aussie")
Vibe: Bullish breakout with a cheeky thief-style layered entry! 😎
📜 The Master Plan: Stealing Profits with Style!
We’re cooking up a bullish setup on AUD/USD with a thief-inspired swing/day trading strategy. Here’s the blueprint to nab those pips:
✅ Bullish Confirmation: A solid bullish pan formation, backed by a Triangular Moving Average (TMA) pullback.
✅ Heikin Ashi Power: Bullish Heikin Ashi candles screaming, "The trend is your friend!"
✅ Double Bottom Setup: A classic double bottom on the TMA pullback, giving us that extra confidence to strike.
🕵️♂️ Entry: The Thief’s Layered Heist
This is where the Thief Strategy shines! We’re using a layered entry approach with multiple buy limit orders to sneak into the market like a pro. No single entry for us — we’re stacking the odds!
Buy Limit Layers:
🎯 0.65700
🎯 0.65800
🎯 0.65900
🎯 0.66000
Pro Tip: Feel free to add more layers based on your risk appetite — the more, the merrier! Just keep it calculated, you sly fox. 🦊
Note: You can enter at any price level within this range if you spot a good opportunity. The thief’s motto? Strike when the market’s distracted!
🛑 Stop Loss: The Thief’s Escape Plan
Set your Stop Loss at 0.65500 to keep the cops at bay.
Disclaimer: Dear Ladies & Gentlemen (Thief OGs), this SL is my suggestion, but it’s your heist! Adjust it to your risk tolerance and protect your loot. 💼
🎯 Target: Dodging the Police Barricade
Our profit target is set at 0.66800, where we expect a strong resistance zone (aka the police barricade), potential overbought conditions, and a sneaky trap for the bulls.Escape Plan: Lock in profits before the market turns on you!
Note: Thief OGs, this TP is my take, but you’re the boss of your trades. Take profits at your comfort level and run with the cash! 💸
🔍 Related Pairs to Watch
Keep an eye on these correlated forex pairs (all in USD) to spot potential confirmations or divergences:
OANDA:NZDUSD : The Kiwi often moves in tandem with the Aussie due to their economic ties. Watch for similar bullish setups!
OANDA:USDCAD : An inverse correlation — if USD weakens, AUD/USD and NZD/USD may rally.
FX:EURUSD : A broader USD strength/weakness gauge. If EUR/USD is climbing, it could support our bullish AUD/USD bias.
Key Point: AUD/USD is sensitive to commodity prices (gold, iron ore) and risk sentiment. A strong bullish move in NZD/USD or a weakening USD across pairs could supercharge this setup!
⚡ Why This Setup Rocks
TMA Pullback: A reliable signal for trend continuation.
Heikin Ashi Confirmation: Filters out noise and keeps us on the bullish path.
Layered Entries: Spreads risk and maximizes entry opportunities.
Double Bottom: A high-probability reversal pattern for extra confidence.
This setup is designed for swing/day traders who love a calculated, fun approach to the markets. Let’s steal those pips together! 😜
✨ “If you find value in my analysis, a 👍 and 🚀 boost is much appreciated — it helps me share more setups with the community!”
Disclaimer: This is a thief-style trading strategy crafted for fun and educational purposes. Trade at your own risk, and always use proper risk management. No financial advice here — just a playful take on market opportunities!
#TradingView #AUDUSD #ForexTrading #SwingTrading #DayTrading #ThiefStrategy #TechnicalAnalysis

EURUSDHello Traders! 👋
What are your thoughts on EURUSD?
EUR/USD continues to trade within a rising channel structure. Following the recent pullback, price reacted positively upon reaching the identified support zone.
At this stage, we expect some short-term consolidation around current levels. However, as long as the support zone and the channel bottom hold, the bullish scenario remains intact, and the pair may resume its upward move towards higher resistance levels.
The bullish outlook remains valid as long as price stays above the key support area.
Don’t forget to like and share your thoughts in the comments! ❤️

XAUUSDHello Traders! 👋
What are your thoughts on GOLD?
Gold has successfully broken out of its descending channel. After the breakout, price faced resistance and entered a corrective phase.
Price is likely to complete a correction and a pullback to the broken channel.
Once the pullback is complete, gold is expected to resume its bullish momentum.
The next upward move could lead to the formation of new highs.
As long as price holds above the broken channel, the bullish scenario remains valid.
A drop back inside the channel would weaken this setup
What do you think? Will gold continue its rally?
Don’t forget to like and share your thoughts in the comments! ❤️

NZDCAD: Classic Breakout Trade 🇳🇿🇨🇦
NZDCAD broke and closed below a significant daily horizontal support last week.
The broken structure turned into a potentially significant resistance from where
I expect a bearish continuation.
A formation of a double top pattern on that on an hourly time frame suggests
a strong bearish pressure today.
I expect a down movement to 0.8049
❤️Please, support my work with like, thank you!❤️
I am part of Trade Nation's Influencer program and receive a monthly fee for using their TradingView charts in my analysis.

Xauusd Setup Gold (XAU/USD) is in a bullish trend, with price targeting a new high around 3840. Immediate supports are at 3799 (first support) and 3777 (second support). As long as these supports hold, price is expected to continue upward momentum toward the target zone.

Gold price analysis September 29The market recorded strong buying pressure at the beginning of the week when the price was supported from the support zone of 3757. The bullish momentum is taking the price to new highs, and there is currently no notable resistance zone. The Fibonacci area around 3834 becomes the nearest target. In the short term, if there are corrections during the day or during the week, it will still be a potential opportunity to increase buying positions, especially when the market is looking forward to the Nonfarm data at the end of the week.
Trading plan:
BUY when there is a price rejection signal at the support zones of 3707 – 3730 – 3757
Expected target: 3830

EURUSD Follow through EURUSD , 1Hr Onlook
The current placement on SL was hit
But we had a major rejection from that point giving us a large upper wick, confirming our sell
Though the placement on SL was tight , the wick could have been used as both a signal and a confirmation for our Sell
Lets stalk and respond as the market whispers to us

AUDNZD Trading Idea – Momentum & Liquidity OutlookThe pair has been in a clear expansion phase, showing strength after multiple structure breaks. Momentum has favored the upside, while recent consolidation reflects market participants taking profits and rebalancing orders.
A corrective wave appears to be unfolding, which is typical after strong impulsive moves. Such phases often allow liquidity collection before the next directional expansion. The broader sentiment suggests that buyers are still active, but short-term volatility may create temporary pullbacks.
Educational Note: Markets move in cycles of impulse and correction. Recognizing these phases helps traders avoid chasing moves and instead prepare for continuation opportunities once the correction stabilizes.

EUR/USD Forecast: Market Shifts Toward Bearish PressureThe pair has shown a strong upward run earlier this month, but momentum slowed down as sellers stepped in with consistent pressure. Recent movement reflects a corrective phase, with price action shifting into a more cautious and volatile rhythm.
Short-term activity shows fluctuations suggesting indecision, while overall conditions lean toward sellers gradually gaining control. If this pressure continues, the market may extend its decline in the upcoming sessions.

EURUSD: Move Up After Liquidity Grab?! 🇪🇺 🇺🇸
Another XXXDollar pair that looks bullish to me is EURUSD.
The price tested a key daily support yesterday and after
a liquidity sweep below that, the market format a bullish imbalance candle,
followed by an intraday CHoCH.
I suppose that the pair may rise more and reach 1.1695 level.
❤️Please, support my work with like, thank you!❤️
I am part of Trade Nation's Influencer program and receive a monthly fee for using their TradingView charts in my analysis.

AUDCHFAUDCHF price is in the key support zone. If the price can hold above 0.51716, it is expected that the price will rebound. Consider buying in the red zone.
🔥Trading futures, forex, CFDs and stocks carries a risk of loss.
Please consider carefully whether such trading is suitable for you.
>>GooD Luck 😊
❤️ Like and subscribe to never miss a new idea!

Market Analysis | GU, UJ & GOLD – Key Levels & Fundamentals Last week, we spotted ranges across USDJPY, GBPUSD, and XAUUSD, waiting for the big central bank moves to decide direction. Now, the ranges are breaking, except for USDJPY, which is still locked in.
In this video, I walk you through:
✅What happened last week, and why the price moved the way it did
✅The fundamentals and events that shaped sentiment
✅My outlook and key chart levels for the new week (Sep 22–26)
Timestamps:
00:00 – Intro
01:00 – GBPUSD: Breakout fails, dollar strength returns
07:10 – USDJPY: Still trapped in range, waiting for a catalyst
11:50 – XAUUSD: Breaks above range to test record highs
16:50 – Wrap up & key events to watch
This week’s focus will be on the Core PCE data, Powell’s speech, and S&P Global PMIs. These are the catalysts likely to drive sentiment across the dollar, yen, and gold.
Please note that this information is provided for educational purposes only and should not be considered financial advice.
