EURGBP Short Trade Trend: Bullish
Divergence: Bearish
Reversal Pattern: Double Top
Bias: Bearish
Scenario: Sell Stop at Neckline breakout
Trade Plan
Stop Loss : 0.8748
Entry Level: 0.8714
TP1: 0.8674
Forextrading

Australian Dollar Strengthens Following Inflation DataAustralian Dollar Strengthens Following Inflation Data
According to Forex Factory, Australia’s CPI index came in higher than expected: analysts had forecast an annual rate of 2.9%, while the actual figure was 3.0% (previous value: 2.8%).
This led to a strengthening of the Australian dollar, as the Reserve Bank of Australia (RBA) may adopt a more cautious stance in its monetary policy easing process (in August it cut the cash rate from 3.85% to 3.60%, following a peak of 4.35% in 2024).
On the other hand, traders are weighing the impact of yesterday’s remarks from the Chair of the Federal Reserve, who adopted a cautious tone. According to Powell, the Fed must strike a balance between persistent inflation and a weakening labour market, describing the situation as “challenging”.
AUD/USD Technical Analysis
Since the end of last month, AUD/USD has been trading within an ascending channel (shown in blue).
From a bearish perspective:
→ the AUD/USD chart shows signs of aggressive selling above the 0.66700 level — the price fell on wide candlesticks with long upper wicks;
→ if the move from A→B is considered the dominant impulse, the current rise in AUD/USD appears to be an interim recovery — resistance may come from the 50% level and other Fibonacci retracement levels;
→ as shown in red, the chart provides (albeit not very clear) grounds for constructing a descending channel. It is possible that its upper boundary could act as resistance.
From a bullish perspective:
→ the ascending channel remains intact, and a drop to the lower boundary could be followed by a resumption of the upward trend;
→ former resistance at 0.65600 now acts as support;
→ if the move from 0→A is considered the dominant impulse, the fall from A→B could be viewed as a normal correction.
Taking the above into account, both perspectives appear justified, so a consolidation around current levels can be considered the baseline scenario. At the same time, upcoming news from the United States may significantly influence further market dynamics:
→ tomorrow at 15:30 (GMT+3) — GDP and jobless claims data;
→ the day after tomorrow at the same time — Core PCE Price Index.
This article represents the opinion of the Companies operating under the FXOpen brand only. It is not to be construed as an offer, solicitation, or recommendation with respect to products and services provided by the Companies operating under the FXOpen brand, nor is it to be considered financial advice.

The Only Breakout / Fakeout Technical Indicator You Need
This technical indicator will help you to avoid every fakeout on Forex, Gold or any other market and will accurately confirm a valid support or resistance violation.
It is absolutely free and it is available on TradingView, MetaTrader 4/5 or any other trading terminal.
This indicator is very easy to use, and you can set it up in just 1 click.
Discover a proven way to identify traps.
This technical indicator is called On Balance Volume.
To add that to your chart simply open indicators window on TradingView and search it.
By clicking on that, it will immediately start working.
You can find it on the bottom of the chart.
And here is what this free indicator does:
On forex market, this indicator measures tick volume - the number of a price change for a certain period.
Then it compares a current price close with a previous one.
If a current price is higher than previous, it takes a previous volume and adds that to a current volume, making the indicator rise .
If a current price is lower than previous, it takes a previous volume and subtracts a current volume from that, making the indicator fall .
If a current price is the same as the previous, the indicator remains unchanged .
And that indicator can be used to spot fakeouts and traps.
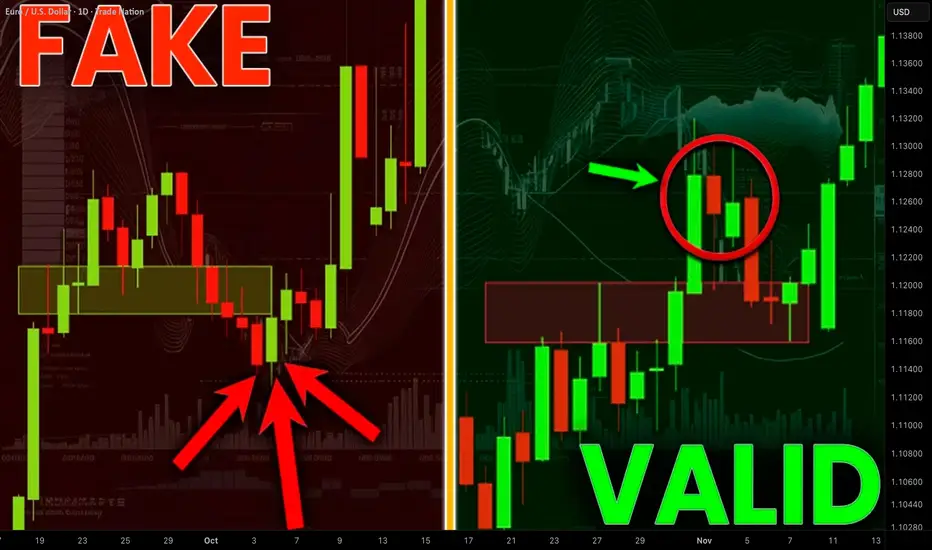
The idea is that valid bullish and bearish breakouts should be accompanied by volume spikes.
If price breaks resistance but OBV doesn’t make a new high, it’s likely a fake breakout. Because a violation occurs with low volumes.
Examine a breakout candle of a horizontal resistance on EURUSD forex pair.
The market successfully closed above that.
On balance volume set a new higher high, confirming a strength of this up movement.
The market continued rising then.
Now compare a previous breakdown to a bullish violation of a resistance area on AUDUSD.
Though, a candle close above that, the indicator sets a lower high, creating a divergence .
It indicates a price manipulation by smart money.
And this breakout was false and On Balance Volume helped us to predict that.
Now let's study bearish breakouts and fakeouts.
A key horizontal support was broken on USDJPY forex pair.
A bearish candle successfully closed below that.
On Balance Volume confirms this bearish violation by a formation of a new local Lower Low.
It signifies that this breakout occurred with a spike of selling activity.
And the price went way lower then.
A bearish violation of a support cluster on NZDCAD is not confirmed by On Balance Volume.
While a candle successfully closed below the underlined area, the indicator sets a Higher Low.
That is an important warning that this violation can be a fakeout.
You can see that it was a bearish trap.
Smart money were manipulating the market, making the price violate that support. The absence of a selling volumes spike suggested that.
As you can see, this indicator is very simple to use.
Integrate that in your trading plan.
It will dramatically increase the accuracy of your breakout trading and fakeout avoidance.
It will help you find traps and expose manipulations.
❤️Please, support my work with like, thank you!❤️
I am part of Trade Nation's Influencer program and receive a monthly fee for using their TradingView charts in my analysis.
XAUUSD GOLD RESISTANCE 3775-3788 READ CAPTIONHi traders'. what do you think about gold
Gold is currently trading near a strong resistance zone (3775 – 3788).
Price has shown bearish rejection from this area, indicating selling pressure.
If buyers fail to push above 3795 (risk level), sellers are likely to dominate.
Downside targets align with support at 3751 and the demand zone at 3736.
Stop loss above 3795 keeps the setup safe and controlled
🔹 Resistance Zone: 3775 – 3788
🔹 Risk Level (Stop Loss): Above 3795
TP1 3751 (support zone)
3736 (demand zone)
⚡ For educational purpose only, not financial advice
👉 Follow for more safe setups & daily analysis! ✅

Waiting for US PMI | Buy the Dip remains the main strategy🟡 XAU/USD M15 – Captain Vincent ⚓
🔎 Captain’s Log – News Context
US PMI will be released tonight – a potential event to trigger big waves for Gold:
• Weak PMI → Gold supported to rise.
• Strong PMI → Gold may retest deeper into the Buy Zone.
Ahead of the data, short-term trend remains bullish , but volatility may spike once the release comes out.
⏩ Captain’s Summary : The Golden ship keeps sailing north, but sailors must be cautious of headwinds from US PMI.
📈 Captain’s Chart – Technical Analysis (M15)
Golden Harbor (Buy Zone)
FVG Dock: around 3764
OB Dock: around 3751
Storm Breaker (Resistance / Sell Zone)
3819 – 3820 (strong resistance)
If breakout succeeds → voyage may extend to 3835+
Market Structure
After a Break of Structure , Gold maintains bullish momentum on M15.
Two supports at 3764 & 3751 are key docks to sustain the journey.
🎯 Captain’s Map – Trade Plan
✅ Buy (trend-follow priority)
Entry: 3764 – 3751
SL: below 3745
TP: 3819 – 3820 → 3835+
⚡ Sell (short scalp at resistance)
Entry: 3819 – 3820
SL: 3828
TP: 3805 – 3790
⚓ Captain’s Note
“The Golden sails hold firm after the BoS . Two Golden Harbors 🏝️ (3764 & 3751) serve as safe docks for sailors to Buy the Dip . Storm Breaker 🌊 (3819 – 3820) is raising waves – if broken, the voyage extends toward 3835+. Tonight’s US PMI is the decisive wind – set the sails but keep a steady helm.”

Gold hits record 3,759 | Safe-haven flows surge back🟡 XAU/USD – 23/09 | Captain Vincent ⚓
🔎 Captain’s Log – Context & News
Today Gold surged nearly +2% , hitting a record $3,759/oz .
Geopolitical tensions : Israel launched missiles into Lebanon, killing 5 (including 4 US citizens) → safe-haven demand rushed back into Gold.
USD weakened , capital flowed out of stocks & bonds → strong support for precious metals.
ETFs & speculators : heavy buying amplified the rally.
Silver : jumped to its highest level in 14 years, reinforcing strength in the precious metals sector.
⏩ Captain’s Summary : Gold is fueled by geopolitics, macro factors, and safe-haven demand. But after a hot rally, the big question: continue breaking highs or face sharp swings if the FED shifts tone?
📈 Captain’s Chart – Technical Analysis (H45)
Storm Breaker (Resistance / Sell Zone)
3,771 – 3,787 (Fibo 0.5–0.618 confluence, ATH test zone)
Golden Harbor (Support / Buy Zone)
Near support: 3,740 (previous high turned support)
OB Dock: 3,717 – 3,723
Breakout Harbor: 3,689 – 3,691
Market Structure
Gold broke out to Higher High around 3,755 – 3,759.
Main trend remains bullish, but prone to volatility / pullback after a hot rally.
🎯 Captain’s Map – Trade Plan
✅ Buy (trend-follow priority)
Buy Zone 1 (OB)
Entry: 3,717 – 3,723
SL: 3,707
TP: 3,725 – 3,730 – 3,735 – 3,740 – 3,750
Buy Zone 2 (Breakout Retest)
Entry: 3,689 – 3,691
SL: 3,678
TP: 3,699 – 3,710 – 3,7xx
⚡ Sell (short-term scalp if overbought)
Sell Zone (ATH test)
Entry: 3,783 – 3,785
SL: 3,795
TP: 3,759 – 3,740 – 3,717
⚓ Captain’s Note
“The geopolitical storm pushed the Golden sails past 3,759. Golden Harbor 🏝️ (3,717 – 3,689) is the safe dock for sailors to board the northbound trend. Storm Breaker 🌊 (3,771 – 3,787) may raise heavy waves, suitable for short Quick Boarding 🚤 scalps. The main voyage remains bullish, but after a hot rally, sailors must keep a firm hand on the helm to avoid being thrown off by choppy swings.”

XAUUSDHello Traders! 👋
What are your thoughts on GOLD?
Gold, after its strong recent rally, is now facing the key resistance area around 3700.
Possible Scenarios:
1️⃣ Scenario One (More Likely):
Given that the market is in an overbought zone, a corrective/ranging move toward the lower boundary of the drawn channel and the marked support area is likely. From there, a new bullish wave could begin, eventually leading to a breakout above resistance and a move toward higher targets.
2️⃣ Scenario Two:
Gold makes only a shallow correction, quickly breaks above the resistance zone, and continues its bullish momentum toward higher levels.
Due to the current overbought conditions, Scenario One (correction before continuation) is more probable. However, the overall trend remains bullish as long as key support levels hold.
Don’t forget to like and share your thoughts in the comments! ❤️

Silver Price Outlook: H4 Technical Charts Point to Bearish MomenSilver prices are flashing early warning signs of weakness as the 4-hour (H4) technical charts reveal a shift in momentum. After weeks of choppy price action, the metal appears to be setting up for a potential downside move in the coming days. Here’s a detailed look at the key drivers and levels to watch.
Technical Picture: H4 Chart Breakdown
Trend Structure
Silver has slipped below its short-term ascending trendline, signaling a possible break in bullish momentum.
Recent candles show lower highs and lower lows, a classic indication of bearish pressure building.
Key Moving Averages
The 50-period EMA has crossed below the 100-period EMA, reinforcing a near-term bearish bias.
Price is also trading under the 21-period EMA, suggesting that sellers are in control.
Momentum Indicators
The Relative Strength Index (RSI) is trending downward, currently hovering near the 40–45 zone—still above oversold territory, leaving room for further declines.
MACD histogram is widening on the negative side, with a fresh bearish crossover confirming selling momentum.

EURUSD Bullish SetupTrend: Bearish
Divergence: Bullish
Continuation Pattern: No
Reversal Pattern: Falling wedge
Bias: Bullish
Scenario:Entry at LH Breakout
Trade Plan:-
Stop Loss 1.17265
Entry Level 1.1794
TP1 1.1862

EURNZD: More Growth Ahead! 🇪🇺🇳🇿
EURNZD broke a significant daily resistance cluster on Friday, providing
a confirmed bullish BoS.
We see a retest of a broken structure today, with a consequent consolidation on that.
A bullish violation of its intraday resistance leaves another bullish clue.
I think the pair will rise more and reach 2.015 soon.
❤️Please, support my work with like, thank you!❤️
I am part of Trade Nation's Influencer program and receive a monthly fee for using their TradingView charts in my analysis.

AUD/USD Trims Gains, Will Bears Take Full Control?Market Analysis: AUD/USD Trims Gains, Will Bears Take Full Control?
AUD/USD failed to stay in a positive zone and declined below 0.6650.
Important Takeaways for AUD/USD Analysis Today
- The Aussie Dollar started a fresh decline from well above 0.6680 against the US Dollar.
- There is a connecting bearish trend line forming with resistance at 0.6610 on the hourly chart of AUD/USD.
AUD/USD Technical Analysis
On the hourly chart of AUD/USD, the pair struggled to clear 0.6700. The Aussie Dollar started a fresh decline below 0.6650 against the US Dollar.
The pair even settled below 0.6620 and the 50-hour simple moving average. There was a clear move below 0.6600. A low was formed at 0.6581 and the pair is now consolidating losses below the 23.6% Fib retracement level of the downward move from the 0.6706 swing high to the 0.6581 low.
On the upside, immediate resistance is near a connecting bearish trend line at 0.6610 and the 50-hour simple moving average. The next major hurdle for the bulls could be near 0.6645 and the 50% Fib retracement.
The main selling point could be 0.6660, above which the price could rise toward 0.6690. Any more gains might send the pair toward 0.6700. A close above 0.6700 could start another steady increase in the near term. In the stated case, the next key resistance on the AUD/USD chart could be 0.6750.
On the downside, initial support is near 0.6580. The next area of interest might be 0.6550. If there is a downside break below 0.6550, the pair could extend its decline. The next target for the bears might be 0.6500. Any more losses might send the pair toward 0.6420.
This article represents the opinion of the Companies operating under the FXOpen brand only. It is not to be construed as an offer, solicitation, or recommendation with respect to products and services provided by the Companies operating under the FXOpen brand, nor is it to be considered financial advice.

Buyers (bulls) are pushing price higher but momentum is weakenin1. Technical Structure
Recent trend: Gold has been moving upward but is gradually forming higher highs with narrowing momentum.
Resistance line: The upper red trendline indicates a dynamic resistance zone where price has been repeatedly rejected.
Support zone: The lower red box (around 3,685 – 3,695) is acting as a demand zone, where price has bounced multiple times.
2. Current Pattern
The chart shows a Rising Wedge pattern: price is climbing with converging highs and lows, which is often a bearish reversal signal.
After touching the upper trendline, the blue arrow indicates the potential for a downward correction.
The downside target could be a retest of the support zone (red box).
3. Market Psychology
Buyers (bulls) are pushing price higher but momentum is weakening at resistance.
Sellers (bears) may take advantage of the higher price levels near the trendline to enter short positions.
The market may create a liquidity grab at the highs before reversing downward.
4. Trade Scenarios (for reference)
Scenario 1 (primary): If price touches the upper trendline and shows reversal signals (e.g., pin bar, bearish engulfing), a Sell position can be considered with the target near the red support zone.
Scenario 2: If gold breaks strongly above the trendline, the bullish trend may continue, with the next observation zone around 3,740 – 3,750.
👉 This is purely a technical analysis. You should also combine it with macroeconomic factors (Fed policy, USD Index, bond yields) to increase reliability before making a trading decision.

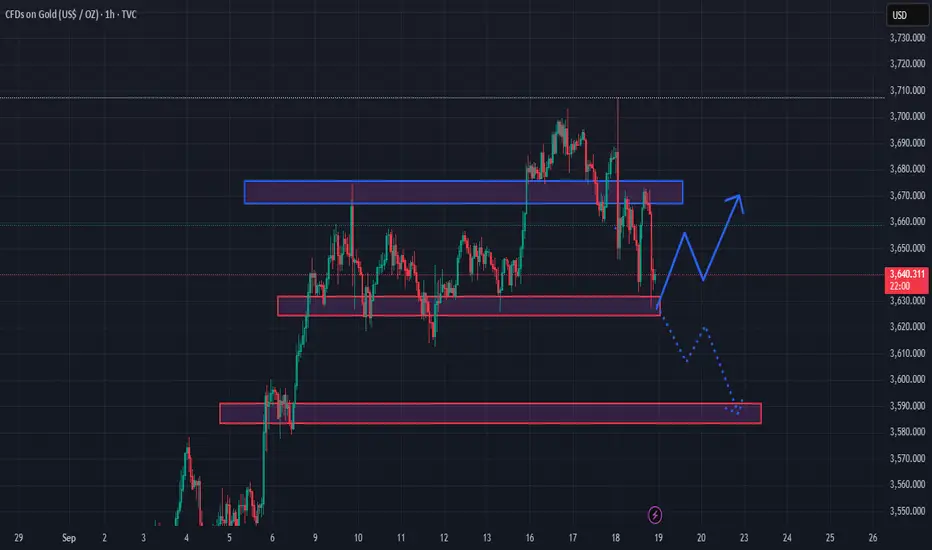
If price hits the 3,720 – 3,730 resistance zone and shows reversTechnical Structure
Main trend: Still within an upward channel but approaching the upper trendline resistance.
Key levels:
Resistance: around 3,720 – 3,730 (red trendline).
Support: around 3,640 – 3,650 (highlighted red box).
Scenario
The blue line illustrates a bullish move testing the upper trendline, followed by an expected drop back to the 3,640 – 3,650 support zone.
This reflects a market maker’s “range play”: pushing price up to attract retail BUY orders, then driving it down to accumulate at cheaper levels.
Market Psychology
Retail traders: Often jump into BUY positions when they see a short-term breakout, but they risk getting “trapped” when the market maker distributes at resistance.
Big players / market makers: Likely to use the resistance zone for distribution, then push price down toward support to reload long positions at a discount.
Trading Strategy (for reference)
Short-term SELL: If price hits the 3,720 – 3,730 resistance zone and shows reversal signals (e.g., pinbar, bearish engulfing).
Take Profit target: 3,640 – 3,650 (red support box).
Stop Loss: Above 3,740.
Safer BUY: Only consider if price reacts strongly bullish at the 3,640 – 3,650 support zone.
👉 In summary: The chart suggests a scenario of testing the upper resistance, then retracing to support. For short-term traders (T+ style), the better play is to look for SELL setups at resistance and BUY setups at support.
Would you like me to also outline an alternative scenario in case price breaks and sustains above 3,730

XAUUSDGold is still in a strong uptrend, the price has a chance to test the $3770-$3782 level zone, if the price cannot break through the 3782 level, there is a chance that the price will go down, consider selling the red zone.
🔥Trading futures, forex, CFDs and stocks carries a risk of loss.
Please consider carefully whether such trading is suitable for you.
>>GooD Luck 😊
❤️ Like and subscribe to never miss a new idea!

XAUUSD Forecast – Gold Price Action and Market InsightsGold is showing signs of stabilization after recent fluctuations, with price consolidating around the mid-range levels. The chart highlights repeated sequences of structural breaks and shifts, indicating that liquidity has been actively swept on both the buy and sell side.
The latest market move shows a controlled decline, followed by an attempt to absorb selling pressure. Current positioning suggests the possibility of a short-term liquidity grab to the downside, which could fuel a stronger recovery leg in the sessions ahead.
The projected outlook favors a scenario where buyers regain momentum, aiming to retest the upper price zones. If this momentum develops, the market may establish a renewed upward leg in alignment with the broader bullish cycle observed across higher timeframes.
From a macro perspective, gold continues to be supported by demand for safe-haven assets amid ongoing global financial uncertainty and shifting monetary policies. This backdrop enhances the probability of gold sustaining its mid-term bullish trajectory despite temporary corrective phases.

Gold holds firm at 3,63x | Caution for Friday session🟡 XAU/USD – 19/09 | Captain Vincent ⚓
🔎 Captain’s Log – Market Context
FED : Probability of a 25bps cut in October is 91.9%, while holding rates is only 8.9% → almost certain FED will continue easing.
US News : No major data today, market remains quiet.
Gold : Sharp moves in Asia session, but support 3,632 – 3,630 held strong.
Yesterday’s Buy at 3,62x delivered 200 pips , confirming this zone as a “fortress” support.
Note : Today is Friday – end of the week session, unexpected volatility may occur before the weekly close → strict risk management required.
⏩ Captain’s Summary : Gold remains bullish, but caution is needed with end-of-week swings. Golden Harbor around 3,63x continues to be a solid anchor.
📈 Captain’s Chart – Technical Analysis
Storm Breaker (Resistance / Sell Zone)
3,661 – 3,663 (intraday resistance)
3,683 – 3,685 (strong OB, likely profit-taking zone)
Golden Harbor (Support / Buy Zone)
3,602 – 3,605 (FVG zone – deeper support if 3,63x breaks, waiting for strong demand)
Market Structure
After rebounding from 3,62x, Gold consolidated around 3,65x – 3,66x.
Main trend stays bullish, but needs support retest to confirm buyers’ strength.
3,66x is the pivot barrier:
• Breakout → targets 3,68x
• Rejection → retest 3,64x – 3,62x
🎯 Captain’s Map – Trade Plan
✅ Buy (priority)
Entry: 3,602 – 3,605
SL: 3,588
TP: 3,629 – 3,661 – 3,683
⚡ Sell (short scalp)
Entry: 3,683 – 3,685
SL: 3,695
TP: 3,665 – 3,645
⚓ Captain’s Note
“The 3,63x fortress continues to hold, keeping the Golden ship safe on its northward journey. Golden Harbor 🏝️ (3,602 – 3,605) remains the main dock for sailors to gather strength. Storm Breaker 🌊 (3,683 – 3,685) may raise waves, suitable for short Quick Boarding 🚤 . Today is Friday – the sea can shift unexpectedly, so keep the sails full but hands steady on the helm.”

EURUSDHello Traders! 👋
What are your thoughts on EURUSD?
The pair is moving within an ascending channel, but after reaching a resistance zone, it has entered a corrective phase.
We expect the correction and sideways range to continue until the price reaches the support area.
From there, a bullish reaction could trigger the next upward move toward higher resistance levels.
As long as EUR/USD trades inside the channel and above the support, the bullish outlook remains valid.
Don’t forget to like and share your thoughts in the comments! ❤️

Gold price analysis September 19Gold has recovered in the Tokyo session and is moving towards yesterday's US session resistance around 3672. The buying pressure is not strong enough to break the resistance in the European session, so be cautious with the possibility of a deep decline in today's weekend session, towards lower support zones around 3600.
The 3645 area - corresponding to the 50% level of the H4 candle - is playing an important support role. This is also the area where buying pressure is starting to accumulate and needs to be closely observed today.
📉 Trading plan:
SELL when the price is rejected around 3671
🎯 Target: 3600
📌 Note: Watch the price reaction at the 3645 area, if there is a confirmation signal from the buyers, this could be a reversal point to look for a BUY opportunity.

FED slows down: Cuts 25bps, gold stays flat🟡 XAU/USD – 18/09 | Captain Vincent ⚓
🔎 Captain’s Log – News Context
FED : Cut rates by 25bps as expected, hinted at 2 more cuts this year → initially supported Gold to rebound around 3,65x.
Powell turned hawkish :
• “No need to move quickly on rate cuts.”
• “Today’s cut is mainly risk-management.”
This message signaled that the FED is not fully opening the easing door → Gold fluctuated and stalled its upside momentum.
Tonight: Awaiting Jobless Claims & Philly Fed for more clarity on the FED’s path.
⏩ Captain’s Summary
Gold is supported by the rate cut, but Powell’s “braking” caused volatility.
Zone 3,663 – 3,665 has become the pivot support to determine the next move.
📈 Captain’s Chart – Technical Analysis
Storm Breaker (Resistance / Sell Zone)
3,684 – 3,686 (strong OB)
3,717 – 3,719 (ATH Zone – very strong, likely heavy selling)
Golden Harbor (Support / Buy Zone)
Pivot Dock: 3,663 – 3,665 (new pivot support)
Main Harbor: 3,629 – 3,630 (BoS confluence & old sideway)
Market Structure
After breakout and profit-taking, Gold returned to test support.
3,663 – 3,665 : pivot support.
• If it holds → rebound to 3,684 – 3,717.
• If it breaks → deeper correction to 3,629.
🎯 Captain’s Map – Trade Plan
✅ Buy (priority)
Buy Zone 1
Entry: 3,663 – 3,665
SL: 3,655
TP: 3,684 – 3,717
Buy Zone 2
Entry: 3,629 – 3,630
SL: 3,618
TP: 3,663 – 3,684 – 3,717
⚡ Sell (only at resistance)
Sell Zone OB
Entry: 3,684 – 3,686
SL: 3,695
TP: 3,665 – 3,645
Sell Zone ATH
Entry: 3,717 – 3,719
SL: 3,727
TP: 3,706 – 3,690 – 3,675
⚓ Captain’s Note
“The Golden sails caught wind as the FED cut rates, but Powell’s headwind slowed the advance. Golden Harbor 🏝️ (3,663 – 3,629) is the pivot dock to decide the next course. If it holds, the ship may rebound to test Storm Breaker 🌊 (3,684 – 3,719) . If it breaks, the ship will retreat deeper to gather strength. For now, Quick Boarding 🚤 should only be done at strong resistance, while the larger voyage still leans northward.”

This is a price zone that has been rejected many times, strong s1. Key Supply & Demand Zones
Supply zone (resistance): around 3,680 – 3,700 (blue box). This is a level where price was rejected multiple times, showing strong selling pressure.
Near-term demand (support): around 3,630 – 3,640 (thin red box just below the current price).
Deeper support: around 3,590 – 3,600 (lower red box), where price previously bounced strongly.
2. Possible Scenarios
Bullish scenario (solid blue arrow):
If price holds the 3,630 – 3,640 support → it may rebound and retest the resistance at 3,670 – 3,690. A strong breakout above 3,700 would confirm continuation to the upside.
Bearish scenario (dotted blue arrow):
If price breaks below 3,630 → it could fall toward 3,590 – 3,600. This is a stronger demand zone where new buying pressure may appear.
3. Trading Notes
On H1, the main trend is still sideways – ranging between 3,590 and 3,700.
Short-term setups could be:
Buy around 3,630 – 3,640 (SL below 3,625, TP 3,670 – 3,690).
Sell around 3,680 – 3,690 (SL above 3,705, TP back to 3,640).
For clear breakouts (high volume, strong candles):
Above 3,700 → bullish bias.
Below 3,590 → bearish bias.
AUDUSD Short SetupTrend: Bearish
Divergence: Bearish
Continuation Pattern: No
Bias: Bearish
Scenario: Head N Shoulder Pattern, SL at Shoulder 2 (LH)
Trade Plan
Stop Loss 0.66837
Entry Level 0.66299
TP1 0.65765

FED countdown | Buy at support, Sell at resistanceXAU/USD – 17/09 | Captain Vincent ⚓
🔎 Captain’s Log – News Context
18/09, 01:00 (US time) : FED rate decision + Dot Plot → policy outlook for upcoming meetings
01:30 : Powell’s speech – the key market focus
Market consensus: FED almost certain to cut -25bps . However, the -50bps scenario still exists → if it happens, it will be a “big boost” for Gold
During Asia–Europe session, Gold faced early profit-taking, dropping quickly to 3,677 – 3,675 , reflecting caution ahead of the FED
⏩ Captain’s Summary
Gold is making a technical correction before the FED.
Medium-term trend remains bullish , but patience is needed to wait for pullbacks for safer Buy entries.
📈 Captain’s Chart – Technical Analysis
Storm Breaker (Resistance / Sell Zone)
Nearby OB: 3,693 – 3,695 (short scalp)
ATH Zone: 3,717 – 3,720 (strong resistance, potential heavy selling)
Golden Harbor (Support / Buy Zone)
Shallow Dock: 3,656 – 3,657 (short-term)
Main Harbor: 3,629 – 3,630
Market Structure
Multiple BoS confirm the bullish trend
Price retracing to support, likely to bounce back and test 3,693 – 3,717
Break above 3,720 → new ATH confirmed
🎯 Captain’s Map – Trade Plan
✅ Buy (priority)
Buy Zone 1
Entry: 3,656 – 3,657
SL: 3,648
TP: 3,675 – 3,693 – 3,717
Buy Zone 2
Entry: 3,629 – 3,630
SL: 3,618
TP: 3,656 – 3,690 – 3,717
⚡ Sell (only at resistance)
Sell Zone OB
Entry: 3,693 – 3,695
SL: 3,705
TP: 3,675 – 3,662
Sell Zone ATH
Entry: 3,717 – 3,720
SL: 3,727
TP: 3,706 – 3,690 – 3,675
⚓ Captain’s Note
“Before the FED countdown, profit-taking waves pulled the Golden ship near Golden Harbor 🏝️ (3,656 – 3,629) .
But the main current still flows north, the bullish trend remains intact.
Storm Breaker 🌊 (3,693 – 3,720) is the high wave, suitable for short Quick Boarding 🚤 scalps.
Sailors must stay patient – the FED wind could be the power to propel Gold beyond new peaks.”

XAUUSDOverall, gold prices remain in a strong uptrend, but in the short term, if the price fails to break above 3704, there is a possibility of a downside, so consider selling in the red zone.
🔥Trading futures, forex, CFDs and stocks carries a risk of loss.
Please consider carefully whether such trading is suitable for you.
>>GooD Luck 😊
❤️ Like and subscribe to never miss a new idea!
