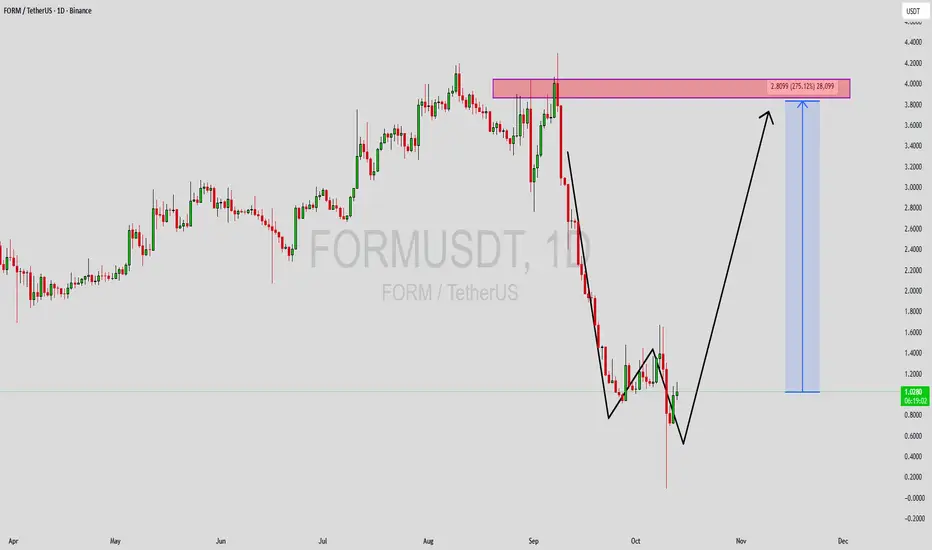
FORMUSDT Forming Falling WedgeFORMUSDT is forming a clear falling wedge pattern, a classic bullish reversal signal that often indicates an upcoming breakout. The price has been consolidating within a narrowing range, suggesting that selling pressure is weakening while buyers are beginning to regain control. With consistent volume confirming accumulation at lower levels, the setup hints at a potential bullish breakout soon. The projected move could lead to an impressive gain of around 140% to 150% once the price breaks above the wedge resistance.
This falling wedge pattern is typically seen at the end of downtrends or corrective phases, and it represents a potential shift in market sentiment from bearish to bullish. Traders closely watching FORMUSDT are noting the strengthening momentum as it nears a breakout zone. The good trading volume adds confidence to this pattern, showing that market participants are positioning early in anticipation of a reversal.
Investors’ growing interest in FORMUSDT reflects rising confidence in the project’s long-term fundamentals and current technical strength. If the breakout confirms with sustained volume, this could mark the start of a fresh bullish leg. Traders might find this a valuable setup for medium-term gains, especially as the wedge pattern completes and buying momentum accelerates.
✅ Show your support by hitting the like button and
✅ Leaving a comment below! (What is your opinion about this Coin?)
Your feedback and engagement keep me inspired to share more insightful market analysis with you!
FORMUSDT

FORMUSDT Forming Falling WedgeFORMUSDT is forming a clear falling wedge pattern, a classic bullish reversal signal that often indicates an upcoming breakout. The price has been consolidating within a narrowing range, suggesting that selling pressure is weakening while buyers are beginning to regain control. With consistent volume confirming accumulation at lower levels, the setup hints at a potential bullish breakout soon. The projected move could lead to an impressive gain of around 140% to 150% once the price breaks above the wedge resistance.
This falling wedge pattern is typically seen at the end of downtrends or corrective phases, and it represents a potential shift in market sentiment from bearish to bullish. Traders closely watching FORMUSDT are noting the strengthening momentum as it nears a breakout zone. The good trading volume adds confidence to this pattern, showing that market participants are positioning early in anticipation of a reversal.
Investors’ growing interest in FORMUSDT reflects rising confidence in the project’s long-term fundamentals and current technical strength. If the breakout confirms with sustained volume, this could mark the start of a fresh bullish leg. Traders might find this a valuable setup for medium-term gains, especially as the wedge pattern completes and buying momentum accelerates.
✅ Show your support by hitting the like button and
✅ Leaving a comment below! (What is your opinion about this Coin?)
Your feedback and engagement keep me inspired to share more insightful market analysis with you!

FORMUSDT Forming Bullish ContinuationFORMUSDT is forming a classic bullish continuation pattern, often seen as a strong bullish reversal signal. This pattern typically represents a period of consolidation before a major upward breakout, and FORM appears to be nearing that crucial breakout zone. The price action has shown decreasing volatility within the wedge, while volume remains steady — a sign that accumulation may be underway. With good trading volume backing the move, a breakout could trigger a potential rally of around 190% to 200%+, offering an attractive opportunity for swing and position traders.
Investors are increasingly showing confidence in FORM, as seen in the recent uptick in participation and interest across multiple trading platforms. The bullish continuation structure, combined with growing investor enthusiasm, supports the idea that the asset could be entering a new bullish phase. This setup often leads to a rapid price recovery once resistance levels are breached, with the potential to attract momentum traders seeking strong technical confirmation.
If the breakout is confirmed with strong volume and follow-through candles, FORMUSDT could experience a significant trend reversal, pushing the price into higher resistance zones and setting the tone for a sustained bullish trend. The technical outlook remains positive, with the chart signaling a favorable risk-to-reward setup for traders closely watching this pair.
✅ Show your support by hitting the like button and
✅ Leaving a comment below! (What is You opinion about this Coin)
Your feedback and engagement keep me inspired to share more insightful market analysis with you!
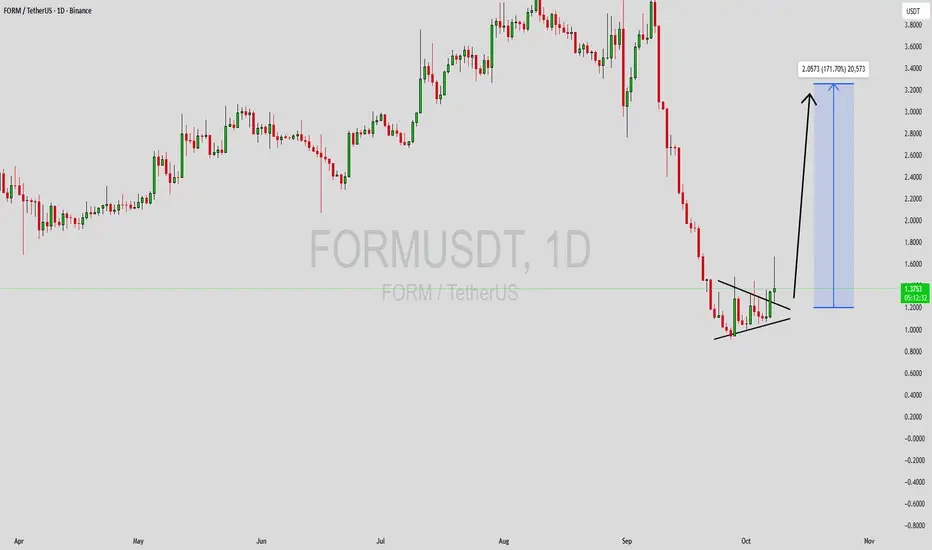
FORMUSDT Forming Falling WedgeFORMUSDT is displaying a powerful **falling wedge pattern**, a formation often recognized as one of the most reliable bullish reversal indicators in technical analysis. After a period of consolidation and gradual price compression, the pair seems ready to break out from this structure with increasing momentum. The volume profile supports this setup, showing steady accumulation from investors who anticipate a major upside reversal.
The current price action indicates growing buyer confidence as the coin continues to test the upper trendline of the wedge. Once a confirmed breakout occurs with sustained volume, FORMUSDT could potentially deliver a strong upward rally, aligning with the projected **140% to 150% gain**. The narrowing wedge structure reflects a market scenario where sellers are losing control and buyers are gradually stepping in to shift the trend direction.
Investor sentiment toward FORMUSDT has been improving, as seen by the consistent inflows and renewed attention from traders looking for undervalued opportunities. The coin’s structure suggests that a bullish phase could emerge soon, supported by healthy market interest and momentum building across the broader crypto sector.
✅ Show your support by hitting the like button and
✅ Leaving a comment below! (What is You opinion about this Coin)
Your feedback and engagement keep me inspired to share more insightful market analysis with you!
FORMUSDT Forming Bullish PennantFORMUSDT is displaying a strong bullish pennant pattern on the chart — a continuation setup that typically forms after a significant upward move, followed by a brief consolidation before another potential rally. The current structure suggests that bulls are maintaining control while the price takes a short pause to gather strength. This consolidation phase, combined with consistent volume, indicates healthy market participation and growing interest from investors who expect a breakout toward new highs.
The bullish pennant pattern often leads to sharp upward movements once resistance levels are breached. In the case of FORMUSDT, a breakout above the upper trendline could trigger a powerful rally, with the potential to deliver impressive gains ranging from 140% to 150%+. The strong volume confirms that accumulation is ongoing, and traders are positioning for a possible continuation of the uptrend as momentum builds.
Investor sentiment around FORMUSDT has been notably positive, with increased trading activity signaling confidence in the project’s long-term value. The current setup suggests that once the breakout is confirmed, we may see rapid price appreciation backed by both technical strength and market demand. This could be a high-reward opportunity for traders who identify the breakout early and manage their positions effectively.
✅ Show your support by hitting the like button and
✅ Leaving a comment below! (What is You opinion about this Coin)
Your feedback and engagement keep me inspired to share more insightful market analysis with you!

FORMUSDT UPDATE#FORM
UPDATE
FORM Technical Setup
Pattern: Bullish falling wedge pattern
Current Price: $1.23
Target Price: $1.85
Target % Gain: 50.85%
NASDAQ:FORM is breaking out of a falling wedge pattern on the 4H timeframe. Current price is $1.23 with a target near $1.85, showing about 50% potential upside. The breakout indicates growing bullish momentum, suggesting a possible continuation move if support holds. Always use proper risk management.
Time Frame: 4H
Risk Management Tip: Always use proper risk management.
FORM Market Update📊 NASDAQ:FORM Market Update
NASDAQ:FORM is testing the red resistance zone 🔴. If breakout occurs with confirmation, the first target will be the 🔵 blue line level 🎯.
$FORM: Charge Into the Bull Run!BINANCE:FORMUSDT
NASDAQ:FORM : Charge Into the Bull Run!
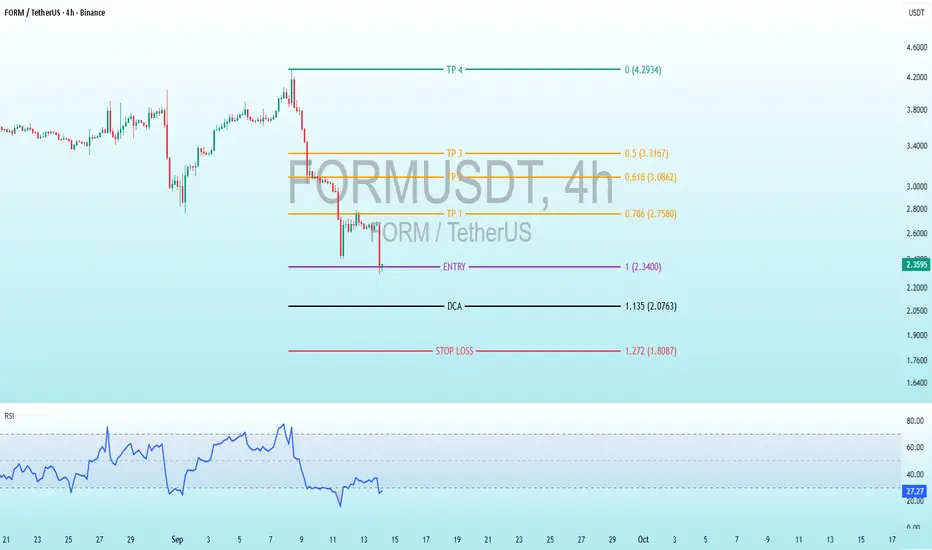
Indicator Analysis: RSI
The Relative Strength Index (RSI, period likely 14 based on standard settings) is plotted below the price chart in blue. It measures momentum on a scale of 0-100, with levels above 70 indicating overbought conditions and below 30 indicating oversold.
Historical RSI Movement: The RSI mirrors the price action closely. It rose above 70 during the early September peak (overbought, signaling potential pullback), plunged below 30 during the mid-September drop (oversold, indicating exhaustion of sellers), recovered to around 60-70 during the rebound, and has now dipped again.
Current Reading: At 27.31 (marked on the right axis), the RSI is deeply oversold. This suggests the recent downmove may be overextended, potentially setting up for a bullish reversal or bounce if buying pressure returns. However, prolonged stays below 30 can indicate strong bearish trends, so confirmation (e.g., RSI divergence or price breakout) would be needed. No visible divergence is present here—the RSI lows align with price lows.
Trading Levels and Setup
The chart features horizontal lines with labels, colors, and Fibonacci ratios, indicating a predefined trading strategy. This appears to be a bullish setup using Fibonacci retracement/extension tools, possibly drawn from a prior swing high (around 4.2934 USD) to a swing low (around 1.8087 USD). Fibonacci tools help identify potential support/resistance based on golden ratios. The levels suggest a long trade (buy low, sell high) with risk management via stop loss and dollar-cost averaging (DCA, buying more at lower prices to average down the entry cost).
Here's a breakdown of the levels (from lowest to highest), including their prices, associated Fib ratios (where labeled), and implications:
Stop Loss Red1.272 1.8087 Risk control point. If price hits here, the trade is exited to limit losses. Placed below key support, allowing ~23% downside from entry (calculated as (2.3400 - 1.8087) / 2.3400 ≈ 22.7%). Common Fib extension for stops in harmonic patterns.
DCA Black 1.135 2.0763 Dollar-cost averaging level. If price dips, buy more here to lower average entry cost.
The "1." might refer to Fib 1.0 or a custom label.EntryPurple1 2.3400 Suggested buy entry for a long position. Near current price action, implying the setup is active or imminent. Positioned at Fib 1.0 (full retracement/end of move).
TP 1 Purple 0.786 2.7580 First take-profit target. ~18% upside from entry. Fib 0.786 is a common deep retracement level for partial exits.
TP 2 Orange 0.618 3.0862 Second TP. ~32% upside from entry. Fib 0.618 (golden ratio) often acts as strong resistance/target.
TP 3 Yellow 0.5 3.3167 Third TP. ~42% upside. Fib 0.5 is a psychological midpoint for scaling out.
TP 4 Green 0 4.293 4Final/ultimate TP. ~83% upside from entry. No Fib label; likely an extension target or prior high.
Strategy Interpretation: This is a classic swing long setup. Enter at 2.3400 USD expecting a bounce (supported by oversold RSI). Scale out profits at TPs for risk-reward ratio optimization—e.g., overall R:R could be 1:3+ if stopping at SL and hitting TP4. If price drops, use DCAs to accumulate. The Fib ratios (0.5, 0.618, 0.786, 1, 1.272) align with standard extensions/retracements, possibly from a bearish move, targeting a reversal. Current price seems near the entry, with downside risk to SL (~22.7% loss) vs. upside to TP4 (~83% gain).
Potential Risks and Considerations:
Bearish Bias: Recent red candles and oversold RSI could lead to further downside if support breaks (e.g., below 2.08 DCA).
Volatility: Crypto markets like FORM (a smaller-cap token) are prone to whipsaws; the sharp mid-Sep drop highlights this.
Confirmation Needed: Look for bullish candle patterns (e.g., hammer, engulfing) or RSI breakout above 30 for entry. External factors like market sentiment, news on Formation Fi, or broader crypto trends (e.g., Bitcoin correlation) could influence.
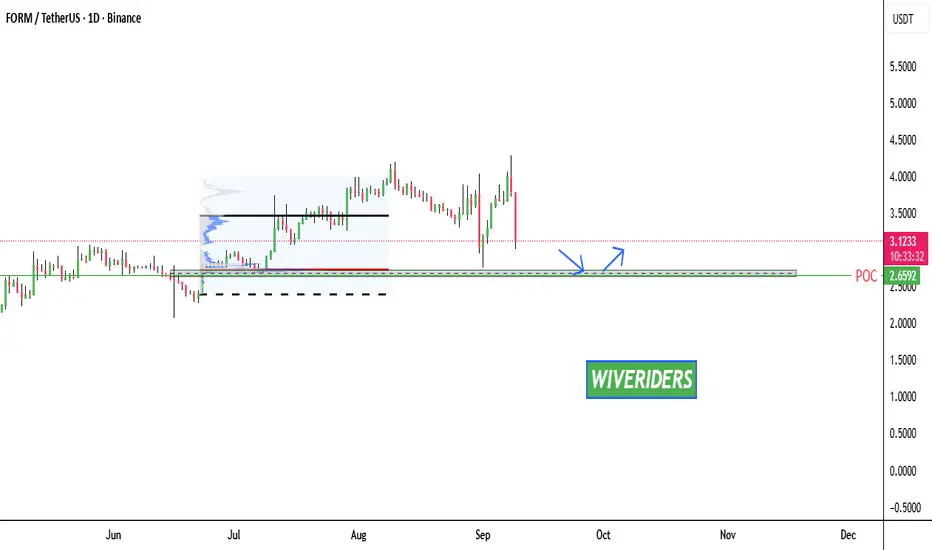
$FORM Trading UpdateNASDAQ:FORM Trading Update
NASDAQ:FORM is approaching the green support zone around 2.6592, which lines up with the POC and strong volume accumulation. This area has previously shown strong buyer interest, and a bounce from here is possible.
If bulls step in, price could push higher again — but ⚠️ waiting for confirmation before entering long is essential.
(POC + accumulation cluster) are the key reasons for focusing on this zone.
Happy trading ✨
FORMUSDT Forming Bullish ContinuationFORMUSDT is showing strong momentum after breaking out of a downward channel formation, indicating a potential reversal in price action. The breakout suggests that selling pressure has been absorbed and buyers are now stepping in to take control. With good trading volume supporting the move, this pair is gaining attention among traders and investors who are watching closely for further confirmation of bullish continuation.
Based on the technical setup, FORMUSDT is expected to deliver gains in the range of 20% to 30%+. The breakout, along with increasing investor participation, signals that the coin has strong potential to test higher resistance levels in the short to medium term. A sustained push above key levels could pave the way for stronger rallies, making this a pair worth keeping on the radar.
The market sentiment around this project is also showing improvement as investors recognize the opportunity for solid returns. With healthy volume and visible interest, FORMUSDT is positioned to build momentum if the current trend continues. As always, traders should monitor price movements carefully and manage risk according to their trading strategy.
✅ Show your support by hitting the like button and
✅ Leaving a comment below! (What is You opinion about this Coin)
Your feedback and engagement keep me inspired to share more insightful market analysis with you!
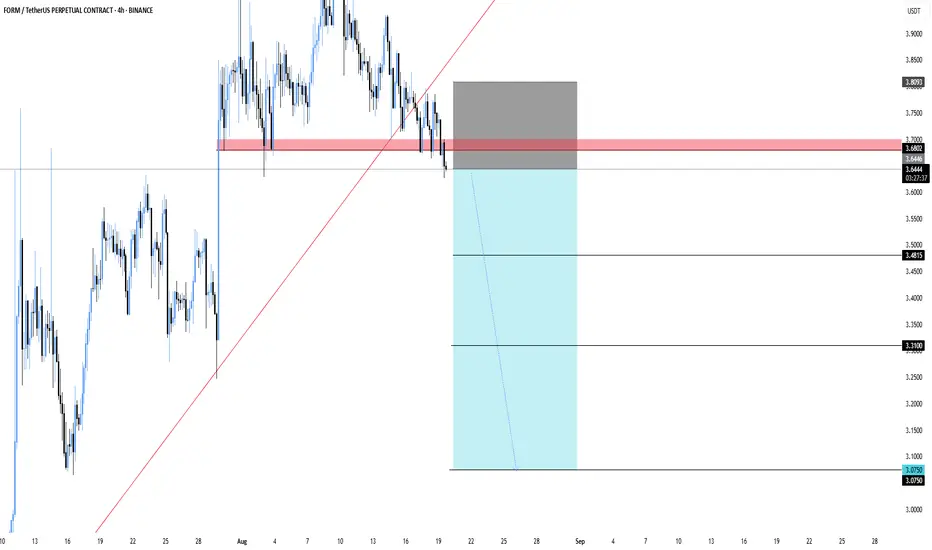
FORMUSDT.P – Break Below SupportFORMUSDT – Break Below Support
FORM has broken its trendline and slipped under the support zone. As long as it stays below this area, the momentum looks bearish with more room to the downside.
Entry: 3.64
Stoploss: 3.8093
Targets:
3.48
3.31
3.075
Let’s see if the breakdown continues or if buyers step back in.
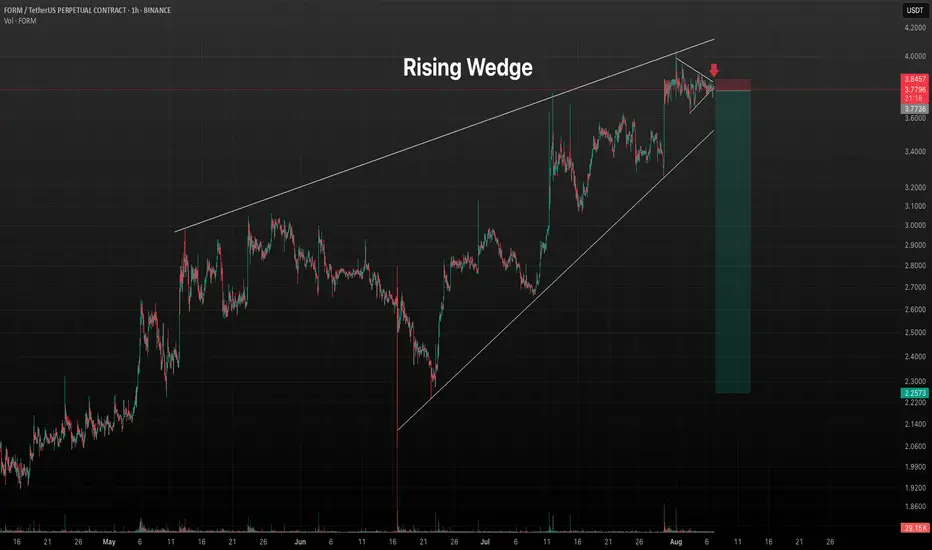
FORMUSDT - 4h Rising Wedge & 15m Symmetrical TriangleDouble signals resonate for a very high profit/loss ratio opportunity.
FORMUSDT Forming Bullish WaveFORMUSDT is currently shaping a bullish wave pattern, signaling a potential upward continuation in price. This technical structure is typically characterized by impulsive moves followed by brief consolidations, suggesting growing investor confidence. The pair has recently shown strength with higher lows and steady volume increases, confirming that accumulation may be underway. Traders watching this pattern should note the supportive technical foundation forming at current price levels.
The projected gain for FORMUSDT ranges from 40% to 50%, supported by positive volume dynamics and increased market interest. The breakout potential from this bullish wave setup is significant, especially as the market begins to rotate capital back into promising low-cap altcoins. With momentum indicators trending upward and no immediate resistance overhead, this setup offers a strong opportunity for medium-term growth.
Investor sentiment around FORM is improving as the project gains visibility within the DeFi and Web3 sectors. The team behind FORM has been steadily building infrastructure that supports yield generation, DAO participation, and cross-chain functionality—all of which align with broader crypto market trends. These factors are drawing attention from both retail and strategic investors looking for next-wave DeFi plays.
As FORMUSDT builds this bullish structure, market participants should keep a close eye on price action and volume for continuation signals. A clean breakout backed by rising volume could validate the projected gains and initiate the next leg higher in this bullish cycle.
✅ Show your support by hitting the like button and
✅ Leaving a comment below! (What is You opinion about this Coin)
Your feedback and engagement keep me inspired to share more insightful market analysis with you!

$FORM/USDT Breakout.$FORM/USDT just reclaimed a key demand zone after a breakout below the trendline.
The strong bullish candle signals a possible reversal, with upside potential toward $3.4456.
As long as the price holds above $2.6072–$2.7054, bulls are in control. MACD also hints at a momentum shift.
DYRO, NFA

FORM/USDT: LONG SCALP SETUP!!🚀 FORM Bull Pennant Breakout – 15% Potential Incoming?! 👀🔥
Hey Traders! If you're all about high-conviction plays and real alpha, smash that 👍 and tap Follow for more setups that actually deliver! 💹💯
FORM is consolidating within a bullish pennant on the 1H chart after a strong 15% impulse move — classic continuation setup.
Price is hugging the triangle resistance and sitting above the 100 EMA, showing strength and reducing downside pressure.
📈 Entry: CMP and add more up to $2.83
🎯 Targets: $3.21 / $3.28 / $3.35
🛑 Stop-Loss: Below $2.78
📊 Risk-Reward: Excellent
💥 Bias: Bullish
📉 Leverage: Use low leverage (max 5x) for safer exposure
Keep your eyes on volume confirmation. A decisive move above the triangle could lead to another explosive leg up.
Agree with the setup? Drop your thoughts below! 👇

FORMUSDT | Buyer Interest Around the Blue BoxFORMUSDT is showing active buyers, and the blue box below stands out as a strong potential demand zone.
If price returns there, I’ll be looking for confirmation on lower timeframes. The setup is simple — strong zone, active interest, and a clear structure to lean on.
“I will not insist on my short idea. If the levels suddenly break upwards and do not give a downward break in the low time frame, I will not evaluate it. If they break upwards with volume and give a retest, I will look long.”
The market rewards those who wait for the right moment, not the loudest noise.
📌I keep my charts clean and simple because I believe clarity leads to better decisions.
📌My approach is built on years of experience and a solid track record. I don’t claim to know it all but I’m confident in my ability to spot high-probability setups.
📌If you would like to learn how to use the heatmap, cumulative volume delta and volume footprint techniques that I use below to determine very accurate demand regions, you can send me a private message. I help anyone who wants it completely free of charge.
🔑I have a long list of my proven technique below:
🎯 ZENUSDT.P: Patience & Profitability | %230 Reaction from the Sniper Entry
🐶 DOGEUSDT.P: Next Move
🎨 RENDERUSDT.P: Opportunity of the Month
💎 ETHUSDT.P: Where to Retrace
🟢 BNBUSDT.P: Potential Surge
📊 BTC Dominance: Reaction Zone
🌊 WAVESUSDT.P: Demand Zone Potential
🟣 UNIUSDT.P: Long-Term Trade
🔵 XRPUSDT.P: Entry Zones
🔗 LINKUSDT.P: Follow The River
📈 BTCUSDT.P: Two Key Demand Zones
🟩 POLUSDT: Bullish Momentum
🌟 PENDLEUSDT.P: Where Opportunity Meets Precision
🔥 BTCUSDT.P: Liquidation of Highly Leveraged Longs
🌊 SOLUSDT.P: SOL's Dip - Your Opportunity
🐸 1000PEPEUSDT.P: Prime Bounce Zone Unlocked
🚀 ETHUSDT.P: Set to Explode - Don't Miss This Game Changer
🤖 IQUSDT: Smart Plan
⚡️ PONDUSDT: A Trade Not Taken Is Better Than a Losing One
💼 STMXUSDT: 2 Buying Areas
🐢 TURBOUSDT: Buy Zones and Buyer Presence
🌍 ICPUSDT.P: Massive Upside Potential | Check the Trade Update For Seeing Results
🟠 IDEXUSDT: Spot Buy Area | %26 Profit if You Trade with MSB
📌 USUALUSDT: Buyers Are Active + %70 Profit in Total
🌟 FORTHUSDT: Sniper Entry +%26 Reaction
🐳 QKCUSDT: Sniper Entry +%57 Reaction
📊 BTC.D: Retest of Key Area Highly Likely
📊 XNOUSDT %80 Reaction with a Simple Blue Box!
📊 BELUSDT Amazing %120 Reaction!
📊 Simple Red Box, Extraordinary Results
I stopped adding to the list because it's kinda tiring to add 5-10 charts in every move but you can check my profile and see that it goes on..
$FORM Trade Setup 2H ChartPrice is consolidating below key resistance after a strong 30% move.
- Forming higher lows with bullish structure
- Breakout + Retest scenario in play
- Target: $3.74
- Stop-loss: $2.72
Watch for a breakout and retest entry for a low-risk, high-reward move! 👀🚀
DYRO, NFA

BNB is in an interesting zoneBNB is going to test its ATH at previous cycle (around $700) and at the next step, its total ATH (around $800). If it break these levels, BNB parabola is inevitable. At this situation, BSC tokens like NASDAQ:FORM , $Cookie, NASDAQ:CAKE and ... will have potential to explode.

FORM / USDT Long Setup – Major Breakout Alert!🚀 FORM Breakout Alert – 50% Potential Incoming?! 👀🔥
Hey Traders! If you're all about high-conviction plays and real alpha, smash that 👍 and tap Follow for more setups that actually deliver! 💹💯
FORM has officially broken out of a massive symmetrical triangle on the 4H chart after weeks of tight consolidation. This is a classic technical setup that often leads to explosive moves, and the market is starting to pay attention! ⚡📈
📍 Entry Zone: $2.12 – $2.16
✅ Entry around the current breakout zone to catch early momentum.
🎯 Targets:
• Target 1 → $2.60 (key horizontal resistance)
• Target 2 → $2.90 (major breakout extension zone)
• Target 3 → $3.10+ (blue-sky breakout level)
🛡 Stop Loss (SL): $2.06 (just below the lower trendline and support zone)
💥 Why this setup is exciting:
✅ Clean triangle breakout after multi-week compression
✅ Strong historical pattern — last breakout ran over +50%
✅ EMA alignment turning bullish
✅ Volume spike on breakout confirmation
✅ Market sentiment improving with higher lows on the chart
🔑 Pro Trading Tips:
Watch for a retest of the $2.15 breakout zone — it may offer a second-chance entry.
Scale out profits gradually at each target zone to lock in gains.
Always use proper position sizing and stick to your SL to manage risk.
📢 Final Thoughts:
This setup has the technicals lined up for a potential trend expansion. If momentum continues and we see a confirmed retest, NASDAQ:FORM could deliver a textbook bullish move. Don’t ignore the opportunity — but trade smart!
💬 What’s your game plan for NASDAQ:FORM ? Share your targets, strategies, and thoughts below — let’s learn and win together! 👇👇👇

Which of the Multiple Patterns Will Play Out?Hey friends, I’m back with another great coin analysis. Today we’re looking at #FORMUSDT.P. On this coin, we have multiple formations, including the BULLISH WOLF WAVE FORMATION, a potential breakdown of a falling wedge, and perhaps a flag formation as well.
If we take the Wolf Wave formation as our main guide, our first target would be the $2.40 level, which corresponds to the 4th movement in the pattern. The second target, depending on the time frame, would be around the blue line, which is approximately $2.63.
If the flag formation plays out, we could potentially see a price range between $2.80 and $3.10.
Let’s watch and see how it goes. My long position is active with some leverage.
Let’s fish and see what happens! 🎯
Manage your risk, stay in the game! 🎯🔥
#AlyAnaliz #TradeSmart #CryptoVision #FORMUSDT #Binanciega

SEI/USDT LONG TERM SETUPNYSE:SEI is holding the $0.18 support, showing signs of accumulation.
Backed by big players (e.g., Trump’s World Liberty).
Flip $0.218
Potential move to $2.....
Not financial advice.
DYOR.

#FORMUSDT: Quick Breakdown of a Long Setup!📉 Long BYBIT:FORMUSDT.P from $1.9037
🛡 Stop Loss: $1.8313
🕒 1H Timeframe
⚡️Overview:
➡️ Current Price: $1.8831 — this is where BYBIT:FORMUSDT.P is trading right now.
➡️ The price recently dropped from around $2.0000 to $1.4000 — a sharp decline! But then it started recovering and is now in a consolidation zone.
➡️ Volume: At the bottom of the chart, you can see volume bars. There was a particularly large volume at the $1.4000 level, where the price reversed. This suggests a lot of activity — possibly big players starting to buy.
➡️ Key Levels: The right side of the chart shows important price levels:
➡️ $1.8313 — stop loss to protect us from losses.
➡️ $1.8932 and $1.88313 — the nearest resistance levels that the price needs to break to move higher.
➡️ $1.7464 — a support level below, in case the price goes down.
🎯 TP Targets:
💎 TP 1: $1.9690
💎 TP 2: $2.0400
💎 TP 3: $2.0890
⚡️ Plan:
➡️ Entry Point: $1.9037 — this is the level to enter the buy. The price is currently slightly below ($1.8831), so we need to wait for it to rise to this mark.
➡️ Stop Loss: $1.8313 — if the price falls below this, the trade will close with a small loss to minimize risks.
Risk/ Reward: If we calculate, the distance from the entry to the stop loss is $0.0724, and to TP1 — $0.0653 (a ratio of nearly 1:1). To TP2 — $0.1363 (1:1.88), and to TP3 — $0.1853 (1:2.56). This is a good profit potential if the price moves up!
📢 The BYBIT:FORMUSDT.P price just bounced off the strong $1.4000 level, where there was high volume. This could be a signal that big players started buying, and the market is ready to rise.
📢 The $1.9037 level (entry point) aligns with the POC (Point of Control) — the zone with the highest trading volume, which often attracts the price.
📢 If the price breaks the resistance at $1.8932, it could easily reach $1.9037 and then move toward our targets.
🎯 How Does This Signal Relate to the Market?
The recent news about the resolution of the #Ripple vs. #SEC case, which I wrote about earlier, creates a positive backdrop for the entire crypto market.
➡️ When major projects like #Ripple gain clarity, it adds confidence to investors.
➡️ Altcoins like BYBIT:FORMUSDT.P can catch this wave of optimism.
➡️ If the market continues to rise, BYBIT:FORMUSDT.P has a chance to break resistance and move toward our targets!
➡️ Important: The crypto market is volatile, so don’t forget about risk management. Don’t risk more than 1-2% of your deposit on a single trade.

FORM/USDT Analysis: Beginning of a Bearish Trend?After its recent listing on Binance, the coin formed a strong level at $1.90 with multiple touches. Today, an attempt was made to break this level, resulting in numerous anomalies on the cluster chart and the formation of a strong volume zone at $1.93–$2.
If this zone is tested and a strong selling reaction appears, we open a short position. If there is no reaction and the price consolidates above this zone, it will confirm the buyers' intentions. In this case, we expect further upward movement and treat this zone as a mirror support level.
