NZD/AUD Forecast: The Climb to 0.90 Amid Diverging Rates
Current Status: The New Zealand Dollar (NZD) has stabilized against the Australian Dollar (AUD), trading at 0.8728 . After bottoming near 0.86 in November, the cross is recovering, driven by a recalibration of interest rate expectations and shifting economic currents.
Macroeconomic Analysis: The Central Bank Divergence
A primary driver of the NZD/AUD recovery is the reassessment of monetary policy trajectories. The Reserve Bank of New Zealand (RBNZ) faces persistent domestic inflation, tempering expectations for aggressive rate cuts. Conversely, the Reserve Bank of Australia (RBA) maintained its cash rate at 3.60% in December, maintaining a hawkish stance due to upside inflation risks. This narrowing policy gap, where the RBNZ is no longer significantly "out-dovin" the RBA, provides crucial support for the Kiwi dollar.
Geostrategy & Geopolitics: The China Factor
Both currencies remain sensitive to Chinese economic stability, but their exposure differs significantly. The AUD serves as a liquid proxy for Chinese industrial demand, facing volatility as Beijing recalibrates stimulus measures for 2026. In contrast, the NZD ties closely to soft commodities like dairy and meat, which see resilient demand despite broader geopolitical friction. As trade routes stabilize, lower volatility in New Zealand's export markets contributes to the currency's "safe harbor" appeal relative to the risk-sensitive Aussie.
Industry Trends: AgTech vs. Mining Tech
New Zealand’s shift toward high-margin agricultural technology (AgTech) is altering its export profile. Innovation in sustainable farming and automated dairy processing boosts productivity, offsetting headwinds from traditional commodity price fluctuations. Meanwhile, Australia’s mining sector grapples with high capital costs for green energy transitions. This structural divergence suggests New Zealand’s export economy is entering a phase of higher efficiency, supporting long-term valuation.
Economics: The Housing Market Constraints
Economic resilience is visible in the housing sector. Australian data indicates a 7.2% rise in home values since early 2025, driven by supply shortages. This "wealth effect" keeps consumption high, forcing the RBA to stay restrictive. New Zealand’s housing market shows more balanced supply-demand dynamics. This stability allows the RBNZ more flexibility, potentially reducing the risk of a policy error that could devalue the currency.
Forecast: The Path to 0.90
Current projections estimate the NZD/AUD cross will climb toward 0.90 by early 2027 . This forecast assumes a gradual normalization of the interest rate differential. The recovery will likely be non-linear; periods of Australian dollar strength are inevitable if global risk sentiment spikes. However, as the easing cycle proves shallower than feared and the RBA eventually pivots, the fundamental floor for the NZD is expected to rise.
Conclusion: The NZD/AUD is no longer trapped in a one-way bearish trend. Investors should watch the spread between Australian and New Zealand 2-year swap rates as the key indicator for the next leg higher.
Forrex

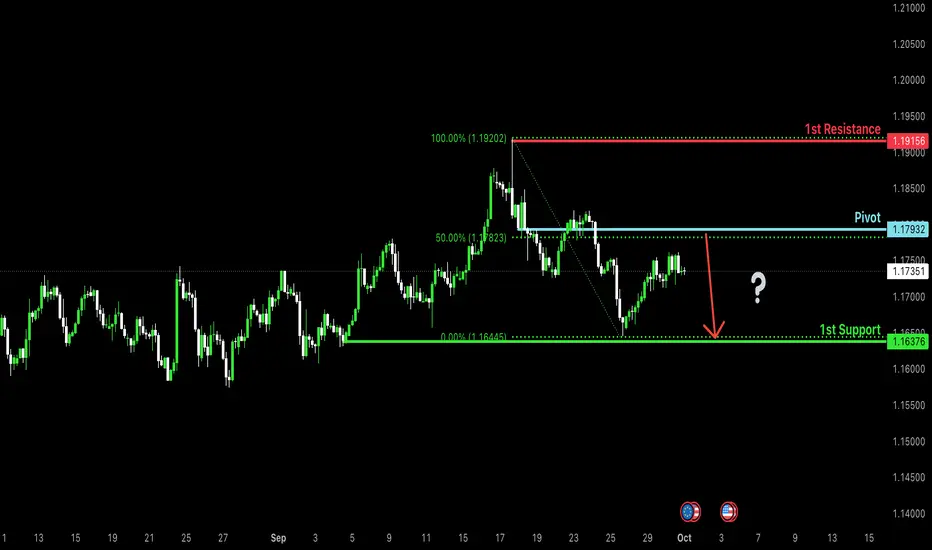
Bearish reversal off 50% Fibonacci resistance?The Fiber (EUR/USD) is rising towards the pivot and could reverse to the 1st support.
Pivot: 1.1793
1st Support: 1.1637
1st Resistance: 1.1915
Disclaimer:
The above opinions given constitute general market commentary, and do not constitute the opinion or advice of IC Markets or any form of personal or investment advice.
Any opinions, news, research, analyses, prices, other information, or links to third-party sites contained on this website are provided on an "as-is" basis, are intended only to be informative, is not an advice nor a recommendation, nor research, or a record of our trading prices, or an offer of, or solicitation for a transaction in any financial instrument and thus should not be treated as such. The information provided does not involve any specific investment objectives, financial situation and needs of any specific person who may receive it. Please be aware, that past performance is not a reliable indicator of future performance and/or results. Past Performance or Forward-looking scenarios based upon the reasonable beliefs of the third-party provider are not a guarantee of future performance. Actual results may differ materially from those anticipated in forward-looking or past performance statements. IC Markets makes no representation or warranty and assumes no liability as to the accuracy or completeness of the information provided, nor any loss arising from any investment based on a recommendation, forecast or any information supplied by any third-party.
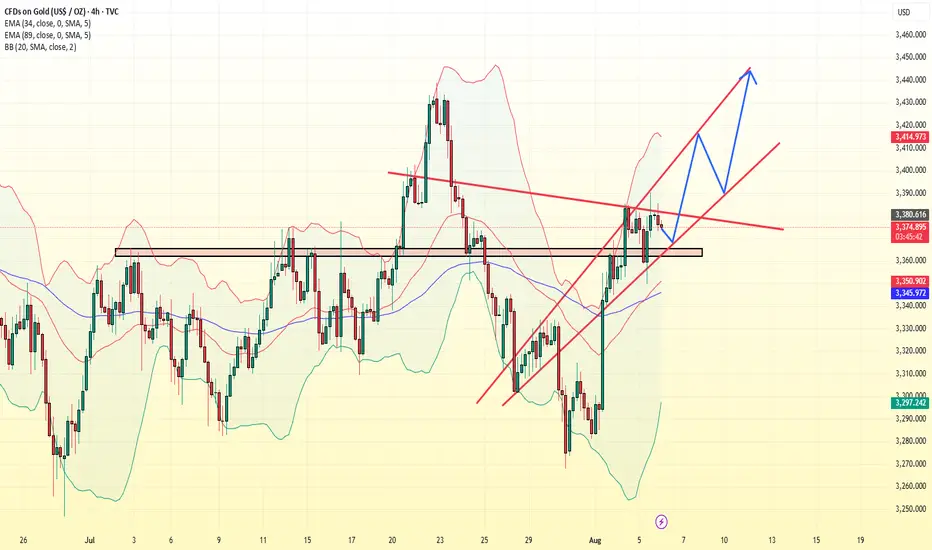
gold trading strategy for todayThe price is 3,400 USD/ounce. The main reason is believed to be due to the weaker-than-expected US labor market, increasing the possibility of the US Federal Reserve (FED) cutting interest rates, thereby promoting the increase of this precious metal as investors seek gold as a safe haven.
Some analysts note that, since reaching a historical peak of 3,500 USD on April 22, 2025, the gold price has fluctuated in a narrow range from 3,180 to 3,400 USD/ounce. Based on macro assumptions, analysts predict that the gold price may reach 3,850 USD/ounce in the second quarter of 2026 and the current period is like "compressing the spring" - preparing for a strong increase in gold prices in the near future.
Meanwhile, Citigroup (a US multinational financial group) has just raised its forecast for world gold prices to $3,500/ounce in the next 3 months, $3,300/ounce for 6-2025, $3,300 - $3,600/ounce. The main reasons include concerns about US economic growth, high inflation due to US President Donald Trump's tariff policy and a weakening USD.
Gold is waiting for news from the CPI indexThe international gold marketplace final week constantly acquired critical records, inflicting costs to constantly reverse. Notably, at the final buying and selling day of the week, the marketplace suffered shocks that prompted costs to constantly "plunge". In simply 1 day, gold misplaced greater than 3.5%, marking the most important intraday sell-off considering 2020. In the cutting-edge context, maximum analysts agree with that gold costs might also additionally check aid stage of 2,two hundred USD/ounce.
Although latest jobs records will probable push gold costs decrease withinside the quick term, a few are positive that the valuable metallic may want to discover momentum subsequent week as worldwide issues increase. Investment will flip to inflation records along side trends on the Federal Open Market Committee (FOMC) economic coverage meeting.

trade with gold 15/9Ethereum faces a significant hurdle in the form of the 21-day Exponential Moving Average (EMA). Despite trading around $1,618.43, Ethereum has struggled to break through this resistance level. Low network activity has also affected its deflationary status. Breaking the 21 EMA is crucial for Ethereum's bullish outlook, while failure may indicate a bearish trend.
Solana (SOL):
Solana, currently trading at approximately $18.6, is showing signs of accumulation despite recent market concerns. Increased trading volume and open interest suggest informed investors are buying during the dip. This could indicate a more positive future for Solana, as its fundamentals remain strong.
Cardano (ADA):
Cardano is in a challenging position, trading at $0.2471 below the 21 EMA. However, declining trading volume and a bottomed-out Relative Strength Index (RSI) may hint at a potential turnaround. The 21 EMA remains a crucial level to watch for ADA's future direction.


AUDNZDHello Traders, here is the full analysis for this pair, let me know in the comment section below if you have any questions, the entry will be taken only if all rules of the strategies will be satisfied. I suggest you keep this pair on your watchlist and see if the rules of your strategy are satisfied.
The way I told you, you have to trade like this and you will have more profit always and you will not be a loss.

Gold ideaIn my point of view, market will retest the last major areas and then pick the actual trend .. be care full for long entries alleyways put your SL

XAUUSD GOLDWe might see this pair treat that Break as BOS then utilize that OB above before a good fall

USDCAD SHORT POSITIONOnce again another best trade entry to bearish zone its move from HL & HH to HL & LL. short after the price reach the HL


DeGRAM | GBPUSD LONGthe price is moving in an upward trend, it is necessary to gain a foothold at the support and continue to move up.DeGRAM | EURUSD pullback from support to 1.1264

GBPNZD longs_NOV 22 2020Looking for a POSSIBLE sell to buy scenario. If this occurs looking to take out liquidity on the upside. shall see PA
1hr OB
refined to 15 min for entry
looking for sh,bms, and to for entry
liquidity topside


#EURCAD - Going Up and Completing three touches on the TrendlineThis pair may go long according the trend analysis we did, of course we hope its going complete three touch.
"IF YOU HAVE ANY OTHER IDEA, PLEASE LET US KNOW"

USD/CNH LONG IDEA As we can noticed we have a beautiful head and shoulders pattern here i would really like to buy after breaking the neck line
tp and SL are explained in the chart , best luck for all of you <3


USDCADAffter reach the top of the line we can see a new bearish move for the down side.
And now affter retest this down side trend line we can confirm our sell position.

NZDCAD Still potentially Have One More Shot To The Up Side NZDCAD clearly broke and closed above the major long term support level,
the market on the Daily and the 4 hour chart retraced and is now at the inner up trend line near support,
this could give us one more shot to reach the highs before it starts dropping

NZDJPY SELL SETUPSELL SETUP ABOUT NZDJPY
_________________________________________________________________________________________________________________________________________
Traders! if you like my ideas and do take the same trade, please write it in comment so we can manage the trade together.
_________________________________________________________________________________________________________________________________________
Disclaimer : The content on this analysis is subject to change at any time without notice, and is provided for the sole purpose of assisting traders to make independent investment decisions.
_________________________________________________________________________________________________________________________________________
Thank you for your support!


EURJPY SELL 1ST TARGET - 115.000DECSCENDING PENNANT FORMATION
I WOULD BE LOOKING FOR A BREAK & RETEST OF THE GREY DAILY RESISTANCE
BEFORE ENTERING SHORT
WAIT FOR THE BREAK!!!!
