NDQ - Ascending Channel at FVG Decision Zone | Break 25,873?
Hey TradingView!
NASDAQ 100 is at a critical decision point right now. Let me break down what I'm seeing on the 15-minute chart.
The Setup
NDQ is trading at 25,741 inside an ascending channel, currently consolidating in the FVG zone around 25,780-25,830. Price keeps pushing up, pulling back into the FVG, then bouncing - classic accumulation pattern.
The key level is 25,873.01. Break above that = liftoff. Reject = back down to test lower supports.
Why This Level Matters
Ascending channel intact - higher highs, higher lows
FVG zone acting as decision zone - price consolidating here
25,873.01 is the KEY resistance - break above = bullish continuation
CPI came in cooler than expected - supports Fed rate cut narrative
S&P 500 and Dow at record highs - NASDAQ lagging slightly
Intel and AMD upgraded by KeyBanc - chip sector bullish
The News Context
Mixed but leaning bullish:
Core CPI cooler than expected (0.2% vs 0.3%) - bullish for rate cuts
S&P 500 hit record high Monday - broad market strength
JPMorgan beat earnings but stock dropped (credit card cap fears)
Intel +3.4%, AMD +1.9% on KeyBanc upgrades
Alphabet briefly hit $4 trillion market cap - AI momentum
Global central banks releasing coordinated support for Fed independence
Small caps outperforming (Russell 2000 +6.2% YTD vs S&P +1.9%)
Key Levels I'm Watching
Resistance:
25,873.01 - KEY BREAKOUT LEVEL (must break for bulls)
25,930 - Upper channel resistance
26,000+ - Bullish target if breakout confirms
Support:
25,780-25,830 - FVG zone (current consolidation)
25,642 - Day's low / immediate support
25,500 - Channel midline support
25,400 - Lower channel support
My Game Plan
Bullish scenario: If NDQ breaks above 25,873.01 with volume, we fly to 25,930 upper channel, then 26,000+. The ascending channel is intact, CPI was bullish, and chip stocks are getting upgraded. Break the resistance = momentum kicks in.
Bearish scenario: If we reject at 25,873 and lose the FVG zone, next stop is 25,642 (day's low), then 25,500 channel midline. High impact news (Fed drama, earnings misses) could trigger the breakdown.
Range scenario (MOST LIKELY short-term): Price continues to consolidate in the FVG zone, bouncing between 25,780-25,873. Wait for the breakout confirmation before committing.
The Bottom Line
I'm NEUTRAL with a bullish lean. The ascending channel is intact and CPI was supportive, but we need to break 25,873.01 to confirm the next leg up. Until then, we're just consolidating in the FVG zone.
Watch that 25,873 level closely. Break above = bullish. Reject = more consolidation or pullback.
What do you think? Breakout or rejection? Let me know in the comments! 👇
Foryoutrading

ES - Ascending Channel Near ATH | FVG Retest in Play
Hey TradingView community! 👋
S&P 500 futures are consolidating just below all-time highs. Let me break down what I'm seeing on the 45-minute chart.
The Setup
ES1! is trading at 7,001 inside an ascending channel, currently retesting the FVG zone around 6,970-6,990. Price keeps pushing up to resistance, pulling back to the FVG, then bouncing again. Classic consolidation near highs before the next move.
We're literally 0.19% away from the record high. The question is: breakout or rejection?
Why I'm Cautiously Bullish
Ascending channel intact - higher highs, higher lows
FVG zone holding as support - buyers defending this level
Third highest close in HISTORY yesterday
Up 19.39% over the past year - strong momentum
CPI came in line with expectations - Fed cuts still on table
Forward curve pricing 8,000+ by 2031 - long-term bullish
The News Context
Mixed signals but leaning bullish:
S&P 500 hit record high 6,977.27 on Monday - just 0.19% away
CPI in line with expectations - supports Fed rate cut narrative
JPMorgan beat earnings but stock dropped 4% (credit card cap fears)
Trump vs Powell drama continues - "that jerk will be gone soon"
Financials dragging (Visa, Mastercard down 4%+)
Gold hitting record highs - safe-haven demand elevated
Up 22.80% since tariffs announced in April 2025
Key Levels I'm Watching
Resistance:
7,036 - Day's high / immediate resistance
7,040 - Major resistance zone
7,050+ - BREAKOUT TERRITORY (new ATH)
Support:
6,970-6,990 - FVG zone (current retest)
6,955 - Horizontal support
6,900 - Lower channel support
6,858 - 2026 low (major support)
My Game Plan
Bullish scenario (PRIMARY): If ES holds the FVG zone (6,970-6,990) and bounces, we push back to 7,036-7,040 resistance. A break above 7,040 with volume = new all-time highs. Target 7,050+, then 7,100. The ascending channel is intact and we're consolidating near highs - this is typically bullish.
Bearish scenario: If we lose the FVG zone and break below 6,955, next stop is 6,900 lower channel support. Financial sector weakness (JPM, V, MA) could drag the index lower. Watch for Fed drama escalation.
Range scenario: Price continues to oscillate between FVG support (6,970) and resistance (7,040). Trade the range until breakout.
The Bottom Line
I'm CAUTIOUSLY BULLISH. The ascending channel is intact, we're consolidating just below all-time highs, and the FVG zone is holding as support. This is textbook bullish structure - consolidate near highs, then break out.
The risk is the financial sector weakness and Fed drama. But as long as we hold the FVG zone, the path of least resistance is higher.
Watch for the breakout above 7,040. That's the trigger for new ATH.
What do you think? New highs incoming? Let me know in the comments! 👇

MNQ - Ascending Channel Range Play | FVG Zones Holding
Hey TradingView community! 👋
NASDAQ futures are in classic range mode right now. Let me break down what I'm seeing on the 45-minute chart.
The Setup
MNQ1! is trading at 25,941 inside an ascending channel, currently sitting right in the upper FVG zone around 25,880-25,920. Price has been respecting this channel beautifully - bouncing between the upper and lower boundaries like clockwork.
This is a range-bound market. Until we get a decisive breakout, expect more of the same: test resistance, pull back to FVG, bounce, repeat.
Why I'm Neutral Here
Ascending channel intact - but price is RANGING, not trending
Two FVG zones acting as magnets - price keeps retesting them
S&P 500 at record highs but NASDAQ lagging slightly
Fed pressure headlines creating uncertainty (Powell vs Trump drama)
CPI data Tuesday could be the catalyst for breakout
Bank earnings starting this week (JPM Tuesday)
The News Context
Mixed signals keeping the market choppy:
S&P 500 hit record high Friday - but NASDAQ underperforming
Trump vs Powell drama - DOJ threatening Fed Chair over "renovation" testimony
Credit card rate cap proposal hitting bank stocks hard
Soft jobs data (50K vs 60K expected) - but unemployment dropped to 4.4%
Banks pushing back rate cut expectations after jobs report
Walmart joining Nasdaq-100 on Jan 20 - could bring passive fund flows
CPI report Tuesday - this is the big catalyst to watch
Key Levels I'm Watching
Resistance:
26,000 - Psychological level / upper channel
26,280 - Major resistance (near 52-week high)
26,399 - 52-WEEK HIGH
Support:
25,880-25,920 - Upper FVG zone (current)
25,800-25,860 - Lower FVG zone
25,600 - Channel midline support
25,320 - Lower channel support
My Game Plan
Range scenario (MOST LIKELY): Price continues to oscillate within the ascending channel. Expect retests of the FVG zones. Trade the range - buy at lower FVG, sell at upper channel resistance. This is a scalper's market until we get a breakout.
Bullish scenario: If CPI comes in soft and we break above 26,000 with volume, next target is 26,280, then 26,399 (52-week high). Walmart joining Nasdaq-100 on Jan 20 could bring passive buying.
Bearish scenario: If CPI comes in hot or Fed drama escalates, we could break below 25,600 and test 25,320 lower channel support. Watch bank earnings for sentiment.
The Bottom Line
I'm NEUTRAL here. The channel is intact but we're just ranging. No clear trend until we break out. The FVG zones are acting as support/resistance - trade the range or wait for the breakout.
CPI Tuesday is the key. That's likely the catalyst that decides direction.
What do you think? Breakout or more chop? Let me know in the comments! 👇

XRP - Descending Channel | Breakout or Breakdown? | Massive News
Hey TradingView community! 👋
XRP is at a make-or-break level right now. Let me break down what I'm seeing on the 45-minute chart.
The Setup
XRPUSD is trading at $2.09 inside a clear descending channel that's been in play since early January. Price has been making lower highs and lower lows, but we're now sitting right at a critical support zone around $2.10-2.18.
This is the moment of truth - either buyers step in here and we get a breakout, or we lose this level and continue lower.
Why This Level Matters
Descending channel support being tested RIGHT NOW
$2.10-2.18 zone has acted as support multiple times
Whale activity spiking to 3-month highs - smart money accumulating?
CNBC just called XRP the "new crypto darling"
Massive institutional news dropping (Ripple + BNY, FCA approval, Evernorth partnership)
The News is HUGE
Ripple just had a monster week:
BNY (Bank of New York) tapped Ripple Prime for tokenized deposits - this is massive institutional adoption
Ripple secured FCA authorization in the UK - clearing path for expansion
Evernorth + Doppler Finance partnership to boost XRP as yield-generating asset for institutions
South Korea announcing spot Bitcoin ETFs - XRP ETF momentum building
Analysts saying XRP could outperform Bitcoin on percentage gains
Key Levels I'm Watching
Resistance:
$2.18 - Upper channel resistance / breakout level
$2.32 - Major horizontal resistance
$2.50+ - Bullish target if breakout confirms
Support:
$2.10 - Current support zone (CRITICAL)
$1.90 - Lower channel support
$1.61 - 52-week low area
My Game Plan
This is a two-scenario setup:
Bullish scenario: If XRP holds above $2.10 and breaks out of the descending channel with volume, we could see a sharp move toward $2.32 and potentially $2.50+. The institutional news flow is extremely bullish - BNY partnership, FCA approval, whale accumulation. If Bitcoin pumps, XRP could explode.
Bearish scenario: If we lose $2.10 support and break below the channel, next stop is $1.90. The descending channel trend would continue until we see a clear reversal signal.
The Bottom Line
I'm cautiously bullish here. The news catalysts are incredible - Ripple is getting institutional adoption at a rapid pace. Whale activity at 3-month highs suggests smart money is accumulating. BUT the chart structure is still bearish until we break out of this descending channel.
Watch the $2.10 level closely. Hold = bullish. Break = more downside.
What's your take? Breakout or breakdown? Let me know in the comments! 👇

Position Sizing: The Decision That Matters More Than Your Entry
Your Entry Doesn't Matter If Your Size Is Wrong
Here's a truth that will save your trading career:
A mediocre strategy with excellent position sizing will outperform an excellent strategy with poor position sizing.
Every. Single. Time.
Position sizing is the most important decision you make — and most traders barely think about it.
What Is Position Sizing?
Definition:
Position sizing determines how much capital you allocate to each trade.
What It's NOT:
"I'll buy 100 shares"
"I'll use 10% of my account"
"I'll risk what feels right"
What It IS:
A calculated decision based on:
Your account size
Your risk tolerance
The specific trade's risk
Your overall portfolio exposure
Why Position Sizing Matters Most
The Math of Ruin:
If you lose 50% of your account, you need 100% gain to break even.
If you lose 90%, you need 900% to recover.
10% loss → Need 11% to recover
20% loss → Need 25% to recover
30% loss → Need 43% to recover
50% loss → Need 100% to recover
70% loss → Need 233% to recover
90% loss → Need 900% to recover
The Implication:
Avoiding large losses is more important than capturing large gains.
Position sizing is your primary defense.
Position Sizing Methods
Method 1: Fixed Dollar Amount
Risk the same dollar amount on every trade.
Example:
Account: $100,000
Risk per trade: $1,000
Every trade risks exactly $1,000
Pros: Simple, consistent
Cons: Doesn't scale with account growth/decline
Method 2: Fixed Percentage
Risk the same percentage of account on every trade.
Example:
Account: $100,000
Risk per trade: 1%
Risk = $1,000
If account grows to $120,000:
Risk = $1,200
Pros: Scales with account, anti-martingale effect
Cons: Requires recalculation as account changes
Method 3: Volatility-Adjusted
Adjust position size based on the asset's volatility.
Formula:
Position Size = (Account × Risk%) / (ATR × Multiplier)
Example:
Account: $100,000
Risk: 1% = $1,000
Stock ATR: $2
Multiplier: 2 (stop at 2 ATR)
Position Size = $1,000 / ($2 × 2) = 250 shares
Pros: Equalizes risk across different volatility assets
Cons: More complex calculation
Method 4: Kelly Criterion
Mathematically optimal sizing based on edge.
Formula:
Kelly % = W -
Where:
W = Win probability
R = Win/Loss ratio
Example:
Win rate: 55%
Average win: $150
Average loss: $100
R = 1.5
Kelly = 0.55 - (0.45/1.5) = 0.25 = 25%
Reality Check:
Full Kelly is too aggressive. Use fractional Kelly (25-50% of calculated).
Pros: Mathematically optimal for growth
Cons: Requires accurate edge estimation, high variance
The Position Sizing Formula
Universal Formula:
Position Size = Risk Amount / Risk Per Share
Where:
Risk Amount = Account Size × Risk Percentage
Risk Per Share = Entry Price - Stop Loss Price
Step-by-Step Example:
Account Size: $50,000
Risk Percentage: 2%
Risk Amount: $50,000 × 0.02 = $1,000
Entry Price: $100
Stop Loss: $95
Risk Per Share: $100 - $95 = $5
Position Size: $1,000 / $5 = 200 shares
Position Value: 200 × $100 = $20,000
Verification:
If stopped out: 200 shares × $5 loss = $1,000 = 2% of account ✓
Position Sizing Mistakes
Sizing Based on Conviction — "I'm really confident, so I'll size up." Confidence doesn't equal accuracy. Your "best" ideas often fail. Same risk percentage regardless of conviction.
Ignoring Correlation — Taking 5 "different" positions that all move together. You think you're diversified but you're concentrated. Consider correlation when calculating total portfolio risk.
Averaging Down Without Plan — Adding to losers to "lower average cost." Increasing exposure to losing positions. If averaging down, include it in original position sizing plan.
Not Accounting for Gaps — Assuming stop loss will execute at your price. Gaps can blow through stops. Size for worst-case gap, especially around events.
Sizing for Profit, Not Risk — "I want to make $5,000 on this trade." Focuses on reward, ignores risk. Always size based on what you can lose, not what you want to make.
AI-Enhanced Position Sizing
1. Dynamic Risk Adjustment
AI adjusts risk percentage based on:
Recent performance (reduce after losses)
Market volatility (reduce in high vol)
Strategy performance (reduce when underperforming)
2. Correlation-Aware Sizing
AI calculates:
Portfolio correlation matrix
True portfolio risk
Optimal position sizes to maintain target risk
3. Kelly Criterion Optimization
AI continuously updates:
Win rate estimates
Win/loss ratio
Optimal Kelly fraction
4. Scenario Analysis
AI simulates:
Worst-case scenarios
Gap risk
Correlation spikes during stress
Position Sizing Rules
Rule 1: Never Risk More Than 2% Per Trade
For most traders, 1-2% is appropriate.
Aggressive: 2%
Conservative: 0.5-1%
Rule 2: Limit Total Portfolio Risk
Maximum open risk at any time: 6-10%
If you have 5 positions at 2% each = 10% total risk
Rule 3: Reduce Size After Losses
After significant drawdown, reduce position sizes.
This is anti-martingale: bet less when losing.
Rule 4: Account for Correlation
Correlated positions = concentrated risk.
Treat correlated positions as one larger position.
Rule 5: Size for the Stop, Not the Target
Your position size is determined by where you're wrong, not where you want to be right.
Position Sizing Checklist
Before every trade:
What is my account size today?
What percentage am I risking? (1-2%)
What is my dollar risk amount?
Where is my stop loss?
What is my risk per share?
What is my calculated position size?
What is my total portfolio risk with this trade?
Is this position correlated with existing positions?
Quick Reference Table
$10,000 account → 1% = $100, 2% = $200
$25,000 account → 1% = $250, 2% = $500
$50,000 account → 1% = $500, 2% = $1,000
$100,000 account → 1% = $1,000, 2% = $2,000
$250,000 account → 1% = $2,500, 2% = $5,000
Key Takeaways
Position sizing matters more than entry timing or stock selection
Risk a fixed percentage (1-2%) of your account per trade
Calculate position size based on stop loss distance
Account for correlation — correlated positions multiply risk
Reduce size after losses, not increase (anti-martingale)
Your Turn
How do you currently determine position size?
Have you ever been hurt by sizing too large?
Share your position sizing rules below 👇

DJI - Ascending Channel Rejection at 49,000 | Trump Policy
Executive Summary
Dow Jones Industrial Average (DJI) trading at 48,996.08 after a sharp 466-point drop (-0.94%) on January 7, 2026. Price rejected from the upper ascending channel resistance near 49,600 and is now consolidating within a key support zone between 48,500-49,000. Despite the pullback, the Dow just triggered a rare Dow Theory buy signal on January 6 when both the Dow Industrials and Dow Transports hit record highs simultaneously - the first such signal in over a year. Trump policy headlines creating volatility, but the secular bull market remains intact.
BIAS: CAUTIOUSLY BULLISH - Support Zone Test
The trend remains bullish on higher timeframes. Current pullback is a healthy consolidation within the ascending channel. Watch the 48,500-49,000 support zone for bounce or breakdown.
Current Market Data - January 8, 2026
Current Price: 48,996.08 (-466.00 / -0.94%)
Day's Range: 48,951.99 - 49,621.43
52-Week Range: 36,611.78 - 49,621.43
Market Status: Closed (Last update Jan 7, 17:00 GMT-5)
Index Type: CFD
Performance Metrics:
1 Week: +1.29%
1 Month: +2.14%
3 Months: +5.09%
6 Months: +10.15%
YTD: +1.85%
1 Year: +14.45%
All timeframes positive. Best 4-day start to a year since 2018 (+1.9% through first 4 trading days).
THE BIG STORY - Dow Theory Buy Signal + Trump Policy Chaos
Historic Dow Theory Signal
On January 6, 2026, the Dow Theory flashed a bullish signal for the first time in more than a year. Both the Dow Jones Industrial Average and Dow Jones Transportation Average tallied record closing highs on the same day - a classic confirmation that the secular bull market remains alive and well.
Key points:
Dow Industrials hit record high of 49,462.08 on Jan 6
Dow Transports hit first record since Nov 25, 2024
100-year-old indicator confirms bull market intact
Rotation trade benefiting cyclicals and value stocks
Transportation stocks big beneficiaries of rotation
Trump Policy Headlines Creating Volatility
We're only one week into 2026 and the market is already dealing with a flood of geopolitical headlines:
Trump called for 50%+ increase in U.S. defense budget to $1.5 trillion by 2027
Executive order blocking defense contractors from dividends/buybacks until they speed up production
Plans to ban Wall Street firms from buying single-family homes
U.S. intervention in Venezuela - deal to import $2B of Venezuelan crude
"Donroe Doctrine" drama targeting Greenland, Colombia, Cuba
European defense stocks hitting record highs on spending expectations
MACRO DRIVERS - What's Moving the Dow
1. Defense Sector Turmoil
Trump's executive order sent defense stocks tumbling:
Lockheed Martin (LMT): -4.8%
Northrop Grumman: -5.5%
General Dynamics: -3.6%
RTX (Raytheon): -2.5%
European defense stocks at record highs (BAE +5.8%, Leonardo +4.4%)
Stocks bounced in afterhours trading
2. Financial Sector Weakness
JPMorgan Chase (JPM): -2.3% after Wolfe Research downgrade
Blackstone: -5.6% on housing ban news
Invitation Homes: -6% on single-family home ban
Banks expected to report higher Q4 profits next week
Investment banking revenue accelerating
3. Labor Market Data Mixed
JOLTS: Job openings fell to 14-month low in November
ADP: Private payrolls +41,000 in December (weak)
Initial jobless claims: 214,000 (better than expected)
Friday's NFP report is the key data point
Unemployment expected to drop to 4.5% from 4.6%
4. Fed Policy Outlook
83% odds Fed pauses at Jan 27-28 meeting
Hot economy could mean fewer rate cuts
Need unemployment near 5% for significant easing
Few economists expect that in near term
Rate cut expectations fading
5. Venezuela Oil Deal
Trump deal to import up to 50 million barrels of Venezuelan crude
U.S. "selectively rolling back sanctions" on Venezuelan oil
Revenue to stabilize Venezuela economy
Repay Exxon and ConocoPhillips for nationalized assets
Oil prices fell sharply on supply expectations
Brent: $59.96 | WTI: $55.99
Technical Structure Analysis - 45 Minute Timeframe
Ascending Channel Pattern
The chart shows a well-defined ascending channel (blue shaded area):
Lower trendline support connecting higher lows
Upper trendline resistance connecting higher highs
Channel intact since mid-December
Price rejected from upper channel resistance near 49,600
Currently testing mid-channel support zone
Dashed midline providing dynamic support/resistance
Key Price Action
Jan 6: Hit record high 49,462.08 (Dow Theory confirmation)
Jan 7: Rejected from 49,621.43 intraday high
Sharp 466-point drop (-0.94%)
Now consolidating at 48,996.08
Testing critical support zone
Key Levels
Resistance:
49,621.43 - 52-WEEK HIGH / Day's high (red line)
49,462.08 - Jan 6 record close
49,300-49,400 - Upper channel resistance zone (pink box)
50,000 - Psychological round number
Support:
48,951.99 - Day's low / immediate support
48,500-49,000 - Current support zone (pink box on chart)
48,300 - Channel midline support (dashed line)
47,600 - Lower channel support (red line)
47,300 - Major support level
SCENARIO ANALYSIS
BULLISH SCENARIO - Bounce from Support Zone
Trigger Conditions:
Price holds 48,500-49,000 support zone
Bullish rejection candle on 45min/1H
Volume confirmation on bounce
Defense stocks stabilize
Friday NFP comes in strong
Price Targets if Bullish:
Target 1: 49,300-49,400 (upper channel)
Target 2: 49,621 (52-week high retest)
Target 3: 50,000 (psychological)
Extended: 50,500+ (new ATH territory)
BEARISH SCENARIO - Channel Breakdown
Trigger Conditions:
Price breaks below 48,500 support
Volume confirmation on breakdown
Defense sector continues selling
Weak NFP data Friday
Fed hawkish signals
Price Targets if Bearish:
Target 1: 48,300 (channel midline)
Target 2: 47,600 (lower channel support)
Target 3: 47,300 (major support)
Extended: 46,500 (deeper correction)
NEUTRAL SCENARIO - Range Consolidation
Most likely short-term outcome:
Price consolidates between 48,500-49,300
Wait for Friday NFP for direction
Digest Trump policy headlines
Healthy consolidation before next leg
Dow Theory signal provides floor
MY ASSESSMENT - CAUTIOUSLY BULLISH
Bullish Factors (Dominant):
Dow Theory buy signal (first in over a year)
Best 4-day start since 2018
All performance metrics positive
Secular bull market intact since Oct 2022
Ascending channel structure holding
Rotation into cyclicals/value continuing
Strong Q3 GDP (4.3%)
Banks expected to report strong Q4
M&A activity surging
Bearish Factors (Caution):
Sharp rejection from 52-week high
Defense sector turmoil (Dow components)
Trump policy uncertainty
Fed rate cut expectations fading
Friday NFP risk event
Elevated valuations (98th percentile)
My Stance: CAUTIOUSLY BULLISH - Buy Support Zone
The Dow Theory signal is significant - this 100-year-old indicator just confirmed the bull market is alive. The pullback from 49,621 to 48,996 is a healthy 1.3% correction within the ascending channel. The 48,500-49,000 support zone is the key level to watch.
Strategy:
Watch for bounce at 48,500-49,000 support zone
Long on bullish rejection candle with volume
Target 49,300-49,400 (upper channel)
Extended target 49,621 (52-week high)
Stop below 48,300 (channel midline)
Wait for Friday NFP before large positions
Trade Framework
Scenario 1: Support Zone Bounce
Entry Conditions:
Price tests 48,500-48,800 zone
Bullish rejection candle (hammer, engulfing)
Volume spike on bounce
RSI oversold on lower timeframes
Trade Parameters:
Entry: 48,500-48,800 at support
Stop Loss: 48,200 below support zone
Target 1: 49,300 (upper channel)
Target 2: 49,621 (52-week high)
Risk-Reward: ~1:2.5
Scenario 2: Breakout Above 52-Week High
Entry Conditions:
Price breaks above 49,621 with volume
Momentum indicators confirming
Strong NFP data Friday
Trade Parameters:
Entry: 49,650-49,700 on confirmed breakout
Stop Loss: 49,200 below recent support
Target 1: 50,000 (psychological)
Target 2: 50,500 (new ATH territory)
Risk-Reward: ~1:2
Scenario 3: Channel Breakdown
Entry Conditions:
Price breaks below 48,300 channel midline
Volume confirmation
Defense stocks continue selling
Trade Parameters:
Entry: 48,200-48,300 on confirmed breakdown
Stop Loss: 48,700 above breakdown level
Target 1: 47,600 (lower channel)
Target 2: 47,300 (major support)
Risk-Reward: ~1:1.5
Risk Management Guidelines
Position sizing: 1-2% max risk per trade
Friday NFP is major risk event - reduce size before
Trump headlines can move markets suddenly
Defense stocks are Dow components - watch sector
Scale out at targets
Don't fight the trend - it's still bullish
Key Events to Watch
Thursday Jan 8: Initial jobless claims, trade deficit, Q3 productivity
Friday Jan 9: December Non-Farm Payrolls (KEY EVENT)
Next Week: Bank earnings begin (JPM, BAC, WFC, C)
Jan 27-28: FOMC Meeting (83% odds of pause)
Invalidation Levels
Bullish thesis invalidated if:
Price closes below 47,600 (lower channel)
Dow Transports break down significantly
VIX spikes above 20
Major geopolitical escalation
Bearish thesis invalidated if:
Price closes above 49,621 (new ATH)
Strong NFP data Friday
Defense stocks recover
Fed signals more rate cuts
Conclusion
The Dow Jones Industrial Average is at a critical juncture after rejecting from the 52-week high. The Dow Theory buy signal confirms the secular bull market is intact, but Trump policy headlines are creating short-term volatility.
The Numbers:
Current Price: 48,996.08
52-Week High: 49,621.43
YTD Performance: +1.85%
1-Year Performance: +14.45%
Best 4-day start since 2018
Key Levels:
49,621 - 52-WEEK HIGH (bullish target)
49,300-49,400 - Upper channel resistance
48,996 - Current price
48,500-49,000 - Support zone (WATCH THIS)
47,600 - Lower channel support
The Setup:
Dow Theory just flashed a buy signal for the first time in over a year. The ascending channel is intact. The pullback is healthy. Watch the 48,500-49,000 support zone for the next move.
Strategy:
Buy support zone (48,500-49,000)
Target 49,300-49,400 (upper channel)
Extended target 49,621 (52-week high)
Stop below 48,300
Wait for Friday NFP for confirmation
The Dow Theory signal says the bull market is alive. Trade accordingly.
List your thoughts below!

AMD - Descending Wedge at $221 | OpenAI Partnership + MI400 Chip
Executive Summary
AMD trading at $221.08 within a descending wedge on the 4H timeframe. Major catalyst: CES 2026 unveiled MI455, MI440X AI chips with OpenAI partnership expected to generate billions in revenue. MI500 previewed (1,000x faster than MI300, shipping 2027). Descending wedge typically bullish reversal pattern. Earnings in 28 days.
BIAS: BULLISH - Descending Wedge + AI Catalyst
Current Market Data
Current: $221.08 (-1.07%)
Pre-market: $222.77 (+0.76%)
Day's Range: $220.48 - $234.02
52-Week: $76.48 - $267.08
Market Cap: $359.93B
Next Earnings: 28 days
CES 2026 Catalysts
MI455 processors powering OpenAI data centers
MI440X for enterprise on-premise AI deployments
MI500 preview - 1,000x faster than MI300 (shipping 2027)
OpenAI deploying 6 gigawatts of AMD GPUs
Ryzen AI 400 Series for Copilot+ PCs
Ryzen 7 9850X3D - fastest gaming processor
Greg Brockman (OpenAI) on stage with Lisa Su
Technical Structure - 4H
Descending Wedge Pattern:
Falling resistance and support trendlines (yellow dashed)
Wedge narrowing toward apex
Typically bullish reversal (70% break up)
Price broke out of $200-$210 consolidation zone
Key Levels:
Resistance:
$234 - Day's high / immediate resistance
$240 - Secondary resistance
$263 - Upper resistance (red line) / breakout target
$267.08 - 52-WEEK HIGH
Support:
$220 - Immediate support
$200 - $210 - Consolidation zone (red box)
$196 - Major support (red line)
SCENARIO ANALYSIS
BULLISH: Wedge Breakout
Trigger: Break above descending wedge resistance (~$235-$240)
Targets: $250 → $263 → $267 (52-week high)
Catalyst: OpenAI partnership, MI400 deployment, earnings beat
BEARISH: Wedge Breakdown
Trigger: Break below $200 support
Targets: $196 → $180
Invalidates bullish thesis
My Assessment
Descending wedge with major AI catalyst. OpenAI partnership deploying 6GW of AMD GPUs = billions in revenue. CES 2026 unveiled MI455, MI440X, previewed MI500 (1,000x faster). Lisa Su: "AI is the most important technology of the last 50 years." Earnings in 28 days - consistent beats. Bullish structure for breakout.
Strategy:
Long on wedge breakout above $235-$240
Target $250, $263, $267 (52-week high)
Stop below $196 major support
Watch earnings in 28 days
List your thoughts below on the next move!

Zooming Out and In: AI-Powered Multi-Timeframe Mastery
You're Bullish on the 5-Minute Chart. You're Bearish on the Daily. Who's Right?
This conflict destroys more traders than bad entries ever will.
Multi-timeframe analysis isn't optional - it's the difference between trading with the current and swimming against it.
AI doesn't have the human limitation of only seeing one chart at a time. Here's how to think like the machine.
The Timeframe Hierarchy
The Principle:
Higher timeframes carry more weight than lower timeframes.
Why:
More data points = more statistical significance
Larger players operate on higher timeframes
Trends on higher timeframes persist longer
Lower timeframe noise gets filtered out
The Hierarchy:
Monthly → Macro Trend
Weekly → Swing Trend
Daily → Position Trend
4H → Swing Trade
1H → Day Trade
15M → Scalp
5M/1M → Noise
The Three-Timeframe Framework
Timeframe 1: Trend (Higher)
Purpose: Determine overall direction
What is the dominant trend?
Where are major support/resistance levels?
What's the big picture context?
Timeframe 2: Signal (Trading)
Purpose: Find entry opportunities
Where are setups forming?
What patterns are developing?
Where should entries be placed?
Timeframe 3: Execution (Lower)
Purpose: Optimize entry timing
Where is the precise entry?
What's the immediate momentum?
Where should the stop go?
Example Combinations:
Position Trading: Monthly → Weekly → Daily
Swing Trading: Weekly → Daily → 4H
Day Trading: Daily → 1H → 15M
Scalping: 4H → 15M → 5M
How AI Processes Multiple Timeframes
Human Limitation:
You can only look at one chart at a time. Switching between timeframes takes time and mental energy.
AI Advantage:
Processes all timeframes simultaneously, identifying:
Alignment (all timeframes agree)
Conflict (timeframes disagree)
Confluence (multiple signals at same price)
AI Multi-Timeframe Logic:
Calculate trend on TF1 (higher)
Calculate trend on TF2 (trading)
Calculate trend on TF3 (lower)
If all aligned: Signal strength = HIGH
If 2 of 3 aligned: Signal strength = MEDIUM
If conflicting: Signal strength = LOW or NO TRADE
Timeframe Alignment Signals
Full Alignment (Strongest)
Higher TF: Uptrend
Trading TF: Uptrend
Lower TF: Uptrend
Action: High-confidence long entries
Partial Alignment (Moderate)
Higher TF: Uptrend
Trading TF: Pullback in uptrend
Lower TF: Downtrend (temporary)
Action: Wait for lower TF to turn, then enter
Conflict (Weakest/No Trade)
Higher TF: Uptrend
Trading TF: Downtrend
Lower TF: Uptrend
Action: Wait for clarity or reduce size
Practical Multi-Timeframe Workflow
Step 1: Start High
Open your highest timeframe first.
What's the trend?
Where are key levels?
What's the context?
Step 2: Move to Trading Timeframe
Look for setups that align with higher TF.
Is there a pattern forming?
Does it align with higher TF direction?
Where would entry make sense?
Step 3: Drop to Execution Timeframe
Fine-tune your entry.
What's the immediate momentum?
Where's the optimal entry point?
Where should the stop go?
Step 4: Execute and Manage
Enter on lower TF, manage on trading TF.
Don't let lower TF noise shake you out
Use trading TF for trade management
Reference higher TF for overall thesis
Common Multi-Timeframe Mistakes
Fighting the Higher Timeframe — Taking shorts in a strong weekly uptrend because the 15M looks bearish. Higher timeframe wins. Trade with it, not against it.
Analysis Paralysis — Looking at so many timeframes that you never take a trade. Stick to three timeframes maximum.
Timeframe Hopping — Switching timeframes to justify a trade you want to take. Define your timeframes BEFORE looking at charts.
Managing on Wrong Timeframe — Entering on 1H, then panicking at every 5M candle. Manage trades on the timeframe you entered on.
Ignoring Timeframe Transitions — Not recognizing when higher TF trend is changing. Regularly check higher TF for trend health.
AI-Enhanced Multi-Timeframe Indicators
Concept 1: Trend Alignment Score
Single number showing alignment across timeframes.
Score = (TF1_trend × 3) + (TF2_trend × 2) + (TF3_trend × 1)
Where trend = +1 (up), 0 (neutral), -1 (down)
Max bullish = +6
Max bearish = -6
Concept 2: Multi-Timeframe Moving Average
Shows MA from higher timeframe on lower timeframe chart.
Application:
Daily 200 MA plotted on 1H chart
Provides context without switching charts
Concept 3: Timeframe Confluence Zones
Identifies price levels significant on multiple timeframes.
Application:
Support on daily AND weekly = stronger level
Resistance on 4H AND daily = more significant
Building Your Multi-Timeframe System
Define Your Timeframes:
Based on your trading style, select:
Trend timeframe (context)
Signal timeframe (setups)
Execution timeframe (entries)
Create Alignment Rules:
What constitutes "aligned"?
What do you do when conflicted?
How do you handle transitions?
Build Checklists:
Before Any Trade:
What's the higher TF trend?
Does trading TF setup align?
Is lower TF confirming entry?
During Trade:
Is higher TF thesis still valid?
Is trading TF structure intact?
Am I managing on correct TF?
Timeframe-Specific Characteristics
Monthly/Weekly:
Institutional positioning
Macro trends
Major support/resistance
Slow to change
Daily:
Swing trade setups
Clear trend structure
Key for most traders
Balances noise and signal
4H/1H:
Day trade setups
Intraday trends
More noise than daily
Faster signals
15M/5M:
Scalp entries
Execution timing
High noise
Requires quick decisions
1M:
Mostly noise
Only for precise execution
Not for analysis
Easy to overtrade
Key Takeaways
Higher timeframes carry more weight than lower timeframes
Use three timeframes: Trend (context), Signal (setups), Execution (entries)
Full alignment = strongest signals; conflict = wait or skip
AI can process all timeframes simultaneously — humans must be systematic
Manage trades on the timeframe you entered, not lower
Your Turn
What timeframes do you currently use in your trading?
Have you experienced the conflict of different timeframes showing opposite signals?
Share your multi-timeframe strategy below 👇

ATOM - +21% Weekly Rally at $1.16B | Tokenomics Redesign
Executive Summary
Cosmos (ATOM) market cap trading at $1.16B after a massive +21.17% weekly rally on the 4H timeframe. Price surged from $880M support to test $1.18B resistance. Major catalysts ahead: tokenomics redesign (Q1 2026), Solana/Ethereum L2 IBC integrations, and THORChain cross-chain swaps live. Strong momentum but approaching resistance.
BIAS: BULLISH - Strong Momentum, Watch Resistance
Current Market Data
Current: $1.16B (+0.33%)
Day's Range: $1.14B - $1.16B
52-Week: $803.29M - $2.8B
Volume: 63.52M (above 30D avg of 53.47M)
Performance:
1W: +21.17% | 1M: +7.14% | 3M: -39.69%
6M: -31.52% | YTD: +23.37% | 1Y: -59.76%
Key Catalysts
Tokenomics Redesign (Q1 2026) - Lower inflation, fee capture from appchains
IBC Integrations - Solana and Ethereum L2s connectivity coming
THORChain Cross-Chain Swaps - Native ATOM swaps live (no bridges)
CometBFT Upgrades - Targeting 10k+ TPS for enterprise
Enterprise Blockchain Fleet Manager - SWIFT, SMBC adoption potential
Stablecoin Surge - Cosmos Labs predicts new issuers in 2026
Technical Structure - 4H
Strong Uptrend:
Clean rally from $880M to $1.16B
Higher highs and higher lows
Now testing upper resistance at $1.18B
Volume above average - confirms momentum
Key Levels (Market Cap):
Resistance:
$1.16B - $1.18B - Current resistance zone
$1.20B - Psychological resistance
$1.40B+ - Extended bullish target
Support:
$1.10B - Immediate support
$1.00B - Psychological support
$880M - Major support (red line at bottom)
SCENARIO ANALYSIS
BULLISH: Breakout Above $1.18B
Trigger: Close above $1.18B with volume
Targets: $1.20B → $1.40B → $1.60B
Catalyst: Tokenomics redesign approval, IBC integrations
BEARISH: Rejection at Resistance
Rejection at $1.18B resistance
Pullback to $1.00B-$1.10B support
Healthy consolidation before next leg
My Assessment
Strong +21% weekly rally with volume confirmation. Approaching resistance at $1.18B. Major catalysts ahead: tokenomics redesign to lower inflation and capture fees, IBC integrations with Solana/ETH L2s, and enterprise adoption push. Bullish structure intact - watch for breakout or pullback to support.
Strategy:
Long on breakout above $1.18B → Target $1.20B, $1.40B
Or buy pullback to $1.00B-$1.10B support
Stop below $880M major support
Tell me your thoughts below!

AVAX - Rising Wedge at $14.12 | ETF Filings Spark +11% Rally
Executive Summary
Avalanche (AVAX) trading at $14.12 within a rising wedge on the 2H timeframe. Price surged +11% this week as institutional ETF filings sparked a rally. Now testing upper resistance with two scenarios: bullish breakout above $14.75 or pullback to $12.00-$12.75 support zone before continuation.
BIAS: NEUTRAL - Watching for Breakout or Pullback
Current Market Data
Current: $14.123 (-0.82%)
Day's Range: $14.033 - $14.516
52-Week: $9.013 - $44.575
Market Cap: $6.08B
24h Volume: $384.76M
Technical Rating: Neutral
Performance:
1W: +11.80% | 1M: +6.89% | 3M: -53.89%
6M: -23.09% | YTD: +14.80% | 1Y: -66.85%
Key Catalyst
Institutional ETF filings sparked +11% rally
AVAX among altcoins with ETF filing momentum
Fortune 100 companies expected to launch blockchains on Avalanche
Strong ecosystem for enterprise adoption
Technical Structure - 2H
Rising Wedge Pattern:
Rising support and resistance trendlines (yellow dashed)
Wedge narrowing toward apex
Can break either direction
Currently testing upper resistance
Key Levels:
Resistance:
$14.50 - $14.75 - Upper resistance / breakout level
$15.00 - Psychological resistance
$16.00+ - Extended bullish target
Support:
$14.00 - Immediate support
$12.75 - Upper support zone
$12.00 - $12.75 - Major support zone (purple)
$11.75 - Deep support (red line)
SCENARIO ANALYSIS
BULLISH: Breakout Above $14.75
Trigger: 2H close above $14.75 with volume
Targets: $15.00 → $16.00 → $18.00
Catalyst: ETF momentum continues
BEARISH: Pullback to Support Zone
Rejection at upper wedge resistance
Pullback to $12.00-$12.75 support zone
Healthy retest before continuation
Buy opportunity at support
My Assessment
Rising wedge at resistance after +11% ETF-driven rally. Two scenarios: breakout above $14.75 or pullback to $12.00-$12.75 support zone. ETF filings provide fundamental catalyst. Watch for confirmation before entry.
Strategy:
Long above $14.75 breakout → Target $15, $16, $18
Or wait for pullback to $12.00-$12.75 support
Long at support with stop below $11.75
Target $14.50+ on bounce
List your thoughts below!

MNQ - Range-Bound at 25,385 | Support Below, Resistance AboveExecutive Summary
Micro E-mini Nasdaq 100 futures (MNQ1!) trading at 25,385 in a range-bound consolidation on the 4H timeframe. Price rejected from the 25,900-26,000 resistance zone and is now testing lower levels. Multiple support zones below at 25,100-25,200 and 24,850-24,950. Watch for breakout direction from this consolidation range.
BIAS: NEUTRAL - Range-Bound Consolidation
Current Market Data
Current: 25,385.25 (-0.28%)
Day's Range: 25,265.25 - 25,803.50
52-Week: 16,452.50 - 26,399.50
Open Interest: 94.90K
Front Month: MNQH2026
Performance:
1W: -1.87% | 1M: -1.03% | 3M: +1.12%
6M: +10.52% | YTD: -0.29% | 1Y: +10.79%
Key Market Context
Mag 7 outperformed S&P 500 for 3rd straight year
MAG/SPX ratio showing smallest yearly rise in 3 years
Equal-weighted S&P 500 starting to outperform
January Barometer: As January goes, so goes the year (84% hit rate)
Santa Rally sputtering - weak footing into 2026
VIX subdued but could spike in Jan-Feb
Fed expected to pause at Jan 27-28 meeting (83% odds)
Technical Structure - 4H
Range-Bound Consolidation:
Price consolidating between support and resistance
Rejected from 25,900-26,000 resistance zone
Testing lower support zones
Watch for breakout direction
Key Levels:
Resistance:
25,800 - Day's high / immediate resistance
25,900 - 26,000 - Resistance zone (pink box)
26,260 - Upper resistance (red line)
26,399.50 - 52-WEEK HIGH
Support Zones (Purple):
25,100 - 25,200 - Upper support zone
24,850 - 24,950 - Lower support zone
24,850 - Major support (red line at bottom)
SCENARIO ANALYSIS
BULLISH: Break Above Resistance
Trigger: Break above 26,000 with volume
Targets: 26,260 → 26,399 (52-week high) → 26,500+
BEARISH: Test Support Zones
Price tests 25,100-25,200 first support
If fails, drops to 24,850-24,950
Break below 24,850 = bearish continuation
NEUTRAL: Range Continuation
Price oscillates between 24,850 - 26,000
Wait for breakout confirmation
Trade the range until breakout
My Assessment
Range-bound consolidation with clear support and resistance zones. Mag 7 momentum slowing, equal-weighted index gaining ground. Santa Rally weak - cautious into January. Watch support zones for bounce or breakdown.
Strategy:
Watch for bounce at 25,100-25,200 support
Long above 26,000 breakout → Target 26,260, 26,400
Short below 24,850 breakdown → Target 24,500, 24,000
Trade the range until breakout confirms
Comment your thoughts below!


USDT.D - Rising Wedge at 6.36% +47.73% YTD | Critical Crypto
Executive Summary
USDT Dominance is trading at 6.362% within a rising wedge pattern on the 4H timeframe. Up +47.73% YTD as investors rotated into stablecoins during crypto weakness. The rising wedge suggests potential bearish reversal (bullish for crypto), but the uptrend remains intact near the 52-week high of 6.749%.
BIAS: NEUTRAL - Rising Wedge at Resistance
WHY USDT.D MATTERS
USDT.D UP = Risk-off = BEARISH for crypto
USDT.D DOWN = Risk-on = BULLISH for crypto
Leading indicator for BTC, ETH, altcoins
Current Market Data
Current: 6.362% (+0.57%)
Day's Range: 6.270% - 6.399%
52-Week: 3.745% - 6.749%
Technical Rating: NEUTRAL
Performance:
1W: -0.26% | 1M: +4.67% | 3M: +44.84%
6M: +34.12% | YTD: +47.73% | 1Y: +46.90%
Stablecoin Market Context
Total stablecoin market: ~$300B (record high)
USDT: $187B (64% market share)
USDC: $76B (26% market share)
Dragonfly predicts USDT share drops to 55% in 2026
Stablecoin market expected to grow 60% in 2026
Technical Structure - 4H
Rising Wedge Pattern:
Yellow dashed trendlines forming wedge
Typically bearish reversal (70% break down)
Price compressing near apex
Breakdown = BULLISH for crypto
Key Levels:
Resistance:
6.45% - 6.55% - Upper resistance zone
6.749% - 52-WEEK HIGH
Support:
6.15% - 6.25% - Support zone / Breakdown level
5.80% - 5.95% - Major support zone
SCENARIO ANALYSIS
BEARISH USDT.D (Bullish for Crypto)
Trigger: Break below 6.15%
Targets: 6.00% → 5.80% → 5.50%
Implication: LONG crypto - risk-on rotation
BULLISH USDT.D (Bearish for Crypto)
Trigger: Break above 6.55%
Targets: 6.749% → 7.00% → 7.25%
Implication: Reduce crypto exposure - risk-off continues
My Assessment
Rising wedge at resistance suggests potential breakdown (bullish for crypto). However, +47.73% YTD momentum and risk-off sentiment could push higher. Wait for confirmation.
Strategy:
Breakdown below 6.15% = BULLISH for crypto
Breakout above 6.55% = BEARISH for crypto
Use as leading indicator for crypto trades
This is not financial advice.

DXY - Descending Wedge at 98.13 | -9.58% YTD
Executive Summary
The US Dollar Index (DXY) is trading at 98.130 on December 29, 2025, consolidating within a descending wedge pattern on the 2H timeframe. The Dollar is on track for its worst year since 2017 with -9.58% YTD losses, pressured by Fed rate cut expectations, dovish Fed Chair concerns, and Trump's tariff policies. However, a potential bullish reversal pattern is forming at the bottom of the wedge, with an ascending channel developing. FOMC minutes due Tuesday could be the catalyst for the next directional move.
BIAS: NEUTRAL - Watching for Breakout Direction
The Dollar is at a critical inflection point. The descending wedge suggests potential bullish reversal, but fundamental headwinds remain strong. Wait for confirmation before committing to a direction.
Current Market Context - December 29, 2025
DXY is consolidating near yearly lows:
Current Price: 98.130 (+0.08% on the day)
Day's Range: 97.915 - 98.177
52-Week Range: 96.218 - 110.176
52-Week High: 110.176
52-Week Low: 96.218
Technical Rating: SELL
Performance Metrics - MIXED:
1 Week: -0.54%
1 Month: -1.45%
3 Months: +0.22%
6 Months: +1.54%
YTD: -9.58%
1 Year: -9.21%
The Dollar is having its worst year since 2017, down nearly 10% YTD. Short-term metrics are mixed, but the longer-term trend is clearly bearish.
THE BEAR CASE - Dollar Weakness Continues
1. Fed Rate Cut Expectations
The Dollar continues to see underlying weakness as markets price in further rate cuts:
FOMC expected to cut rates by ~50 bp in 2026
Markets pricing 19% chance of -25 bp cut at January 27-28 meeting
Two rate cuts expected in 2026
Fed officials split on path forward - majority forecast single additional cut
Lower rates = weaker Dollar
2. Dovish Fed Chair Concerns
President Trump to announce new Fed Chair in early 2026
Kevin Hassett (National Economic Council Director) most likely choice
Hassett seen as most dovish candidate by markets
Trump wants next Fed chairman to lower rates
Dovish Fed Chair = bearish for Dollar
3. Fed Liquidity Injection
Fed began purchasing $40 billion/month in T-bills mid-December
Announced December 10 - $40 billion/month liquidity injection
Increased liquidity pressures Dollar lower
Quantitative easing-like effects
4. Interest Rate Differentials
FOMC expected to cut rates ~50 bp in 2026
BOJ expected to raise rates +25 bp in 2026
ECB expected to leave rates unchanged in 2026
Narrowing rate differentials = Dollar weakness
Yen strengthening on BOJ rate hike expectations
5. Trump Tariff Policies
Aggressive tariff policies pressuring Dollar
Threats to Fed independence
Trade tensions creating uncertainty
Dollar down nearly 10% YTD partly due to tariff concerns
6. Technical Rating: SELL
TradingView technicals gauge pointing toward "Sell"
Descending wedge pattern (bearish continuation possible)
Below major moving averages
Momentum indicators bearish
THE BULL CASE - Potential Reversal Forming
1. Descending Wedge Pattern (Bullish Reversal)
Descending wedge is typically a bullish reversal pattern
Price compressing at bottom of wedge
Ascending channel forming within wedge
Potential breakout to upside
Pattern suggests exhaustion of selling pressure
2. US Economic Data Still Solid
Q3 GDP came in at +4.3% - stronger than expected
Nov pending home sales rose +3.3% m/m (vs +0.9% expected)
Jobless claims unexpectedly fell
US businesses see employment growth at 4.32%
Revenue growth expectations at 3.83%
Strong data could limit Dollar weakness
3. Safe-Haven Demand
Stock market weakness boosting liquidity demand for Dollar
Geopolitical tensions (Venezuela blockade, ISIS strikes in Nigeria)
Ukraine-Russia peace deal uncertainty
Risk-off events could boost Dollar
4. Oversold Conditions
Dollar down -9.58% YTD - oversold
Mean reversion possible
Near 52-week low (96.218)
Potential for bounce
5. "US Exceptionalism" Positioning
BNY's Bob Savage: Rise above 98.15 could trigger momentum buying
"US exceptionalism positioning" could resurge
Dollar bulls waiting for catalyst
6. FOMC Minutes Catalyst
Fed minutes due Tuesday (December 30)
Could provide signals on rate cut timing
Hawkish surprise could boost Dollar
Key catalyst for next move
Technical Structure Analysis
Price Action Overview - 2 Hour Timeframe
The chart shows a complex structure with potential reversal forming:
Descending Wedge Pattern (Primary):
Clear descending wedge established from highs
Upper trendline: Falling resistance (connecting lower highs)
Lower trendline: Falling support (connecting lower lows)
Wedge narrowing - compression before breakout
Typically bullish reversal pattern
Price near apex of wedge
Ascending Channel (Secondary - Forming at Bottom):
Small ascending channel forming within wedge
Higher lows being established
Potential early reversal signal
Watch for breakout above wedge resistance
Key Zones Identified:
Upper resistance zone: ~99.25 (major resistance)
Secondary resistance: ~98.80
Current consolidation: 97.90-98.20
Support zone: ~97.85-98.00
Major support: ~97.25
52-Week Low: 96.218
Key Support and Resistance Levels
Resistance Levels:
98.177 - Day's high / immediate resistance
98.15 - BNY trigger level for momentum buying
98.80 - Secondary resistance zone
99.00 - Psychological resistance
99.25 - Major resistance zone
100.00 - MAJOR PSYCHOLOGICAL RESISTANCE
110.176 - 52-WEEK HIGH
Support Levels:
97.959 - Recent low
97.915 - Day's low / immediate support
97.85-98.00 - Support zone
97.50 - Secondary support
97.25 - Major support
96.50 - Deep support
96.218 - 52-WEEK LOW (critical)
Pattern Analysis
Descending Wedge Characteristics:
Pattern duration: Several weeks
Wedge narrowing toward apex
Volume typically decreases in wedge
Breakout direction: Usually bullish (70% of cases)
Target: Measured move = wedge height at breakout
Current position: Near bottom of wedge
Ascending Channel (Within Wedge):
Small ascending channel forming
Higher lows: Bullish sign
Could be early reversal signal
Watch for breakout above 98.80
Moving Average Analysis
Price trading below major moving averages
MAs sloping downward - bearish alignment
Short-term MAs below long-term MAs
Death cross patterns on longer timeframes
MAs providing dynamic resistance on rallies
SCENARIO ANALYSIS
BULLISH SCENARIO - Descending Wedge Breakout
Trigger Conditions:
2H close above 98.80 (wedge resistance)
Break above 99.00 psychological level
Volume confirmation on breakout
FOMC minutes hawkish surprise
Risk-off sentiment boosting Dollar
Price Targets if Bullish:
Target 1: 99.25 - Major resistance zone
Target 2: 100.00 - Psychological level
Target 3: 101.00-102.00 - Measured move target
Extended: 103.00+ (trend reversal)
Bullish Catalysts:
Descending wedge = bullish reversal pattern (70% breakout up)
Ascending channel forming at bottom
US economic data still solid (GDP +4.3%)
Oversold conditions (-9.58% YTD)
Safe-haven demand potential
FOMC minutes could be hawkish
"US exceptionalism" positioning could return
Mean reversion from extreme weakness
BEARISH SCENARIO - Wedge Breakdown / Continuation
Trigger Conditions:
Break below 97.25 major support
Close below 97.00
FOMC minutes dovish
Fed signals more aggressive rate cuts
Dovish Fed Chair announcement
Price Targets if Bearish:
Target 1: 97.25 - Major support
Target 2: 96.50 - Deep support
Target 3: 96.218 - 52-week low
Extended: 95.00-96.00 (new lows)
Bearish Catalysts:
-9.58% YTD - Worst year since 2017
Technical rating: SELL
Fed rate cuts expected (~50 bp in 2026)
Dovish Fed Chair concerns (Hassett)
Fed liquidity injection ($40B/month)
Interest rate differentials narrowing
Trump tariff policy uncertainty
Below major moving averages
NEUTRAL SCENARIO - Consolidation in Range
Most likely short-term outcome:
Price consolidates between 97.50-98.80
Thin holiday trading continues
Wait for FOMC minutes Tuesday
Wait for Fed Chair announcement
Wedge pattern continues to compress
Breakout direction unclear until catalyst
MY ASSESSMENT - NEUTRAL with Slight Bullish Bias
The evidence is mixed, but the technical pattern suggests potential reversal:
Bullish Factors:
Descending wedge = typically bullish reversal
Ascending channel forming at bottom
Oversold conditions (-9.58% YTD)
US economic data solid
Safe-haven demand potential
Near 52-week low (mean reversion)
Bearish Factors:
Technical rating: SELL
Fed rate cuts expected
Dovish Fed Chair concerns
Fed liquidity injection
Interest rate differentials narrowing
Below major moving averages
Worst year since 2017
My Stance: NEUTRAL - Wait for Confirmation
The descending wedge pattern suggests potential bullish reversal, but fundamental headwinds are strong. The Dollar could go either way from here. Wait for FOMC minutes and a clear breakout before committing.
Strategy:
Wait for breakout confirmation
Long above 98.80 with targets 99.25, 100.00
Short below 97.25 with targets 96.50, 96.218
Respect the wedge pattern
FOMC minutes Tuesday = key catalyst
Trade Framework
Scenario 1: Bullish Breakout Trade Above 98.80
Entry Conditions:
2H close above 98.80
Volume confirmation
Break above descending wedge resistance
Trade Parameters:
Entry: 98.85-99.00 on confirmed breakout
Stop Loss: 98.00 below recent support
Target 1: 99.25 (Risk-Reward ~1:0.5)
Target 2: 100.00 (Risk-Reward ~1:1.2)
Target 3: 101.00-102.00 (Measured move)
Scenario 2: Bearish Breakdown Trade Below 97.25
Entry Conditions:
2H close below 97.25
Volume confirmation
Break below major support
Trade Parameters:
Entry: 97.20-97.00 on confirmed breakdown
Stop Loss: 97.80 above recent resistance
Target 1: 96.50 (Risk-Reward ~1:1)
Target 2: 96.218 (52-week low)
Target 3: 95.50-96.00 (Extended)
Scenario 3: Range Trade (Neutral)
Entry Conditions:
Price bounces at 97.50-97.85 support
Bullish rejection candle
No breakout yet
Trade Parameters:
Entry: 97.50-97.85 at support
Stop Loss: 97.00 below major support
Target 1: 98.50 (Risk-Reward ~1:1)
Target 2: 98.80 (Wedge resistance)
Risk Management Guidelines
Position sizing: 1-2% max risk per trade
Wait for breakout confirmation
Thin holiday volumes = wider stops
FOMC minutes Tuesday = key catalyst
Don't anticipate breakout direction
Scale out at targets
Move stop to breakeven after first target
Watch for Fed Chair announcement
Invalidation Levels
Bullish thesis invalidated if:
Price closes below 96.218 (52-week low)
Descending wedge breaks down
Fed signals aggressive rate cuts
Dovish Fed Chair confirmed
Bearish thesis invalidated if:
Price closes above 99.25 (major resistance)
Descending wedge breaks up with volume
Fed signals no more rate cuts
Risk-off surge boosts Dollar
Key Events to Watch
FOMC Minutes - Tuesday, December 30
Fed Chair Announcement - Early 2026
Year-End Positioning - Through January 1
BOJ Policy Signals - January 23 meeting
ECB Policy - February 5 meeting
Conclusion
The US Dollar Index is at a critical inflection point, trading at 98.130 within a descending wedge pattern. The Dollar is on track for its worst year since 2017 with -9.58% YTD losses, but a potential bullish reversal pattern is forming.
The Numbers:
Current Price: 98.130
YTD Performance: -9.58%
1-Year Performance: -9.21%
52-Week High: 110.176
52-Week Low: 96.218
Technical Rating: SELL
Key Levels:
99.25 - Major resistance
98.80 - Wedge resistance / breakout level
98.13 - Current price
97.85-98.00 - Support zone
97.25 - Major support
96.218 - 52-WEEK LOW
The Setup:
Descending wedge pattern with ascending channel forming at bottom. Fundamentals are bearish (Fed rate cuts, dovish Fed Chair concerns), but technicals suggest potential reversal. FOMC minutes Tuesday could be the catalyst.
Strategy:
NEUTRAL stance - wait for confirmation
Long above 98.80, target 99.25, 100.00
Short below 97.25, target 96.50, 96.218
FOMC minutes Tuesday = key catalyst
Respect the pattern
The Dollar is at a crossroads. The descending wedge suggests potential bullish reversal, but fundamental headwinds remain strong. Wait for the breakout.

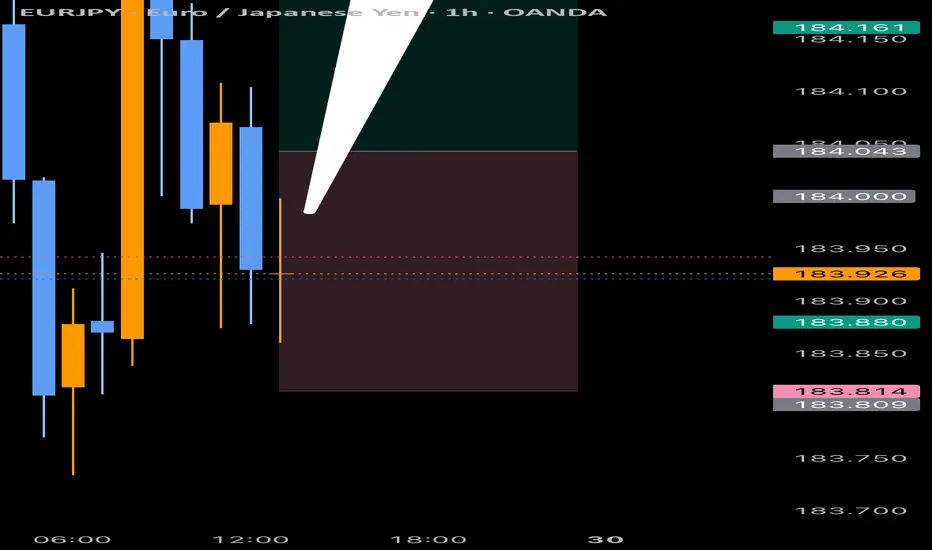
EURJPY 184+-185+Eurjpy Buy @ 184.100
TP1 : 184.160
TP2 : 184.222
TP3 : 184.300
TP4 : 184.400
SL : 183.710
Move stop loss to entry 50/50 required
Partials
BUY SIGNAL EURJPY 183.8+EURJPY BUY @ 183.808
TP1 : 183.900
TP2 : 183.999
TP3 : 184.000
TP4 : 184.050
SL : 183.400
Remember to trail stop and take partials

BUY STOP EURJPY 184+Buy stop , Eurjpy use proper techniques to manage your trades (50/50+Trial Stop)

EURJPY RECAPEURJPY has hit all time highs as expected and predicted and gave us a nice long super buy and new prices 184+ more still to come stay tuned and remember to follow to be able trade with us

BTC/ISD)Bullish trend analysis Read The captionSMC Trading point update
Technical analysis of BTCUSD – Daily (1D) chart using SMC + Fibonacci + EMA mean-reversion logic.
⸻
Market Context
• Higher-timeframe bias: Bullish (macro)
• Long-term structure still intact despite the pullback
• Current move down = deep corrective phase, not confirmed trend reversal yet
• Price is trading below EMA 50, but reacting near EMA 200 + HTF support
⸻
What Happened (Why BTC Dropped)
• Liquidity taken at the October high
• Sharp impulsive sell-off → distribution + stop-hunt
• Price retraced into a high-confluence discount zone
⸻
Key Demand / Accumulation Zone (Blue Area)
~85,000 – 92,000
This zone is important because it aligns with:
• Fib OTE zone (0.705 – 0.79)
• Previous daily demand
• Range low support
• Proximity to EMA 50 (93K) → mean reversion magnet
• Multiple long lower wicks → absorption
This suggests smart money accumulation, not panic selling.
⸻
Fibonacci Logic
Measured from major swing low → all-time high
• 0.5 & 0.62 → failed supports
• 0.705 – 0.79 → institutional rebalance zone
Textbook location for trend continuation buys
⸻
Trade Idea (Swing Long)
Buy on confirmation inside demand
• Entry: 86,000 – 90,000
• Stop Loss: Below demand (~82,000)
• Targets:
• TP1: 93,000 (EMA 50)
• TP2: 101,800 (EMA 200 / mid-range)
• Final TP: 121,000+ (marked target point / liquidity above highs)
RR potential: 1:4 to 1:6 (swing setup)
⸻
Confirmation Signals (Very Important on BTC)
Wait for at least one:
• Daily or 4H bullish engulfing
• Strong rejection wick from demand
• 4H CHoCH after sweep of lows
• Compression → expansion behavior
⸻
Invalidation
• Daily close below ~82,000
• Acceptance below demand with strong volume
If that happens → bullish swing idea is invalid, and market likely seeks lower HTF liquidity.
⸻ Mr SMC Trading point
Summary
This is a high-timeframe accumulation & continuation setup:
• Deep discount
• Fib OTE + demand
• EMA mean reversion
BTC rewards patience and HTF discipline — confirmation > prediction.
If you want, I can:
• Break this into a 4H / 1H execution plan
• Help you build a BTC-specific SMC swing model
• Or map bearish alternative scenarios for risk control
Please support boost this analysis

B T C U S D <•>BITCOIN Buy stop btcusd , bitcoin looking to give us another push up to correct itself,
TRADING STYLE : Scalp
SAFETY TIPS : (Trial Stop + Partial Close)

BULLS ON EURJPY Eurjpy will be correcting itself to the upside, a scalp can be done , however remember to ( 50/50 + close )
EXPECTED PRICE : 182.6+

BITCOIN MONEY FRIENDS Bitcoin has hit new highs in terms of price and structure it’s been good trading btcusd very easy , all required is patience

GOLD VIEW 1H READ THE CHAPTIAN Hello 👋 gold Traders
technical analysis of Gold (XAU/USD) on a 1-hour timeframe. Here’s a breakdown of the key elements:
1. Fair Value Gap (FVG Level): The purple zone represents an area of inefficiency where price may return to fill before continuing its trend.
2. Change of Character (CHOCH): Indicates a potential shift in market structure, suggesting bullish momentum.
3. Double Top (Red Arrows): Price was rejected twice at the same level, indicating possible resistance.
4. Moving Averages:
200 EMA (Blue Line at 2,901.507): Long-term trend indicator.
30 EMA (Red Line at 2,911.101): Short-term trend indicator.
5. Price Action Forecast:
Price is expected to retrace into the FVG level before continuing upwards toward the target point at 2,961.779.
This suggests a bullish outlook as long as price respects the FVG level as support. Would you like a more detailed breakdown
Don't forget boost 🚀 and follow don't miss more good idea 💡
