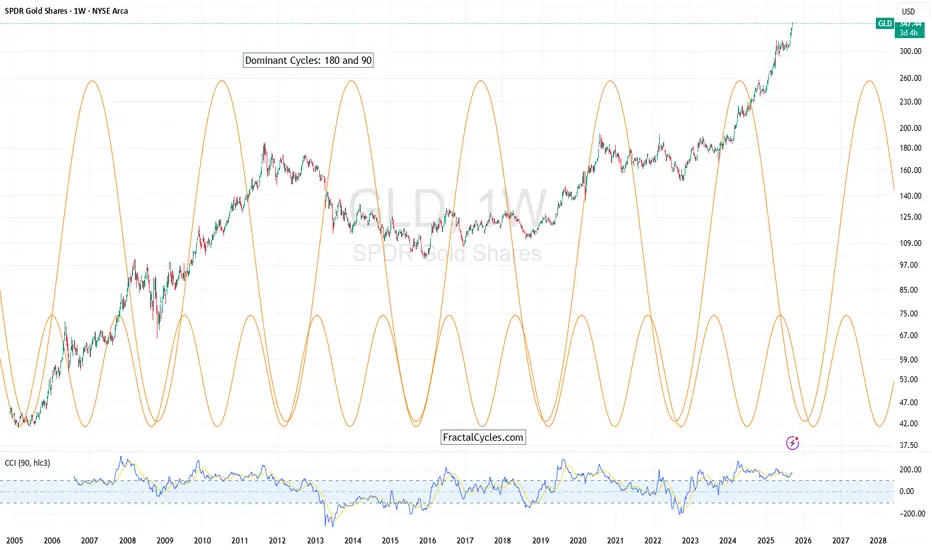
GLD Cycle Analysis – Dual Opportunities from 180 & 90-Week CycleThis chart highlights two dominant rhythms in GLD (SPDR Gold Shares):
The 180-week cycle, which has reliably pinpointed major long-term buy opportunities over the past two decades. Each time price has descended into these troughs, patient investors were rewarded with strong, multi-year rallies.
The 90-week cycle, nested within the larger one, has provided shorter-term opportunities for investors and swing traders. These mid-cycle lows often marked excellent entry points for those looking to capture medium-range gains without waiting for the full 180-week reset.
Takeaway:
Cycles matter - the 180-week rhythm has been the foundation for long-term positioning, while the 90-week cycle has created multiple shorter-range accumulation windows. Both have worked hand-in-hand to map gold’s path higher.
Fractalcycles
Bitcoin Cycle Analysis – The Fourth TurningThe dominant cycle identified here is ~292 bars, which has consistently marked major pivots in Bitcoin’s price action. Each cycle builds in intensity, and according to fractal theory, the fourth turning often delivers the most severe correction.
At present, BTC is pressing against the upper bounds of this dominant cycle. If the cycle roadmap continues to hold, we are now in the early stages of the declining phase, with downside risk extending into the mid-to-lower support zones.
Key Insight:
In fractal cycle analysis, the fourth turning is often the most devastating one. If this pattern repeats, the coming downswing could be sharper and deeper than previous declines, preparing the ground for the next major cycle low.
Caution is warranted as both fractal and cycle models are flashing warnings that this market may be in the process of topping out.

Bitcoin Cycles Update (4H Chart)BTC is tracking within a 175-bar cycle, and price is now in the later stage of the current cycle. After a bounce toward the 115k–116k zone, momentum looks to be stalling. The Stoch RSI is in overbought territory, hinting at cycle exhaustion.
If history repeats, we could see a corrective leg lower, with potential support in the 102k–106k range before the next cycle upswing develops.
In short: Cycle suggests we’re closer to a top than a bottom.
