EURUSD LONG ReboundEURUSD Rebound towards the 2h orderblock on 86% fibbonacci level and after the TP is reached, sell until 38.2 fibbonacci level on daily timeframe.
Freesignal

AUDCAD LONG Rebound AUDCAD Rebound towards the 61.8% fibbonacci level, moreover we have Bullish divergence on MACD and RSI.

CAD-CHF Free Signal! Sell!
Hello,Traders!
CAD-CHF has made some
Gains from the recent lows
Just as we expected but now
The pair is entering the
Horizontal resistance area
Around 0.6212 from where
We can enter a short trade
With the Take Profit of 0.6162
And the Stop Loss of 0.6233
Buy!
Comment and subscribe to help us grow!
Check out other forecasts below too!
Disclosure: I am part of Trade Nation's Influencer program and receive a monthly fee for using their TradingView charts in my analysis.

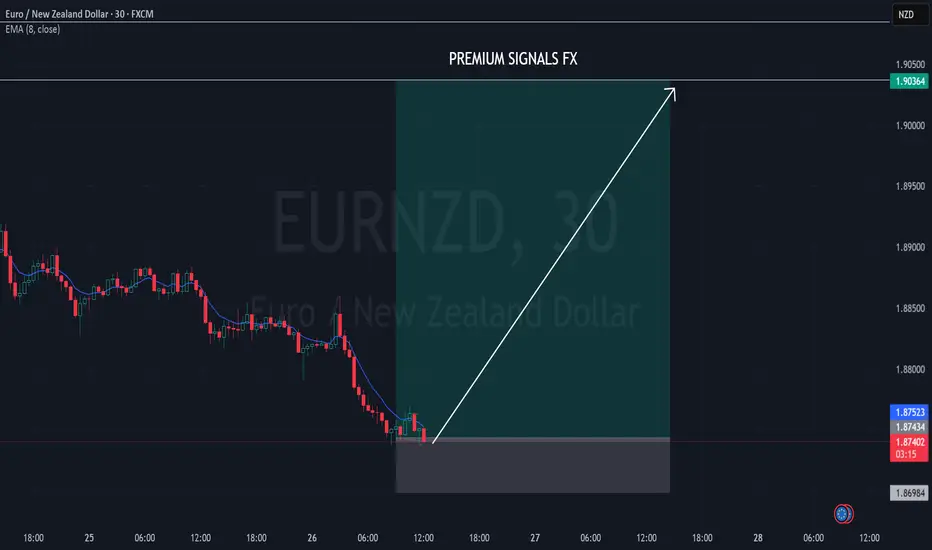
EURNZD LONG ReboundEURNZD Rebound, we have Bullish candlestick confirmation on 1h timeframe, moreover, the price jumped up from 0.86% fibbonacci level.
USDCHF SHORT 4h bearish confirmation USDCHF Sell until the 1h orderblock downside. We have Bearish confirmation on 4h timeframe.

GBPUSD LONG ReboundGBPUSD Rebound towards the 1h orderblock ( 86% fibbonacci level ) and after sell until the 38% fibbonacci level on daily timeframe.

GBPUSD SHORT Until the next 1h orderblockGBPUSD Short until the next 1h orderblock. We have Bearish divergence on MACD.

AUDUSD LONG ReboundAUDUSD Rebound, we have bullish confirmation, the price jumped up from the 1h orderblock.


AUDNZD LONG ReboundAUDNZD Rebound to the 60% fibbonacci level on daily timeframe. This is an entry against the trend. Moreover, we have Bullisgh divergence on RSI.

EURCHF LongHi Everyone,
Hope you are all well and enjoyed my gold signal that hit all TP's
Here is our EURCHF Signal. wait for the 15 minute candle to close above the entry, and then for price to respect the entry, then we can enter. Here are the numbers.
EURCHF Buy
📊Entry: 0.95727
⚠️Sl: 0.95176
✔️TP1: 0.96349
✔️TP2: 0.97141
✔️TP3: 0.98148
Stick to the rules
Hope you all earn lots of profit.
Best wishes,
Sarah

EURUSD TECHNICAL ANALYSIS FOCOUS ON KEY POINTS , EUR POSSIBLEhis chart is a technical analysis of the EUR/USD currency pair on a 1-hour timeframe, featuring several indicators and annotations. Here's a breakdown of what it means:
Key Features of the Chart:
Support & Resistance Levels:
The black horizontal lines indicate important support and resistance levels.
Support: Around 1.08739 (marked with a black line).
Resistance: Around 1.09491 (upper blue zone).
Fibonacci Circles:
The red and blue circular patterns in the middle of the chart suggest Fibonacci time and price levels.
These are used to predict potential reversal points or price movements.
Supply & Demand Zones:
Blue shaded areas indicate resistance (supply zones) where price previously reversed.
The price may react again when reaching these levels.
Candlestick Patterns & Trend Lines:
A previous rejection at the upper blue zone (left side) led to a strong downtrend.
The blue diagonal trendline suggests previous bullish momentum.
Forecasted Price Movement:
The blue arrow suggests an expected bullish move toward the 1.09491 resistance level.
The setup suggests a buy trade with a stop loss around 1.08931 and a target near 1.09491.
Conclusion:
This chart suggests a potential bullish move in EUR/USD, with an expected rise toward 1.09491 if it breaks the resistance near 1.09104. However, if it fails, it could drop back to the 1.08739 support level.
Would you like further analysis or clarification on any aspect? 🚀

USDCHF LONG reboundUSDCHF Rebound until 60% fibbocci level on daily timeframe. moreover the MACD created Bullish divergence and the RSI is oversold.

GBPUSD SELL RSI oveerboughtGBPUSD Sell until 8 EMA on daily timeframe, moreover, the RSI is overbought.

EURUSD SHORT Sell until 38.2% fibboEURUSD Sell until 38.2% fibbonacci level on daily timeframe. Moreover the RSI created Bearish divergence on H4 timeframe.

NZDUSD, SHORT Sell until the 38.2% fibbo dailyNZDUSD Sell until the 38.2% fibbonacci level on daily timeframe, moreover the RSI makes a bearish divergence and is overbought.

NZDUSD SHORT Sell until 38.2% fibbonacci levelNZDUSD, Sell until 38.2% fibbonacci level on daily timeframe. The RSI is overbought, moreover, we have bearish divergence on MACD.

BTCUSD SHORT RSI overboughtBTCUSD Sell until 81.195 $ where is the 1h orderblock. The RSI is overbought. Moreover, the price created rightside liquidity.

EURAUD, LONG rebound from the 8 EMAEURAUD, Rebound from the 8 EMA to the 1h orderblock and after that i expect a downside to the 38.2% fibbonacci level on daily timeframe.

AUDCAD LONG Rebound from 1h orderblockAUDCAD Rebound from the 1h orderblock into the next 1h orderblock upside. The RSI is oversold.

USDCHF LONG rebound until level 60% fibbonacciUSDCHF, Rebound until level 60% fibbonacci on daily timeframe, this entry is against the trend.
