Q3 | W39 | D26 | Y25| Fun Coupon Fri -AUDUSD Daily Forecast📅 Q3 | W39 | D26 | Y25|
📊 AUDUSD Daily Forecast
Fun Coupon Fri
🔍 Analysis Approach:
I’m applying Smart Money Concepts, focusing on:
Identifying Points of Interest on the Higher Time Frames (HTFs) 🕰️
Using those POIs to define a clear trading range 📐
Refining those zones on Lower Time Frames (LTFs) 🔎
Waiting for a Break of Structure (BoS) for confirmation ✅
This method allows me to stay precise, disciplined, and aligned with the market narrative, rather than chasing price.
💡 My Motto:
"Capital management, discipline, and consistency in your trading edge."
A positive risk-to-reward ratio, paired with a high win rate, is the backbone of any solid trading plan 📈🔐
⚠️ Losses?
They’re part of the mathematical game of trading 🎲
They don’t define you — they’re necessary, they happen, and we move forward 📊➡️
🙏 I appreciate you taking the time to review my Daily Forecast.
Stay sharp, stay consistent, and protect your capital
— FRNGT 🚀
FX:AUDUSD
Freesignals

AUDUSD Daily Forecast -Q3 | W39 | D25 | Y25|
📅 Q3 | W39 | D25 | Y25|
📊 AUDUSD Daily Forecast
🔍 Analysis Approach:
I’m applying Smart Money Concepts, focusing on:
Identifying Points of Interest on the Higher Time Frames (HTFs) 🕰️
Using those POIs to define a clear trading range 📐
Refining those zones on Lower Time Frames (LTFs) 🔎
Waiting for a Break of Structure (BoS) for confirmation ✅
This method allows me to stay precise, disciplined, and aligned with the market narrative, rather than chasing price.
💡 My Motto:
"Capital management, discipline, and consistency in your trading edge."
A positive risk-to-reward ratio, paired with a high win rate, is the backbone of any solid trading plan 📈🔐
⚠️ Losses?
They’re part of the mathematical game of trading 🎲
They don’t define you — they’re necessary, they happen, and we move forward 📊➡️
🙏 I appreciate you taking the time to review my Daily Forecast.
Stay sharp, stay consistent, and protect your capital
— FRNGT 🚀
FX:AUDUSD

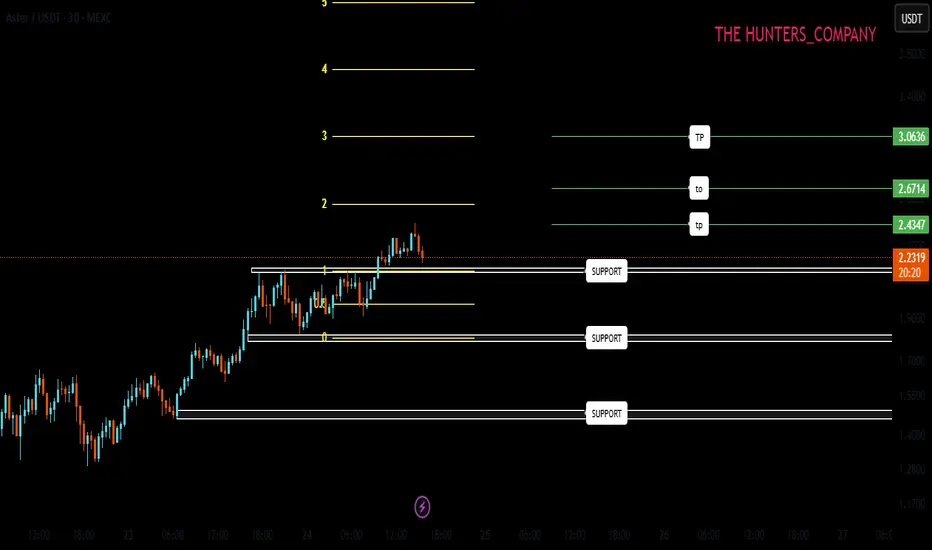
ASTER analysisHello friends
Given the upward trend of the market, we can expect a resurgence in the price during pullbacks.
Now we have identified 3 support areas that can support the price and if the price is supported, it can move to the specified targets.
*Trade safely with us*
AVAXUSDT ; Did the buyers arrive?Hello friends
You see that the price has created a channel and broken it and has had a good growth and has created a channel again that buyers support. Still, and considering the sharp movement that we are seeing, it seems that the price can break this channel.
If it fails to break the channel in the first encounter, it can move to the specified support areas and then grow.
If the channel is broken, the price can move to the specified targets.
*Trade safely with us*

WLFI (SIGNAL)
Hello friends
Regarding the price flooring in the specified support area and the creation of higher floors, it can be said that if the specified resistance is broken, the price can move to the specified targets.
*Trade safely with us*

AUDUSD BUY LIMIT FULL BREAKDOWN -Q3 | W39 | D22 | Y25|
Q3 | W39 | D22 | Y25|
📊 AUDUSD BUY LIMIT FULL BREAKDOWN
🔍 Analysis Approach:
I’m applying Smart Money Concepts, focusing on:
Identifying Points of Interest on the Higher Time Frames (HTFs) 🕰️
Using those POIs to define a clear trading range 📐
Refining those zones on Lower Time Frames (LTFs) 🔎
Waiting for a Break of Structure (BoS) for confirmation ✅
This method allows me to stay precise, disciplined, and aligned with the market narrative, rather than chasing price.
💡 My Motto:
"Capital management, discipline, and consistency in your trading edge."
A positive risk-to-reward ratio, paired with a high win rate, is the backbone of any solid trading plan 📈🔐
⚠️ Losses?
They’re part of the mathematical game of trading 🎲
They don’t define you — they’re necessary, they happen, and we move forward 📊➡️
🙏 I appreciate you taking the time to review my Daily Forecast.
Stay sharp, stay consistent, and protect your capital
— FRNGT 🚀
FX:AUDUSD

ADA/USDT; FREE SIGNALHello friends
According to the market cycle, you can see that every time after the price growth we had a correction and now it seems that the price wants to exit the correction and have a new growth. If the support levels continue, the price can move to the specified targets.
*Trade safely with us*

PEPE; FREE SIGNAL!!!Hello friends
Given the buyers' support for the price and the downtrend breakdown, if the two specified supports are maintained, the price can move to the specified targets.
*Trade safely with us*

Designated buying and selling points...Hello friends
Well, you see that we had a downward trend and once the price reached the specified resistance, but it was not valid and the price fell further to the point where we specified the support with Fibonacci for you and from there the price was supported and the resistance was broken, causing the price to grow.
Now that the price has grown well and was able to break the specified resistance, a good opportunity has been provided for us to buy in stages and with capital and risk management.
And we move with it to the resistance areas marked with Fibonacci.
*Trade safely with us*

TRUMP ; Should we buy Trump currency ?Hello friends
Well, as you know, you are taking a high risk to buy this currency, but as you can see, the price has been compressed for some time and there is a resistance that does not allow the price to grow, and after each time the price hits it, we have witnessed a price correction.
Now, if the resistance breaks, the price can see the specified targets.
*Trade safely with us*

PENGU (FREE SIGNAL)Hello friends
Given the price decline, it can now be said that sellers are gradually weakening and weakness is occurring in the trend. Given the failure to confirm the rise of 3 support areas, we have determined that the price can be well supported in these areas and if supported, it can move to the specified targets.
*Trade safely with us*

FTT BUY!!!Hello friends
According to the market cycle that has been drawn for you, from here according to the cycle we expect a return to the ceiling.
*Trade safely with us*

EURGBP Daily Forecast -Q3 | W38 | D19 | Y25| 📅 Q3 | W38 | D19 | Y25|
📊 EURGBP Daily Forecast
🔍 Analysis Approach:
I’m applying Smart Money Concepts, focusing on:
Identifying Points of Interest on the Higher Time Frames (HTFs) 🕰️
Using those POIs to define a clear trading range 📐
Refining those zones on Lower Time Frames (LTFs) 🔎
Waiting for a Break of Structure (BoS) for confirmation ✅
This method allows me to stay precise, disciplined, and aligned with the market narrative, rather than chasing price.
💡 My Motto:
"Capital management, discipline, and consistency in your trading edge."
A positive risk-to-reward ratio, paired with a high win rate, is the backbone of any solid trading plan 📈🔐
⚠️ Losses?
They’re part of the mathematical game of trading 🎲
They don’t define you — they’re necessary, they happen, and we move forward 📊➡️
🙏 I appreciate you taking the time to review my Daily Forecast.
Stay sharp, stay consistent, and protect your capital
— FRNGT 🚀
FX:EURGBP

ETH UPDATEHello friends
Well, you can see that due to the bearish market cycle, the downward steps have gradually become smaller and we have hit a higher ceiling at the specified support, which is a sign of a weak trend or price flooring. If this specified price floor is maintained, the price can move to the specified targets.
*Trade safely with us*

BITCOIN UPDATEHello friends
According to the open cycle, we can say that our trend is bullish and is in a channel, but a resistance has stopped it, which it has hit twice. Now we have to see if this resistance will finally be broken or if the price will continue to suffer below this resistance.
If the price breaks the resistance, it will move to the specified targets.
Trade safely with us.

C / UsdtBINANCE:CUSDT
“Every call smashed 50–100% gains 💎
🚀 Next up: $C is ready to print for us 🔥📈”
Disclaimer : Not Financial Advice..

BULLS ON EURJPY Bulls seem to be regaining momentum and will lead us into a new high as the pressure causes price to increase, 174.000 is our new prove of interest in the overall trend

EURJPY LONGEurjoy looking clean for a good chance of buying ,and staying there for a while as there’s some really cool fresh new highs that go along and correlate with our price structure

PEPE UPDATEHello friends
considering the decline we had, we seem to have a buying volume, but it is not yet fully confirmed and we must wait for the support or resistance to break. The targets are specified.
*Trade safely with us*

ETHUSDT.PHello friends
Given the good growth we had, the price has made a 14% correction. If the specified support is maintained, the price can see the specified targets. If the support is broken, the price can fall by another step. We have identified important support points for you.
*Trade safely with us*

VELVET : RISKY BUSINESSHello friends🙌
✅According to the movement logs that this currency has formed, it shows the high purchasing power of buyers and we can also buy in stages during price corrections with risk and capital management and move with it to the specified goals.
🔥Follow us for more signals🔥
*Trade safely with us*

Let me tell you where the important support and resistance are.Hello friends
Given the positive price trend last week, we see that the closer the trend approaches its important resistances, the weaker it becomes, and the more likely the price will correct from these resistances.
If the price corrects from the specified resistances, the price can move to the specified targets, and we also have a good support area below that we expect buyers to support.
*Trade safely with us*

PEPE : Important and influential resistance supportHello friends
Given the decline we had, we now have an important resistance that is key to the price's rise, and if it is broken, the price can move to the specified targets.
The second scenario is that the specified support is an important support that we obtained with Fibonacci, which can be an important support area for the price in case of further decline.
*Trade safely with us*
