SOL : I want to shop in these areas.Hello friends
Well friends, after a few hunts for the channel, the buyers finally broke the channel and the task was clear.
Now, with the price growth and correction we had in the areas identified as channel price pivots, I want to buy and move with it to the specified targets.
*Trade safely with us*
Freesignals

XRP *UPDATE*Hello friends
After the drop we had, the price was supported by buyers in the support area marked with Fibonacci and is now near an important resistance that if this resistance is broken, the price can grow to the specified limits.
The specified support areas are good points where you can buy in steps and with risk capital management.
*Trade safely with us*

ADA : BUY OR SELL?Hello friends
Well, after the decline we had, the price was able to create a small channel in the specified support area, which indicates the accumulation of the price, and if the support is maintained and the channel is broken, the price can move to the specified targets.
Otherwise, and if the support is broken, the decline will continue with a valid formation...
*Trade safely with us*

DOGE IN SHORT TIME Hello friends
After the good growth we had, you can see that the price has dropped the same amount and has not broken the support range validly, and it just wanted to collect the liquidity below this support and then formed an ascending channel, which if the price channel breaks, can move to the specified targets.
*Trade safely with us*

CRV : Will suffering be broken?Hello friends
Well, after reaching a resistance and hitting a higher ceiling, the price has fallen in the two movement logs that we have specified for you.
Now the price has been compressed in a support area and we have to wait for it to move to the specified targets if this range is broken.
*Trade safely with us*

BTC : LIVE TRADE!!!Hello friends
Well, you can see that in the support indicated by Fibonacci that we have obtained for you, the price has been well supported from the 3rd step of Fibonacci and currently the price is involved in the resistance indicated that if this resistance is broken, the price can move to the specified targets.
Don't forget risk and capital management.
*Trade safely with us*

GBPJPY : IMPORTANTHello friends
You can see that the downward waves are getting longer and the upward waves are getting shorter, which indicates the strength of the sellers, and a triangle has also formed, which compresses the price and can, in the event of a valid failure, go down another downward step, which will become a continuation triangle.
Don't forget risk and capital management.
*Trade safely with us*

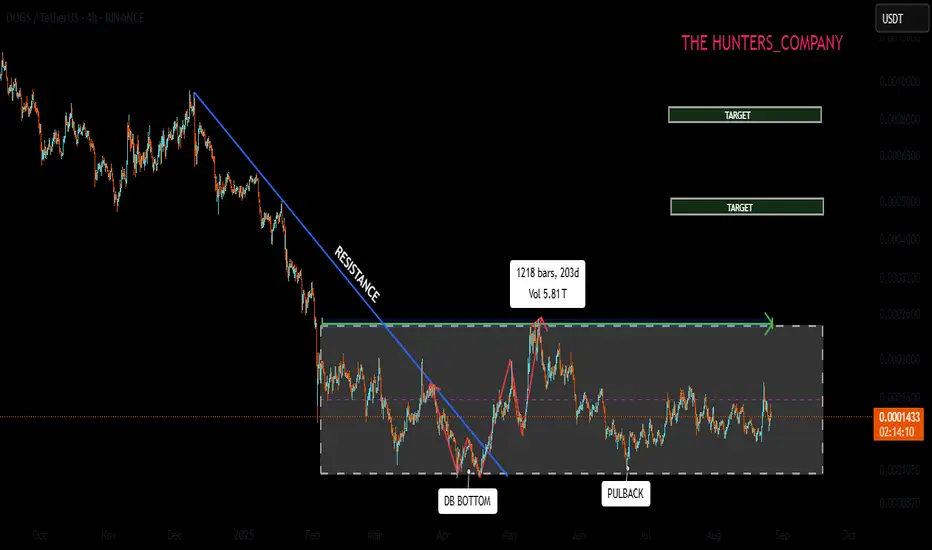
DOGS SIGNALHello friends
Given the decline we had, the price has been trading in a range for a long time in a support area.
You can see that once the buyers attacked the ceiling of the range, but they were met with a reaction from the sellers and the price could not break the range and fell to the bottom of the range. Now that the buyers are raising the price again, it remains to be seen whether they can break the ceiling of the range, which is also an important resistance, or not?
If they manage to break the range, the price can move to the specified ranges.
*Trade safely with us*
PEPE : GOOD POINTHello friends
Given the good growth we had, the price has now corrected and is in a good support area.
I think if this range is maintained, the price will grow to the specified targets.
*Trade safely with us*

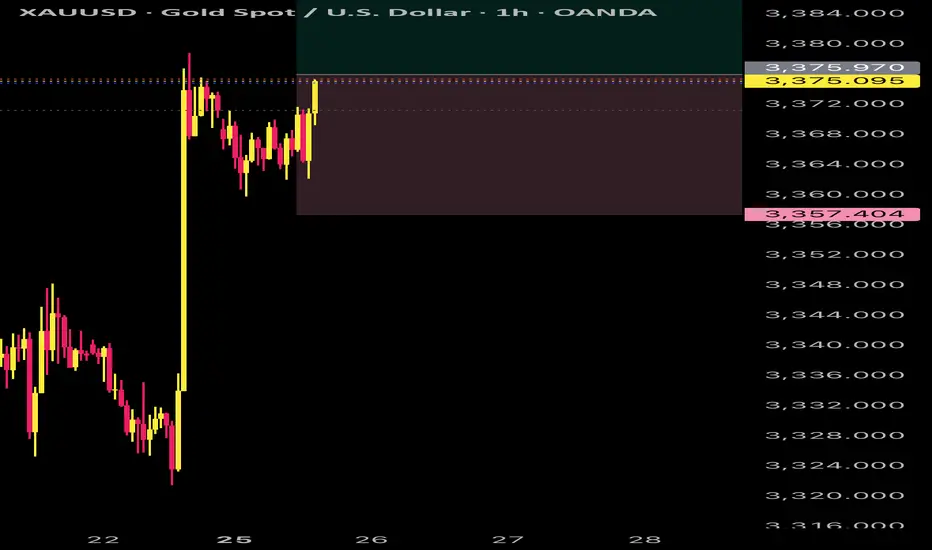
Gold Update – Correction Complete, Acceleration Ahead?1. Yesterday’s setup
In yesterday’s update, after reviewing Gold in other currencies and concluding the bigger picture remains bullish, I pointed out that on XAUUSD a correction was normal after Friday’s huge rise. I highlighted the 3350 zone as the level where bulls should look for opportunities.
2. What happened overnight
Overnight, Gold delivered exactly that: a violent drop into 3350, immediately followed by an even more violent reversal that erased the move and spiked price up to 3385.
3. Current situation
At the time of writing, XAUUSD is trading around 3375. With the 3350 low now in place, we can reasonably consider the correction complete.
4. Key levels ahead
For a true bullish confirmation, clearing the 3380–3390 zone is essential . If this breakout occurs, I believe the 3400 level won’t act as much of a resistance, but rather as a point of upward acceleration.
5. Trading plan
My bullish view is unchanged. Buying dips against 3350 remains the strategy. For targets, a reasonable objective — if 3380–3390 gives way — is the 3450 zone.
6. Final note
Gold has shown its hand: buyers are here, defending the key level. Now it’s about confirmation above resistance — once that happens, momentum could take us higher, faster. 🚀
Disclosure: I am part of TradeNation's Influencer program and receive a monthly fee for using their TradingView charts in my analyses and educational articles.

GOLD BUY XAUUSD Gold buy , gold looking good with potential to the upside and complete its trend will keep following it and keeping it simple
EURJPY QUICK TRADE Will be trading this pair and wait for it to give profits with minimum drawdown , always remember to close partials

Resistance is broken!!!Hello friends
it is clear that we have a downtrend and in this downtrend we have an important resistance that we have identified for you and given the strength of the sellers, the price has not yet managed to break this resistance.
We also found important support points with Fibonacci (which has now become resistance) that the price reacted to once and still could not break its resistance. However, if this resistance is broken, the specified Fibonacci steps, which are also resistance, can be our target and the price can move to these resistances, of course, if the support is maintained and the specified resistance is broken. Observe risk and capital management.
*Trade safely with us*

Interesting projectHello friends
you can see that the price is in a sensitive area and if the support is maintained and the first resistance is broken, the price can move to the next resistances. Of course, keep in mind that there is a possibility of a price correction when reaching each resistance, so don't forget to save your profit.
If the support area is broken and the price drops, we have identified an important support with Fibonacci, which means that the probability of price support by buyers in that area is high.
Observe risk and capital management.
*Trade safely with us*

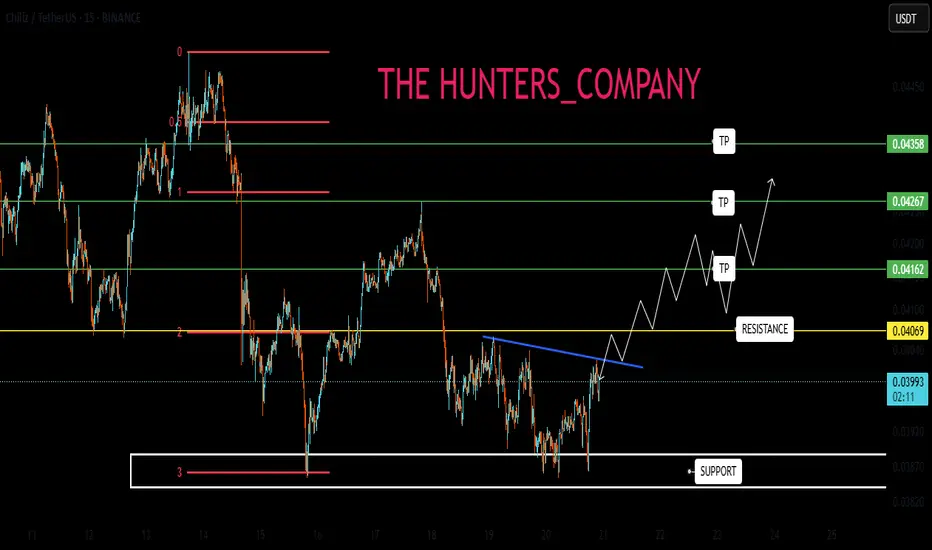
CHZ : BUY OR SELL? Hello friends
According to the price drop, you can see that the price is in the support area specified by the buyers. The specified support is also specified with Fibonacci, which is from our own strategy.
Now, if the support is held and the specified resistance is broken, the price can move to the specified targets. Don't forget risk and capital management.
*Trade safely with us*
APT : LIVE TRADEHello friends
According to the price drop, you can see that the price has rounded the specified support area, which indicates a change in trend, and after that we saw the resistance broken by the buyers, now in case of a pullback to the specified resistance, we can enter the transaction with risk and capital management.
The targets have also been specified.
*Trade safely with us*

Will Ethereum and Altcoins Continue to Grow?Hello friends
You see the Bitcoin to Ethereum chart.
You may be wondering what caused Ethereum to grow. I should tell you that this chart shows us what happened.
The price is in a downtrend, which indicates a money movement (from Bitcoin to Ethereum).
When you see that after 3 hits to support, the price has managed to break the support and the price has fallen and formed a downward channel, which could indicate that Ethereum's growth is continuing.
So now we have identified the support areas for you using Fibonacci, based on the price range that has formed.
The price is now at an important support area, as you can see, we had a bullish reaction when we hit the support area, but the price reversed due to the strength of the downtrend...
Now, if the support area breaks, the price can move lower to the specified targets.
Keep in mind that if the price grows, the upper support areas that were broken now become resistance and the price must be able to break them for our trend to be bullish, but as long as the price is down, the upward trend of Ethereum will continue and the upward trend of Ethereum will also make the altcoins bullish...
*Trade safely with us*

SEI : LIVE TRADEHello friends
We drew a Fibonacci to get the support area and a Fibonacci for the resistance areas.
Now using support and resistance we can understand where the buy and sell points are.
In this price growth we wait for a pullback and in case of a pullback we can enter a trade in the specified area with risk and capital management and move with it until the specified resistances which are targets.
*Trade safely with us*

Dark / UsdtGATEIO:DARKUSDT
Dark holding it's support area It will explode soon.
Disclaimer : Not financial advice..
DLong


EURGBP – DAILY FORECAST Q3 | W34 | D22 | Y25📊 EURGBP – DAILY FORECAST
Q3 | W34 | D22 | Y25
Daily Forecast 🔍📅
Here’s a short diagnosis of the current chart setup 🧠📈
Higher time frame order blocks have been identified — these are our patient points of interest 🎯🧭.
It’s crucial to wait for a confirmed break of structure 🧱✅ before forming a directional bias.
This keeps us disciplined and aligned with what price action is truly telling us.
📈 Risk Management Protocols
🔑 Core principles:
Max 1% risk per trade
Only execute at pre-identified levels
Use alerts, not emotion
Stick to your RR plan — minimum 1:2
🧠 You’re not paid for how many trades you take, you’re paid for how well you manage risk.
🧠 Weekly FRGNT Insight
"Trade what the market gives, not what your ego wants."
Stay mechanical. Stay focused. Let the probabilities work.
FX:EURGBP

HODL BASKETHello friends
You see the Trump meme coin on the weekly time frame that has an important resistance and a good support.
Now, to buy this currency, we must wait for a valid break of the resistance and then the price can move to the specified targets.
Note that the specified support is very important and for the price to rise, both the support and the resistance need to be maintained.
Be sure to observe risk and capital management.
*Trade safely with us*

HODL BASKETHello friends
You see the meme coin Natcoin on the weekly time frame that has an important resistance and a good support.
Now, to buy this currency, we must wait for a valid break of the resistance and then the price can move to the specified targets.
Note that the specified support is very important and for the price to rise, both the support and the resistance need to be maintained.
Be sure to observe risk and capital management.
*Trade safely with us*
