EURUSD FRGNT DAILY CHART FORECAST - Q1 | D5 | W1 | Y26📅 Q1 | D5 | W1 | Y26
📊 EURUSD — FRGNT DAILY CHART FORECAST
🔍 Analysis Approach
I’m applying a developed version of Smart Money Concepts, with a structured focus on:
• Identifying Key Points of Interest (POIs) on Higher Time Frames (HTFs) 🕰️
• Using those POIs to define a clear and controlled trading range 📐
• Refining those zones on Lower Time Frames (LTFs) 🔎
• Waiting for a Break of Structure (BoS) as confirmation ✅
This process keeps me precise, disciplined, and aligned with market narrative, rather than reacting emotionally or chasing price.
💡 My Motto
“Capital management, discipline, and consistency in your trading edge.”
A positive risk-to-reward ratio, combined with a high-probability execution model, is the backbone of any sustainable trading plan 📈🔐
⚠️ On Losses
Losses are part of the mathematical reality of trading 🎲
They don’t define you — they are necessary, expected, and managed.
We acknowledge them, learn, and move forward 📊➡️
🙏 I appreciate you taking the time to review my Daily Forecast.
Further context and supporting material can be found in the Links section.
Stay sharp 🧠
Stay consistent 🎯
Protect your capital 🔐
— FRGNT 🚀📈🔥
VISIT WWW.FRGNTFOREX.COM FOR MORE !
FX:EURUSD
Freesignals

DXY — FRGNT DAILY CHART FORECAST - Q1 | D5 | W1 | Y26📅 Q1 | D5 | W1 | Y26
📊 DXY — FRGNT DAILY CHART FORECAST
🔍 Analysis Approach
I’m applying a developed version of Smart Money Concepts, with a structured focus on:
• Identifying Key Points of Interest (POIs) on Higher Time Frames (HTFs) 🕰️
• Using those POIs to define a clear and controlled trading range 📐
• Refining those zones on Lower Time Frames (LTFs) 🔎
• Waiting for a Break of Structure (BoS) as confirmation ✅
This process keeps me precise, disciplined, and aligned with market narrative, rather than reacting emotionally or chasing price.
💡 My Motto
“Capital management, discipline, and consistency in your trading edge.”
A positive risk-to-reward ratio, combined with a high-probability execution model, is the backbone of any sustainable trading plan 📈🔐
⚠️ On Losses
Losses are part of the mathematical reality of trading 🎲
They don’t define you — they are necessary, expected, and managed.
We acknowledge them, learn, and move forward 📊➡️
🙏 I appreciate you taking the time to review my Daily Forecast.
Further context and supporting material can be found in the Links section.
Stay sharp 🧠
Stay consistent 🎯
Protect your capital 🔐
— FRGNT 🚀📈🔥
VISIT WWW.FRGNTFOREX.COM FOR MORE !

BUY STOP EURJPY Buy reversal towards the upside price
Eurjpy buy @ 183.8+
TP1: 183.888
TP2:183.933
TP3: 183.988
TP4 :184.040
SL - 183.390

BUY EURJPY 183.8+Eurjpy hit last SL due to it being too tight hang in there we have another trade with potential to the upside for a price reversal and continue with the direction of the week

Rvv/UsdtBINANCE:RVVUSDT.P
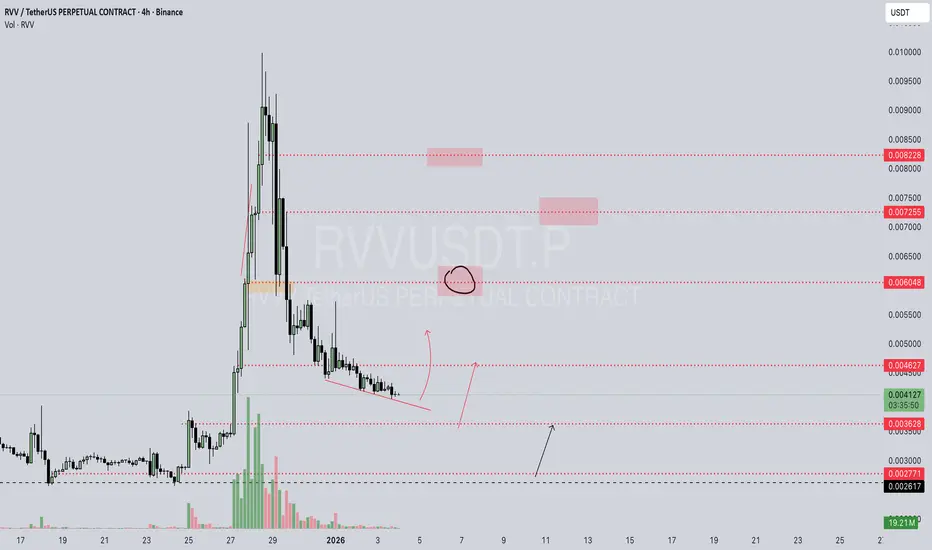
**RVV / USDT (Perpetual)**
🔴 **Key Resistance Zones** at **0.006048 🚫**, then higher at **0.007255 ⛔** and **0.008228 🧱**
🟢 **Major Support Levels** at **0.004627 🛡️**, followed by **0.003628 ⚠️** and **0.002771 🆘**
📉 Price is **grinding lower in a descending structure**, showing weak demand.
🎯 A **relief bounce** could revisit **0.004627 → 0.006048** if buyers step in.
⚠️ If **0.004627 fails**, downside may extend toward **0.003628** and potentially **0.002771**.
⚡ **Quick Take:**
* Overall trend remains **bearish 📉**
* Price is **compressing near support 🧊**
* Any upside likely a **pullback unless structure breaks 🔓**
* Volume is declining, suggesting **wait-for-confirmation mode 📊**
**Disclaimer:** *For educational purposes only 📚 — not financial advice 💡. Always do your own research and manage risk ⚠️.*
Q1 | W2 | Y26 EURGBP — FRGNT WEEK AHEAD FORECAST📅 Q1 | W2 | Y26
📊 EURGBP — FRGNT WEEK AHEAD FORECAST
🔍 Analysis Approach
I’m applying a developed version of Smart Money Concepts, with a structured focus on:
• Identifying Key Points of Interest (POIs) on Higher Time Frames (HTFs) 🕰️
• Using those POIs to define a clear and controlled trading range 📐
• Refining those zones on Lower Time Frames (LTFs) 🔎
• Waiting for a Break of Structure (BoS) as confirmation ✅
This process keeps me precise, disciplined, and aligned with market narrative, rather than reacting emotionally or chasing price.
💡 My Motto
“Capital management, discipline, and consistency in your trading edge.”
A positive risk-to-reward ratio, combined with a high-probability execution model, is the backbone of any sustainable trading plan 📈🔐
⚠️ On Losses
Losses are part of the mathematical reality of trading 🎲
They don’t define you — they are necessary, expected, and managed.
We acknowledge them, learn, and move forward 📊➡️
🙏 I appreciate you taking the time to review my Daily Forecast.
Further context and supporting material can be found in the Links section.
Stay sharp 🧠
Stay consistent 🎯
Protect your capital 🔐
— FRGNT MASTERY 🚀📈
FX:EURGBP

ADAUSDT the 0.33 to 0.66 is easy now ADA is currently trading at the $0.33 level following a notable decline. This zone may now represent a potential reversal area, with the next key technical target positioned near $0.66—a 100% appreciation from current levels.
For this bullish scenario to materialize, confirmation through price action and volume is required. A sustained move above near-term resistance with increasing buying volume would signal a reversal in momentum and could mark the beginning of a new upward phase.
DISCLAIMER: ((trade based on your own decision))
<<press like👍 if you enjoy💚

Q1 | W2 | Y26 DXY — FRGNT WEEK AHEAD FORECAST📅 Q1 | W2 | Y26
📊 DXY — FRGNT WEEK AHEAD FORECAST
🔍 Analysis Approach
I’m applying a developed version of Smart Money Concepts, with a structured focus on:
• Identifying Key Points of Interest (POIs) on Higher Time Frames (HTFs) 🕰️
• Using those POIs to define a clear and controlled trading range 📐
• Refining those zones on Lower Time Frames (LTFs) 🔎
• Waiting for a Break of Structure (BoS) as confirmation ✅
This process keeps me precise, disciplined, and aligned with market narrative, rather than reacting emotionally or chasing price.
💡 My Motto
“Capital management, discipline, and consistency in your trading edge.”
A positive risk-to-reward ratio, combined with a high-probability execution model, is the backbone of any sustainable trading plan 📈🔐
⚠️ On Losses
Losses are part of the mathematical reality of trading 🎲
They don’t define you — they are necessary, expected, and managed.
We acknowledge them, learn, and move forward 📊➡️
🙏 I appreciate you taking the time to review my Daily Forecast.
Further context and supporting material can be found in the Links section.
Stay sharp 🧠
Stay consistent 🎯
Protect your capital 🔐
— FRGNT 🚀📈🔥
TVC:DXY

Q1 | W2 | Y26 AUDUSD — FRGNT WEEK AHEAD FORECAST📅 Q1 | W2 | Y26
📊 AUDUSD — FRGNT WEEK AHEAD FORECAST
🔍 Analysis Approach
I’m applying a developed version of Smart Money Concepts, with a structured focus on:
• Identifying Key Points of Interest (POIs) on Higher Time Frames (HTFs) 🕰️
• Using those POIs to define a clear and controlled trading range 📐
• Refining those zones on Lower Time Frames (LTFs) 🔎
• Waiting for a Break of Structure (BoS) as confirmation ✅
This process keeps me precise, disciplined, and aligned with market narrative, rather than reacting emotionally or chasing price.
💡 My Motto
“Capital management, discipline, and consistency in your trading edge.”
A positive risk-to-reward ratio, combined with a high-probability execution model, is the backbone of any sustainable trading plan 📈🔐
⚠️ On Losses
Losses are part of the mathematical reality of trading 🎲
They don’t define you — they are necessary, expected, and managed.
We acknowledge them, learn, and move forward 📊➡️
🙏 I appreciate you taking the time to review my Daily Forecast.
Further context and supporting material can be found in the Links section.
Stay sharp 🧠
Stay consistent 🎯
Protect your capital 🔐
— FRGNT 🚀📈🔥
FX:AUDUSD


SLPUSDT the major breakout is happening ---> PUMPSLPUSDT is currently trading near a major daily support zone while simultaneously approaching a significant resistance confluence, consisting of both the upper channel boundary and a key descending trendline. A decisive daily close above this combined resistance zone, particularly with a noticeable increase in trading volume, would signal a strong bullish breakout.
In such a scenario, the measured move from the breakout level could project an initial upside target in the range of a 2x–3x advance, with potential for further continuation depending on sustained momentum and market structure alignment.
DISCLAIMER: ((trade based on your own decision))
<<press like👍 if you enjoy💚

Us/Usdt.pBINANCE:USUSDT.P
** BMV:US / USDT (Perpetual)**
🔴 **Key Resistance** at **0.00779** and **0.00963**
🟢 **Immediate Support Zone** between **0.00713 – 0.00702**
🆘 **Major Support** at **0.00681**
📉 Price is **consolidating near lows after a strong sell-off**, showing short-term indecision.
🎯 A **confirmed breakout above 0.00779** could open the path toward **0.00963 → 0.01043**
⚠️ If **0.00702 fails**, price may slide toward **0.00681** quickly.
⚡ **Quick Take:**
* Bearish structure still intact 🐻
* Consolidation at demand zone ⏸️
* Direction depends on **support hold or breakdown 🔓**
* Wait for **volume confirmation 📊** before entering
**Disclaimer:** *For educational purposes only 📚 — not financial advice 💡. Always do your own research and manage risk ⚠️.*

BUY EURJPY 183.9+Euroy looking to fill its gap to the upside and break into a new price because of the new year and new price stay tuned for the update when we reach a new price 184.9+
EXPECTED REAL PRICE :185
Fot the year 2026

EURJPY 184+-185+Eurjpy Buy @ 184.100
TP1 : 184.160
TP2 : 184.222
TP3 : 184.300
TP4 : 184.400
SL : 183.710
Move stop loss to entry 50/50 required
Partials
Wet/UsdtBINANCE:WETUSDT.P
**WET/USDT
🔴 **Immediate Resistance:** **0.20427** (today's high)
🟢 **Nearest Support:** **0.20259** (today's low)
**Key Zones to Watch:**
- **Resistance Above:** 0.21000 → 0.23000 → **0.32369** (major)
- **Support Below:** 0.19491 → **0.17955** (critical)
**Current Action:**
📉 Price at **0.20355**, consolidating in a tight range
📏 Very narrow movement between **0.20259 - 0.20427**
**What’s Next?**
🎯 Break above **0.20427** → could test **0.21000** next
⚠️ Drop below **0.20259** → may fall toward **0.19491**
💡 **Observation:**
Low volatility currently – waiting for a catalyst for the next move.
🔍 *Always verify with your own analysis – this is not financial advice.*

SCALP BTC TRADE Buy bitcoin scalp trade and remember to trail your stops and always take what the market gives you and take partials

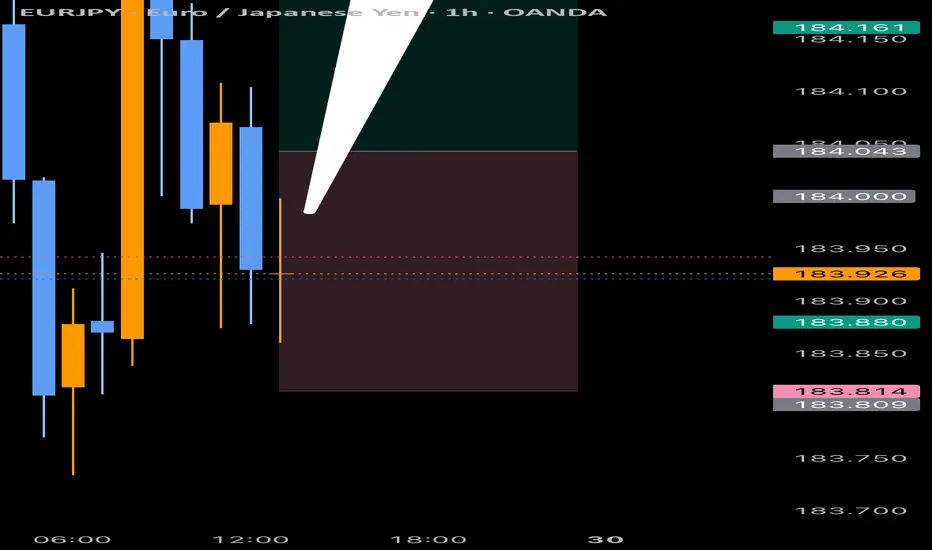
BUY SIGNAL EURJPY 183.8+EURJPY BUY @ 183.808
TP1 : 183.900
TP2 : 183.999
TP3 : 184.000
TP4 : 184.050
SL : 183.400
Remember to trail stop and take partials

PERFECT PROFIT ON EURJPY Eurjpy hit take profit with minimal to no drawdown , so now we can wait for more opportunities to capitalise, more profits and set ups

AUDUSD FRGNT DAILY FORECAST -Q4 | W51 | D16 | Y25 |📅 Q4 | W51 | D16 | Y25 |
📊 AUDUSD FRGNT DAILY FORECAST
🔍 Analysis Approach:
I’m applying Smart Money Concepts, focusing on:
Identifying Points of Interest on the Higher Time Frames (HTFs) 🕰️
Using those POIs to define a clear trading range 📐
Refining those zones on Lower Time Frames (LTFs) 🔎
Waiting for a Break of Structure (BoS) for confirmation ✅
This method allows me to stay precise, disciplined, and aligned with the market narrative, rather than chasing price.
💡 My Motto:
"Capital management, discipline, and consistency in your trading edge."
A positive risk-to-reward ratio, paired with a high win rate, is the backbone of any solid trading plan 📈🔐
⚠️ Losses?
They’re part of the mathematical game of trading 🎲
They don’t define you — they’re necessary, they happen, and we move forward 📊➡️
🙏 I appreciate you taking the time to review my Daily Forecast.
Stay sharp, stay consistent, and protect your capital
— FRNGT 🚀
FX:AUDUSD

BUY EURJPY Eurjpy will be buying and not selling due to structural highs that are missing according to price. EXPECTED PRICE:183+

ETH/USDT.P : LIVE TRADEHello friends
Given the downtrend we have and the power that is in the hands of sellers, we should think about selling for trading.
Now at this stage, we should wait for the price pullback for the entry point, and at that time we can enter, of course, with risk and capital management.
This analysis is purely technically reviewed and is not a buy or sell offer, so do not be emotional and follow capital management.
*Trade safely with us*

SOL/USDT : LIVE TRADEHello friends
considering the downtrend we have and the power of the sellers, we know that we should trade with the trend and be on the side of the one who has the market power.
So, at this stage, when we understand that our trend is down, we are now looking for the entry point that we have identified for you. This area that we have identified is the source of the price drop, which is full of sell orders. If the price pulls back to this area, when the sell orders are activated, they will cause the price to fall again.
This analysis is purely technically reviewed and is not a buy or sell offer, so do not be emotional and follow capital management.
*Trade safely with us*

PROFIT ON EURJPY Eurjpy smashed take profit correctly , and now we shall wait for more opportunities
