BUY AGAIN EURJPYEURYEN buying to the upside and this is a perfect chance to milk the huge move to the upside and make most of profits
Expected Price : 182.6+
Freesignals

B T C U S D <•>BITCOIN Buy stop btcusd , bitcoin looking to give us another push up to correct itself,
TRADING STYLE : Scalp
SAFETY TIPS : (Trial Stop + Partial Close)

BULLS ON EURJPY Eurjpy will be correcting itself to the upside, a scalp can be done , however remember to ( 50/50 + close )
EXPECTED PRICE : 182.6+


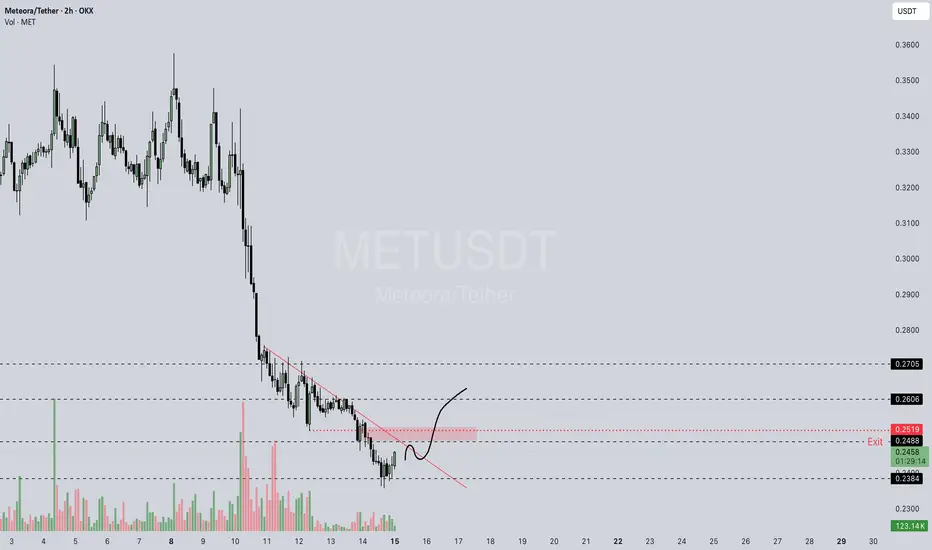
Met/UsdtOKX:METUSDT
### 🌠 MET/USDT (2h) - OKX
**🟢 Price**: 0.2461 (+1.61%)
**📈 High/Low**: 0.2467 / 0.2410
**💰 Order Book**: Sell @ 0.2459 | Buy @ 0.2467
**📊 Volume (MET)**: 1.10K (Very Low)
**🎯 Key Levels**:
* Support: ~0.2153
* Resistance: ~0.2703
**📉🔍 Summary**: Small bullish candle on very low volume. Price is between support and resistance. **Low activity suggests caution.** Watch for a move above 0.2703 (bullish) or below 0.2153 (bearish).
---
⚠️ **Disclaimer**: This is not financial advice. Always do your own research (DYOR). Trading is risky. 📉📈
EURGBP FRGNT WEEKLY FORECAST - Q4 | W51 | Y25 |📅 Q4 | W51 | Y25 |
📊 EURGBP FRGNT WEEKLY FORECAST
🔍 Analysis Approach:
I’m applying Smart Money Concepts, focusing on:
Identifying Points of Interest on the Higher Time Frames (HTFs) 🕰️
Using those POIs to define a clear trading range 📐
Refining those zones on Lower Time Frames (LTFs) 🔎
Waiting for a Break of Structure (BoS) for confirmation ✅
This method allows me to stay precise, disciplined, and aligned with the market narrative, rather than chasing price.
💡 My Motto:
"Capital management, discipline, and consistency in your trading edge."
A positive risk-to-reward ratio, paired with a high win rate, is the backbone of any solid trading plan 📈🔐
⚠️ Losses?
They’re part of the mathematical game of trading 🎲
They don’t define you — they’re necessary, they happen, and we move forward 📊➡️
🙏 I appreciate you taking the time to review my Daily Forecast.
Stay sharp, stay consistent, and protect your capital
— FRNGT 🚀
FX:EURGBP

USDCAD FRGNT WEEKLY FORECAST - Q4 | W51 | Y25 |📅 Q4 | W51 | Y25 |
📊 USDCAD FRGNT WEEKLY FORECAST
🔍 Analysis Approach:
I’m applying Smart Money Concepts, focusing on:
Identifying Points of Interest on the Higher Time Frames (HTFs) 🕰️
Using those POIs to define a clear trading range 📐
Refining those zones on Lower Time Frames (LTFs) 🔎
Waiting for a Break of Structure (BoS) for confirmation ✅
This method allows me to stay precise, disciplined, and aligned with the market narrative, rather than chasing price.
💡 My Motto:
"Capital management, discipline, and consistency in your trading edge."
A positive risk-to-reward ratio, paired with a high win rate, is the backbone of any solid trading plan 📈🔐
⚠️ Losses?
They’re part of the mathematical game of trading 🎲
They don’t define you — they’re necessary, they happen, and we move forward 📊➡️
🙏 I appreciate you taking the time to review my Daily Forecast.
Stay sharp, stay consistent, and protect your capital
— FRNGT 🚀
FX:USDCAD

GBPUSD FRGNT WEEKLY FORECAST - Q4 | W51 | Y25 |📅 Q4 | W51 | Y25 |
📊 GBPUSD FRGNT WEEKLY FORECAST
🔍 Analysis Approach:
I’m applying Smart Money Concepts, focusing on:
Identifying Points of Interest on the Higher Time Frames (HTFs) 🕰️
Using those POIs to define a clear trading range 📐
Refining those zones on Lower Time Frames (LTFs) 🔎
Waiting for a Break of Structure (BoS) for confirmation ✅
This method allows me to stay precise, disciplined, and aligned with the market narrative, rather than chasing price.
💡 My Motto:
"Capital management, discipline, and consistency in your trading edge."
A positive risk-to-reward ratio, paired with a high win rate, is the backbone of any solid trading plan 📈🔐
⚠️ Losses?
They’re part of the mathematical game of trading 🎲
They don’t define you — they’re necessary, they happen, and we move forward 📊➡️
🙏 I appreciate you taking the time to review my Daily Forecast.
Stay sharp, stay consistent, and protect your capital
— FRNGT 🚀
OANDA:GBPUSD

EURUSD FRGNT WEEKLY FORECAST - Q4 | W51 | Y25 |📅 Q4 | W51 | Y25 |
📊 EURUSD FRGNT WEEKLY FORECAST
🔍 Analysis Approach:
I’m applying Smart Money Concepts, focusing on:
Identifying Points of Interest on the Higher Time Frames (HTFs) 🕰️
Using those POIs to define a clear trading range 📐
Refining those zones on Lower Time Frames (LTFs) 🔎
Waiting for a Break of Structure (BoS) for confirmation ✅
This method allows me to stay precise, disciplined, and aligned with the market narrative, rather than chasing price.
💡 My Motto:
"Capital management, discipline, and consistency in your trading edge."
A positive risk-to-reward ratio, paired with a high win rate, is the backbone of any solid trading plan 📈🔐
⚠️ Losses?
They’re part of the mathematical game of trading 🎲
They don’t define you — they’re necessary, they happen, and we move forward 📊➡️
🙏 I appreciate you taking the time to review my Daily Forecast.
Stay sharp, stay consistent, and protect your capital
— FRNGT 🚀
FX:EURUSD

ETH/USDT : LIVE TRADEHello friends
you can see that a spike has formed and then the price has ranged.
Now with a valid breakout from above and a breakout from below, buyers can push the price to the specified points.
This analysis is purely technical and is not a buy or sell recommendation. So please refrain from emotional behavior.
*Trade safely with us*

SOL/USDT : SIGNALHello friends
Given the decline we had and the strength of the sellers, the price has reached the support areas we identified and has been well supported by the buyers in this area and has managed to hit higher lows.
The price is now in an important support area, and if buyers show support from this area, the price could grow and move to the specified targets.
Please note that this analysis is purely technical and does not constitute a buy or sell offer, so do not act emotionally and observe capital management.
*Trade safely with us*

USDJPY: Move Up Confirmed?! 🇺🇸🇯🇵
USDJPY will likely bounce from the underlined intraday support.
A formation of a bullish engulfing candle confirms a buying
imbalance after its test.
The price will rise at least to 156.54
❤️Please, support my work with like, thank you!❤️
I am part of Trade Nation's Influencer program and receive a monthly fee for using their TradingView charts in my analysis.


btc live tradeHello friends
Given the sharp upward movement we had, you can see that the sellers have made a high, which increases the possibility of a price correction, and we can witness a price increase in the price correction until the specified targets are reached.
This analysis is purely from a technical perspective and is not a buy or sell recommendation, so please observe risk and capital management.
*Trade safely with us*

SUI/USDT : LIMITHello friends
As you can see, after the resistance level we set was broken, the price has grown well, and now with this bullish trend, there is a sign of sellers entering, and there is a possibility of price correction, and the price can grow again from these areas and move to our targets.
This analysis is technically reviewed and is not a buy or sell recommendation, so please follow risk and capital management.
*Trade safely with us*

AVAX/USDT : LIVE TRADEHello friends
Considering the decline I had, you can see that the price has been supported in our support area and the price has grown well.
Now, given the good growth we had, we have a high and low, which is a sign of the entry of sellers, and this means that the price will correct to the specified areas, and from there we can again expect the price to grow to the specified targets.
This analysis is technically reviewed and is not a buy or sell recommendation, so please follow risk and capital management.
*Trade safely with us*

At/Usdt.PBINANCE:ATUSDT.P
## 📈🔥 **ATUSDT Quick Update**
Price is holding above the support near **0.1217** and just broke the short-term down-trendline ✔️.
As long as buyers defend this zone, market can build a slow upward structure and attempt higher levels.
If price maintains strength above **0.1305 (local resistance)**, the next targets open up.
## 🎯 **Key Levels**
### 🔵 **Support Zone**
* **0.1217 – 0.1230** (Major support – buyers still active)
* ⚠️ If this breaks, downside liquidity sits lower (your pink zone)
### 🔴 **Resistance Levels**
* **0.1305** → First resistance (needs clean breakout)
* **0.1480** → Next major resistance
* **0.1630** → Strong resistance zone
* **0.1836** → High-timeframe supply zone (big sellers expected)
### 🚀 **Bullish Path**
If price stays above **0.1217** and breaks **0.1305**, we can see a slow climb toward:
➡️ **0.1480**
➡️ **0.1630**
➡️ **0.1836** (major target)
## ⚠️ **Disclaimer**
This is only chart-based analysis — **not financial advice**.
Crypto is volatile. Always manage risk and avoid over-leveraging 🙏.

EURJPY UPWARDS Eurjpy buy stop in place in order to return to previous prices can expect even a new price ( NEW HIGHS )
EXPECTED NEW PRICE : 183.000

BITCOIN MONEY FRIENDS Bitcoin has hit new highs in terms of price and structure it’s been good trading btcusd very easy , all required is patience


BULLS ON EURJPY Eurjpy set buy stops , this pair won’t be dropping anytime soon, it’s perfectly clear and simple to follow
EXPECTED NEW HIGH - 182.500

SOL : LIVE TRADEHello friends
as you can see, after the resistance we set was broken, the price has grown well, and now with this red shadow, there is a sign of sellers entering, and there is a possibility of price correction, and the price can grow again from these areas and move to our targets, of course, if buyers support the support area again...
This analysis is purely from a technical perspective and is not a buy or sell recommendation, so please follow risk and capital management.
*Trade safely with us*

usoil : live tradeHello friends
Well, according to the channel we had, you can see that the sellers broke the specified support with strength and caused the price to fall.
Now, given that it has become clear to us that the power is in the hands of the sellers, we can re-enter the sell trade if the price rebounds or pullbacks in the specified area, of course with the necessary confirmations...
This analysis is purely technical and does not constitute a buy or sell recommendation, so please observe risk and capital management and avoid emotional movements.
*Trade safely with us*
