usoil : live tradeHello friends
Well, according to the channel we had, you can see that the sellers broke the specified support with strength and caused the price to fall.
Now, given that it has become clear to us that the power is in the hands of the sellers, we can re-enter the sell trade if the price rebounds or pullbacks in the specified area, of course with the necessary confirmations...
This analysis is purely technical and does not constitute a buy or sell recommendation, so please observe risk and capital management and avoid emotional movements.
*Trade safely with us*
Freesignals

G O L D B U Y Gold looking to give some nice clear opportunities to the upside by looking at it’s structure , can capitalise on a nice scalp trade , remember to 50/50 the trades and trial

BTC BUY SIGNALBtcusd buy signal , remember to close
( 50/50 ) when in a trade or quick scalping position to avoid hitting stops loss with no rewards , always trial stop as well

EURJPY SUPER BUY RECAPEurjpy has performed as expected and hit
( TAKE PROFIT ), it’s very simple and clear setup and easy to follow

XAUUSD – Rejection From PDH | Price Respecting Demand ZoneGold swept Previous Day High (4258), grabbed buy-side liquidity, and sharply rejected.
Price has now returned to the demand zone around PD Low (4192–4201) where buyers previously stepped in.
Key Observations:
Daily Wick 50% acted as intraday resistance
Strong reaction from weekly liquidity zone above
Bullish recovery forming from demand
Break above 4234 may open path back toward PDH & Weekly High
Bias:
As long as price holds above PD Low, intraday bullish continuation is favored.
A breakdown below the yellow zone shifts bias toward deeper sell-side liquidity.
Levels to Watch:
Resistance: 4234 / 4258 / 4264
Support: 4201 / 4192
Price is rebuilding structure — waiting for confirmation before the next impulse.

USOIL:LIVE TRADEHello friends
you can see that we had a decline and the sellers were in power until the support was determined with Fibonacci, where buyers entered and were able to support the price.
Now, with Fibonacci, we have determined a resistance area for buyers that can move up to there, but considering the main trend, which is negative, the price increase is an opportunity for a sell trade.
Don't forget risk and capital management.
*Trade safely with us*

BNB/USDT : Rise or continue to fall?Hello friends
considering the downtrend we have and we have identified it, you can see that the power is in the hands of the sellers and every high it hits is a selling opportunity.
But there is one point, and that is this triangle that the price has formed. If it continues the trend, it is very likely that the price will fall again to the specified areas.
But if buyers want to break it and push the price up, the story changes and the price pivots we identified become the targets of the buyers who hit them.
This analysis is purely technically reviewed and is not a buy or sell recommendation. Please observe risk and capital management.
*Trade safely with us*

DXY FRGNT Daily Forecast -Q4 | W47| D20 | Y25 |📅 Q4 | W47| D20 | Y25 |
📊 DXY FRGNT Daily Forecast
🔍 Analysis Approach:
I’m applying Smart Money Concepts, focusing on:
Identifying Points of Interest on the Higher Time Frames (HTFs) 🕰️
Using those POIs to define a clear trading range 📐
Refining those zones on Lower Time Frames (LTFs) 🔎
Waiting for a Break of Structure (BoS) for confirmation ✅
This method allows me to stay precise, disciplined, and aligned with the market narrative, rather than chasing price.
💡 My Motto:
"Capital management, discipline, and consistency in your trading edge."
A positive risk-to-reward ratio, paired with a high win rate, is the backbone of any solid trading plan 📈🔐
⚠️ Losses?
They’re part of the mathematical game of trading 🎲
They don’t define you — they’re necessary, they happen, and we move forward 📊➡️
🙏 I appreciate you taking the time to review my Daily Forecast.
Stay sharp, stay consistent, and protect your capital
— FRNGT 🚀
TVC:DXY

BTC SCALP Btcusd looking to give us a nice and simple push to the upside , so I shall scalp this cryptocurrency and take partial profits
BITCOIN BUYBtcusd looking to scalp into a quick trade using a buy stop as bitcoin will have to return to its previous price point, as it cannot sell forever.

BUY STOP EURJPYEurjpy previously missed our orders by a few points and didn’t trigger the trade , however now we shall use a buy stop to make up for the missed trade


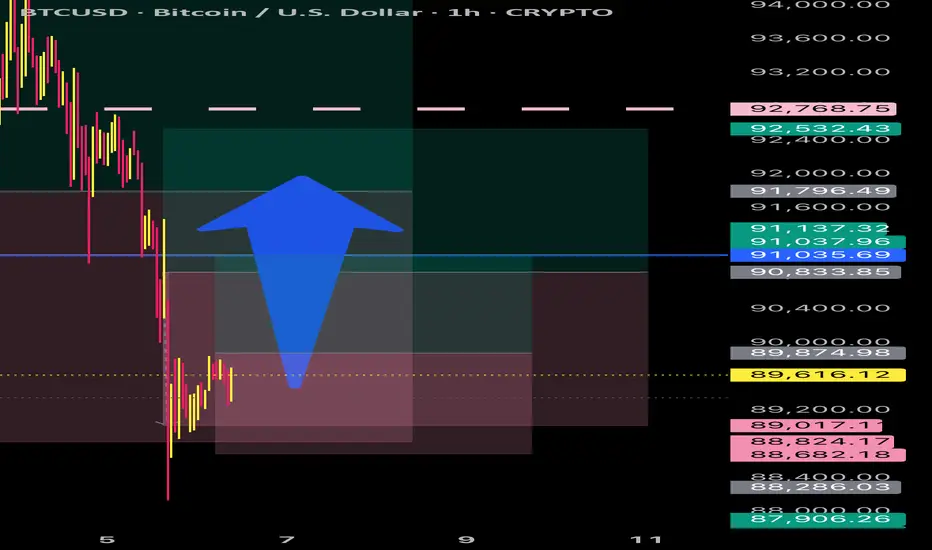
BTC/USDTINDEX:BTCUSD
### Bitcoin / US Dollar — 2h Chart (INDEX)
- **Last Candle Data (approx.)**: Open ~**93,500.02**, current SELL pressure indicated.
- **Volume**: **794** (appears low on scale).
- **Key Price Levels (in USD)**:
- **Resistance Zone**: 99,000 – 97,000
- **Near-term Resistance**: 95,000 – 96,000
- **Current Trading Range**: ~93,000 – 92,300
- **Support Levels**: 91,000 → 90,000 → 87,000 → 85,000
- **Major Support Zone**: 83,000 – 79,000
**Summary**: Bitcoin is trading in the lower half of the displayed range, with immediate support near **92,300–91,000** and resistance around **95,000–96,000**. Volume is relatively low on this timeframe. Watch for a break above 96,000 for bullish momentum or a drop below 91,000 for further downside.
---
**Disclaimer**: This is technical observation, not financial advice. Cryptocurrency trading carries risk. Always do your own research.

Ariaip/usdtGATE:ARIAIPUSDT
📈🔥 **ARIAIP/USDT Market Update**
Price is currently holding strong inside the **0.03780–0.04000 support zone** 🔵.
As long as buyers protect this area, we could see a push toward **0.04500** 🎯.
If momentum continues after that breakout, price may extend toward **0.04680** and eventually the **0.05150 major target** 🚀.
The **0.03850–0.03950 zone is weak and considered risky** ⚠️, so avoid using large position sizes while price is near this area.
---
🎯 **Key Levels**
🔵 **Support Zone:** 0.03780 – 0.04000
⚠️ **Risky Support:** 0.03850 – 0.03950
🔴 **Resistance 1:** 0.04500
🟥 **Resistance 2:** 0.04680
🚀 **Major Target:** 0.05150
---
⚠️ **Disclaimer:**
This is chart-based market analysis, **not financial advice**.
Crypto moves fast — always use proper risk management and do your own research.

RLS/UsdtGATE:RLSUSDT
# 📈🔥 **RLS/USDT Quick Update**
Price is consolidating inside the **0.02200–0.02300** demand zone 🔵.
A clean breakout above the trendline can push price toward **0.02720** 🎯,
and if buyers keep control, next major resistance is **0.03300** 🚀.
If support fails, downside demand sits at **0.01745–0.01800** ⚠️.
---
# 🎯 **Key Levels**
* 🔵 **Support Zone:** 0.02200 – 0.02300
* 🟦 **Support 2:** 0.01745 – 0.01800
* 🔴 **Resistance:** 0.02720
* 🚀 **Major Target:** 0.03300
---
# ⚠️ **Disclaimer:**
*This is chart-based analysis only — not financial advice.
Crypto is highly volatile, always use your own research and risk management.*

Shards/UsdtGATE:SHARDSUSDT
# 📈 **SHARDS/USDT Quick Update**
Price is holding inside the **0.00250–0.00260** demand zone (blue box).
If buyers defend this area, we can see a move toward **0.00304**,
and a breakout above **0.00322** can push price into **0.00347**.
The final upside target is the **0.00400–0.00405** supply zone.
---
# 🎯 **Key Levels**
* **Support Zone:** 0.00250 – 0.00260
* **Mid Resistance:** 0.00304
* **Resistance:** 0.00322
* **Target Zone:** 0.00347
* **Major Supply:** 0.00400 – 0.00405
---
# ⚠️ **Disclaimer:**
*This is only chart-based analysis, not financial advice.
Crypto is highly volatile — always use your own research and risk management.*
S

Lucic/UsdtGATE:LUCICUSDT
**Price is currently taking support around the 0.1730–0.1750 zone.** 🟩
**If this level breaks, the next major support sits at 0.1550.** 🔻
**If price starts moving up, the first resistance will be at 0.2080.** 🔼
**Above that, a strong resistance waits at 0.2683 — a major barrier.** 🧱
**The 0.3418 level is a big supply zone where sellers step in aggressively.** 📉
**And 0.3691 is the level where a real breakout would be confirmed.** 🚀
---
### ⚠️ Disclaimer:
*These are chart-based levels only — not financial advice. Crypto is volatile, always do your own research.* ⚠️📊

ETH : SELL MARKET!!!Hello friends
Well, as you can see, we are in a very strong downtrend and the sellers have full control.
Now, any price increase can be a selling opportunity, until the buyers show strength, we cannot say that the trend has changed...
Of course, we are also at important support and we need to see whether buyers support the price or not. Until then, we will not trade on guesswork and predictions.
This analysis is purely technical and is not a buy or sell recommendation, so please exercise your risk and capital management.
*Trade safely with us*

DOGE/USDT : BUY MARKETHello friends
Well, considering the decline we had, you can see that the price has been well supported by buyers, which has caused the price to increase slightly.
Now it seems that given the good fundamental news on the Dodge and the ascending channel it has created, it can grow.
There is also an important resistance ahead, which if broken, could see the number 19 cents.
This analysis is purely from a technical perspective and is not a buy or sell recommendation. Avoid emotional behavior.
Trade safely with us

TON : SELL LIMIT
Hello friends
considering the downtrend we are in, the power of sellers is quite clear and it is logical that we also move to the strong side, and in this downtrend, any price increase can be a selling opportunity.
So now, considering the buyers' support of the support area identified with Fibonacci, we need to see whether the sellers will enter again in the identified resistance area or not?
If the buyers weaken again in the resistance area, the price can fall to the specified targets.
This analysis is purely technically reviewed and is not a buy or sell recommendation, so do not act emotionally and observe risk and capital management.
*Trade safely with us*

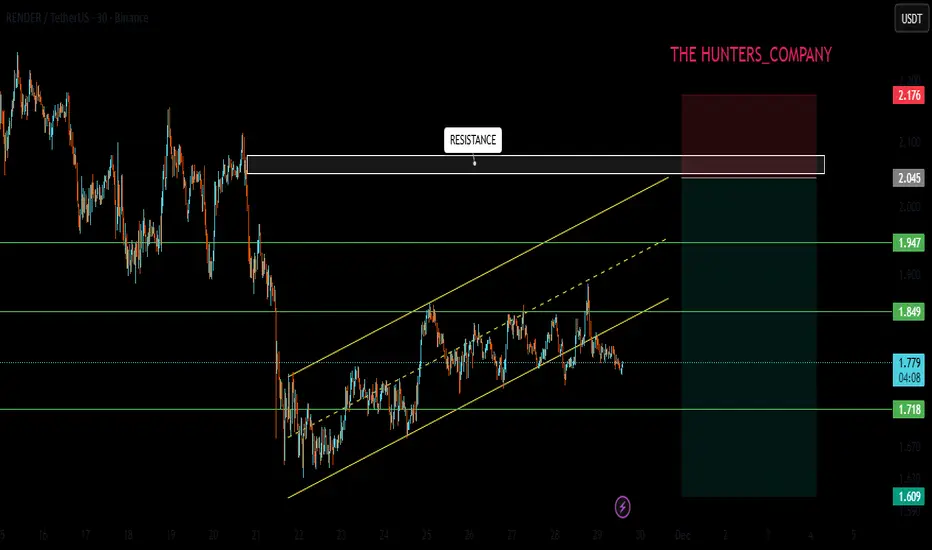
RENDER/USDT : SELL LIMITHello friends
Given the downward trend we are having, you can see that the power is in the hands of the sellers.
Now, if the price reaches the resistance areas, it is a good opportunity to sell. Be careful that if the structure breaks, it is no longer logical to sell.
So we should see the power of the buyers in the resistance area, but most likely we will see a price correction.
This analysis is purely technically reviewed and is not a buy or sell recommendation, so do not act emotionally and observe capital management.
*Trade safely with us*
SUI/USDT : SELL LIMIT
Hello friends
you can see that the price is moving in a range with a slight upward slope, and every time it hits the specified support, the power of buyers decreases, and now, in the last hit that we have identified, it seems that the price will not be able to record a higher ceiling and we will witness a price drop.
This analysis is purely technically reviewed and is not a buy or sell recommendation, so do not act emotionally and observe capital management.
*Trade safely with us*

Bluai/UsdtGATE:BLUAIUSDT
# 📈 **BLUAI/USDT Quick Update**
Price is currently holding the **0.00640–0.00650** support zone.
If this level continues to hold, we can see a bounce towards **0.00694**,
and a breakout above that opens the move into the **0.00722** supply zone.
Major resistance sits higher at **0.00777**.
---
# 🎯 **Key Levels**
* **Support:** 0.00640 – 0.00650
* **Support 2:** 0.00620
* **Resistance:** 0.00694
* **Target Zone:** 0.00722
* **Major Resistance:** 0.00777
---
# ⚠️ **Disclaimer:**
*This is only chart-based analysis, not financial advice.
Crypto is highly volatile — always use your own research and proper risk management.*
