TAKE PROFIT HIT EURYENEurjpy has wonderfully done as expected and we we able to get into a trade and hit take profit , there’s still more to come too , from this structure so can expect more opportunities
Freesignals

META Stock Tip LongHere is our stock signal for NASDAQ:META
Meta Stock Signal
🎉Entry: 597.13
⚠️SL: 482.50
✔️TP1: 732.42
✔️TP2: 911.95
✔️TP3: 1134.37
Don't forget, if you are on a challenge/funded you can trade main stocks
Hope all of our friends in USA have a good holiday
Best
ETAforex

BITCOIN:LIVE TRADEHello friends
considering the decline we had, the sellers made a bottom and the buyers came in. The sellers again broke the previous bottom with strength and made a bottom, and the buyers came in and raised the price and succeeded in hitting a higher ceiling.
And in the pullback, the open price is supported and here we can enter a buy transaction considering the support of buyers and hitting a higher ceiling, of course with risk and capital management and be careful not to make emotional decisions.
*Trade safely with us*

EURJPY BUYEurjpy small scalp within the trend and will now allow it to trigger us into a trade and scalp to the upside

Q4 | W48| D25 | Y25 | - EURGBP FRGNT Daily Forecast📅 Q4 | W48| D25 | Y25 |
📊 EURGBP FRGNT Daily Forecast
🔍 Analysis Approach:
I’m applying Smart Money Concepts, focusing on:
Identifying Points of Interest on the Higher Time Frames (HTFs) 🕰️
Using those POIs to define a clear trading range 📐
Refining those zones on Lower Time Frames (LTFs) 🔎
Waiting for a Break of Structure (BoS) for confirmation ✅
This method allows me to stay precise, disciplined, and aligned with the market narrative, rather than chasing price.
💡 My Motto:
"Capital management, discipline, and consistency in your trading edge."
A positive risk-to-reward ratio, paired with a high win rate, is the backbone of any solid trading plan 📈🔐
⚠️ Losses?
They’re part of the mathematical game of trading 🎲
They don’t define you — they’re necessary, they happen, and we move forward 📊➡️
🙏 I appreciate you taking the time to review my Daily Forecast.
Stay sharp, stay consistent, and protect your capital
— FRNGT 🚀
FX:EURGBP

60 SECOND GBPUSD BREAKDOWN - Q4 | W48 | D24| Y25 |📅 Q4 | W48 | Y25 |
📊 GBPUSD FRGNT BREAKDOWN
🔍 Analysis Approach:
I’m applying Smart Money Concepts, focusing on:
Identifying Points of Interest on the Higher Time Frames (HTFs) 🕰️
Using those POIs to define a clear trading range 📐
Refining those zones on Lower Time Frames (LTFs) 🔎
Waiting for a Break of Structure (BoS) for confirmation ✅
This method allows me to stay precise, disciplined, and aligned with the market narrative, rather than chasing price.
💡 My Motto:
"Capital management, discipline, and consistency in your trading edge."
A positive risk-to-reward ratio, paired with a high win rate, is the backbone of any solid trading plan 📈🔐
⚠️ Losses?
They’re part of the mathematical game of trading 🎲
They don’t define you — they’re necessary, they happen, and we move forward 📊➡️
🙏 I appreciate you taking the time to review my Daily Forecast.
Stay sharp, stay consistent, and protect your capital
— FRNGT 🚀
FX:GBPUSD

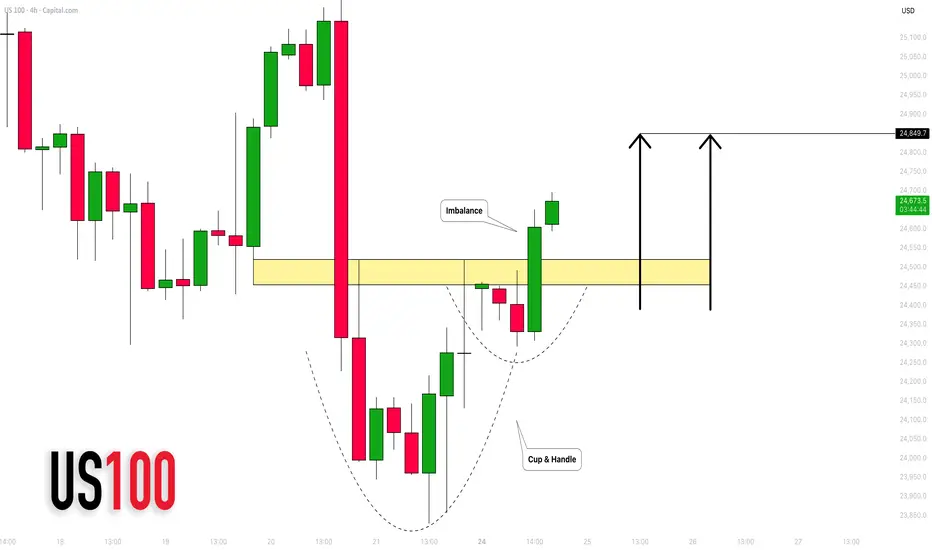
NASDAQ INDEX (US100): Strong Bullish Pattern
There is a high chance that US100 will rise
after a formation of a cup & handle pattern on a 4h time frame
with a breakout of its neckline with a bullish imbalance.
Expect a rise at least to 24850
❤️Please, support my work with like, thank you!❤️
I am part of Trade Nation's Influencer program and receive a monthly fee for using their TradingView charts in my analysis.
AUDUSD FRGNT Daily Forecast -Q4 | W48| D24 | Y25 |📅 Q4 | W48| D24 | Y25 |
📊 AUDUSD FRGNT Daily Forecast
🔍 Analysis Approach:
I’m applying Smart Money Concepts, focusing on:
Identifying Points of Interest on the Higher Time Frames (HTFs) 🕰️
Using those POIs to define a clear trading range 📐
Refining those zones on Lower Time Frames (LTFs) 🔎
Waiting for a Break of Structure (BoS) for confirmation ✅
This method allows me to stay precise, disciplined, and aligned with the market narrative, rather than chasing price.
💡 My Motto:
"Capital management, discipline, and consistency in your trading edge."
A positive risk-to-reward ratio, paired with a high win rate, is the backbone of any solid trading plan 📈🔐
⚠️ Losses?
They’re part of the mathematical game of trading 🎲
They don’t define you — they’re necessary, they happen, and we move forward 📊➡️
🙏 I appreciate you taking the time to review my Daily Forecast.
Stay sharp, stay consistent, and protect your capital
— FRNGT 🚀
OANDA:AUDUSD


BTC BLUE TRADE UPDATE Bitcoin buy update , btcusd has triggered the buy stop and now it’s possible to keep buying the cryptocurrency

BITCOIN TRADE IDEA Waiting for btcusd to buy …will use a buy stop in order to catch the move to the upside as it’s been dropping for soo long and now needs to retest a fair amount to the upside

GOLD UPDATE Gold has been behaving well and it would be best to always close partial profits where necessary to help secure the profits , it has huge potential to the upside to the recent highs

BTC UPDATE Bitcoin has been going up here’s an update, you can close partial profits if necessary to avoid losing profits already made

CC/USDTGATE:CCUSDT
📉 **$Canton (CUSDt) Key Levels**
🔻 **Support:** **0.07520 – 0.07340**
🧱 Price is currently holding this demand area.
🔺 **Resistance 1:** **0.08500 zone**
🧊 First major supply where sellers may step in.
🔺 **Resistance 2:** **0.09850**
🔴 Stronger resistance — previous breakdown level.
🔺 **Resistance 3:** **0.10950**
🚧 Major rejection area on the chart.
---
⚠️ **Disclaimer:**
This is **not financial advice**. Do your own research, manage your risk, and trade safely. 📚💹
---

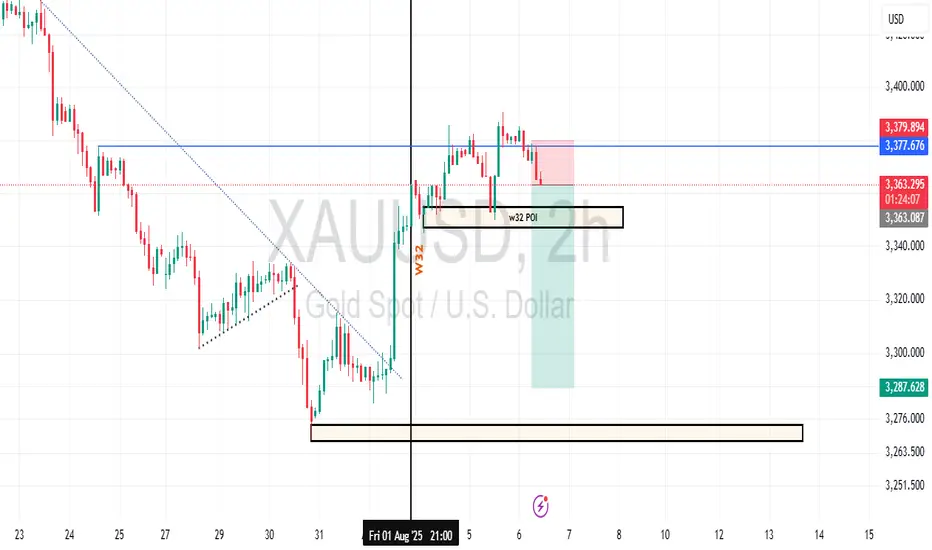
Gold Week 32 Possible reversalGold prices are in a clear downtrend, with critical support at $3,287.628 and resistance at $3,379.874. The 'W32 POI 2H' on Aug 1 highlighted a volatile 2-hour period with a sharp drop and recovery, signaling potential support strength. Fibonacci retracement levels could play a key role in identifying retracement targets. Stay disciplined with risk management as you navigate these levels.
Wbai/UsdtGATE:WBAIUSDT
**🔴 RESISTANCE (Upper Price Barriers)**
🔼 0.017000 - 0.012500: **Major Resistance Band**
**🟡 CRITICAL CONFLICT ZONE**
⚡ **0.009637** - **The Decisive Battle Line**
**🟢 POTENTIAL SUPPORT (Lower Price Foundations)**
🔽 0.012066 - 0.008500: **Potential Support Zone**
*Key levels of interest: 0.011134, 0.010284, 0.009527*
***
**📈 The Narrative:**
Price is navigating between a strong resistance band above and a zone of potential support below. The immediate focus is the critical conflict at **0.009637**.
***
**⚠️ Disclaimer:**
All identified support levels are potential areas of buying interest based on the provided data and **are not confirmed**. They may not hold, and price can break through them. This is not financial advice. Always do your own research.

GOLD HIT TP XAUUSDGold acted well and held on to the structure, will keep trading simple and easy and wait for another opportunity

AUDUSD FRGNT FUN COUPON FRIDAY Forecast - Q4 | W47| D21 | Y25 |📅 Q4 | W47| D21 | Y25 |
📊 AUDUSD FRGNT Daily Forecast
🔍 Analysis Approach:
I’m applying Smart Money Concepts, focusing on:
Identifying Points of Interest on the Higher Time Frames (HTFs) 🕰️
Using those POIs to define a clear trading range 📐
Refining those zones on Lower Time Frames (LTFs) 🔎
Waiting for a Break of Structure (BoS) for confirmation ✅
This method allows me to stay precise, disciplined, and aligned with the market narrative, rather than chasing price.
💡 My Motto:
"Capital management, discipline, and consistency in your trading edge."
A positive risk-to-reward ratio, paired with a high win rate, is the backbone of any solid trading plan 📈🔐
⚠️ Losses?
They’re part of the mathematical game of trading 🎲
They don’t define you — they’re necessary, they happen, and we move forward 📊➡️
🙏 I appreciate you taking the time to review my Daily Forecast.
Stay sharp, stay consistent, and protect your capital
— FRNGT 🚀
OANDA:AUDUSD

LTCUSDT : Full analysisHello friends
well you see that the power is in the hands of the sellers and we must have sufficient approvals to buy.
So you see, we have two important support areas that we have identified for you with Fibonacci, and they can be good supports. We need to see how buyers react in these areas.
Well, the next point is that despite the sharp drop in Bitcoin, Litecoin did not fall much. It fell by almost half of Bitcoin. Considering the previous times I saw that when Bitcoin fell, other currencies fell several times as much, and this is a good sign (meaning that its holders have a positive view of the currency).
But to buy, we need to know where and when to buy, to find the best point to buy and to take our profits at the best point. For this reason, we expect that Litecoin will most likely bottom out again and buy in support areas with risk and capital management and in steps And to move with the specified goals.
*Trade safely with us*

BUY EURJPY UPLooking to buy Eurjpy as it is showing a higher chance to reverse than to drop , this is due to its structure and daily bias price

GOLD HIT TAKE PROFIT Gold has hit take profit and now we wait to target another trade to the upside will post more about the trades that will be taken on gold XAUUSD

BUY LIMIT EURJPYLooking to be buying Eurjpy to it’s recent highs and also will use a buy limit to enter the trade

TRADES PROFITABLE EURJPYWe’ve taken back to back trades on Eurjpy and we’ve maintained a good track record of hitting ( TAKE PROFIT )
