Freetrade


Watching gold play into the buyers handsThat was a spectacular drive by the bulls yesterday. I lost a manual sell order and have a long term buy in that is currently 133 pips in profit at the time of writing this tutorial.
So let me get down to the key points on the table for gold,
# Price is trending bullish so buying is favorable
# Price broke out of a falling wedge pattern to the up side (bullish continuation)
# There is a retracement currently taking place form the recent 1300's high made
* Take into account the 1285 support/resistance level that is indicated with a dotted line
* Take into account that the dotted line is also around the 61.8% Fibonacci retracement level when measuring the last bullish move that commenced at 1160.00 (D1 time frame view)
> Now for price to pull back to the 1285 level +/-
> Then for price action to confirm with a buy signal like a bullish engulfing or hammer etc
If you want to understand the thought process behind identifying these kind of high probability set-ups, then please join my mailing list on www.profitfxza.com
Stick to your trading plan and your profit will stick to you


F#'k YOU... i mean 4Q ;p Purple arrows = resistance
Orange arrows = support
You can see where price has been respecting our zone as support and resistance... its that's time again, price is currently in our zone so we are expecting a bounce and some movement to the upside to end the week with a strong push... Lets make that money for a Saturday night out on the town ;p CHAMPAGNE ANYONE? haha
This trade....LONG!!!!!!!!!!!!!!!!!!!!!!!!!!!!!!!!!!!!!!!!!!!!

GBP USD hitting old resistanceAs you can see from our arrows on the 4h chart that price has touched 1.28802 a number of 17 times just in this chart, this is classed as strong resistance and not to be ignored.
The current 4h candle that is forming is hovering around this resistance level at the moment and has already touched this level and retraced a little, this gives us an indication that it may be used as resistance yet again.
Now we have stated before that there is no need to wait for confirmation candles at such key levels as you may miss out on a good opportunity, so we are in this trade but with a tight SL.
We are looking at further downside movement to around the 1.26230 level and could even break and test 1.25362 support, but remember don't get too greedy when trading as the market will eat you alive!
And ALWAYS use correct RISK MANAGEMENT.

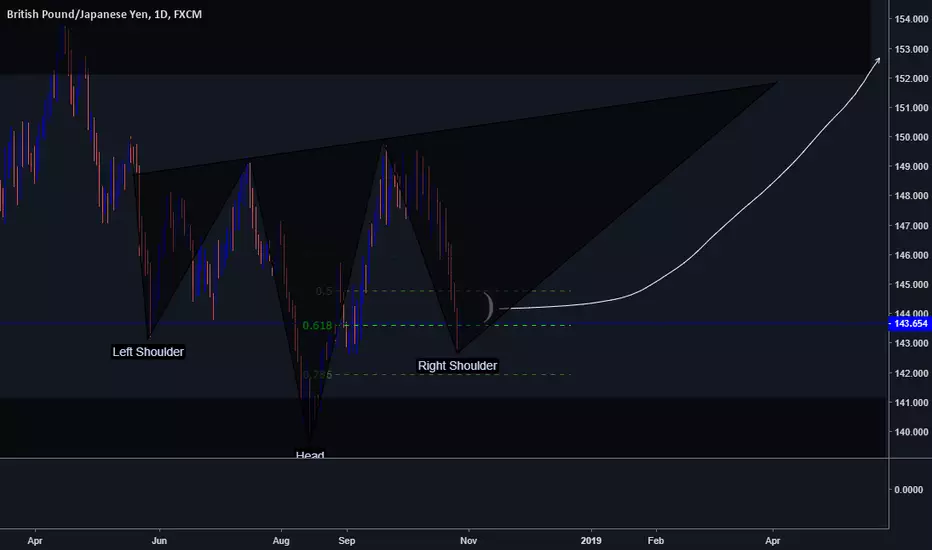
GBPJPY : LONG : DAILY #FREEMONEY #EVERYTIME #LETSRUNITBACKDaddy has been doing this for a while, you can trust me. I haven't completely left forex or anything, I just had to lose my entire life savings in cryptocurrency in order to realize there is no gateway to heaven for an extended amount of time. When crypto opens those legs again I will be there <3 In the meantime GJ is looking too good for me to miss out. If we break this area that we're currently testing we'll be heading to 140 zone, otherwise lets ride this to 150. (Beware of congestion) When you hit profit remember who put you on
EURCHF SHORT TRADE SETUPOn the daily timeframe, price reversed from a weekly resistance (also neckline of higher timeframe H&S pattern) that lined up with the 3rd rejection of descending trend line and broke out of an ascending trendline.
Currently, the price is making a pullback to retest the broken ascending trend line which also lined up with minor resistance zone, 50.0 Fib ratio, and moving averages.
Once price reached and reversed from our confluence level, we will able to go short on this pair after a proper breakout of our Counter Trend Line (CTL).
Kindly follow me on Instagram @TheKissForex.
Thanks for reading!

GBPAUD SHORT TRADE ENTRY AFTER THE BREKOUT OF CTL.This is an update on previous GBPAUD post.
Now the price has broken the CTL and also retested the local S/R level before the breakout.
Now, we are just waiting for this pair to plummet.
Trade responsibly.
Follow @TheKissForex on Instagram for more Forex trading tips.

600 Million ReasonsTrade War or Free Trade? The EU and Japan confirmed on Tuesday (17th July), the largest Bilateral Free Trade Agreement ever, with the new deal covering almost a third of global trade and influencing the lives of over 600 million people. How will this affect the volatility of the EURJPY? Will the Bank of Japan stimulus policy drive volatility? The 10 year Bond Yields certainly think so. Trading Forex / CFDs is High Risk.

USDCAD Swing USDCAD has broken both uptrend lines and we have some solid bearish candle formations on the higher time frame. A sell limit was also tossed in the telegram which has been activated. The trade taken is the setup on this chart

EURUSD time for a pullback ! Or time to start the long rocket ?Hey Traders :)
We think that EURUSD pullback to the last ascending trendline. If not there is a good possibility for a long setup !

EurUsd looking to complete double patterns?EurUsd is on the c-d leg of a double pattern.
Looking for the market to retrace and follow the trendline up

AUDCAD December Technical Analysis: Reversal confirmedTalking Point:
Technical Strategy: Confirming it's bearish outlook
Elliottwave View: Reversal confirmed and counting impulsive waves
Analysis
AUDCAD was trading sideway from Aug-2013. We were seen May-2015 a declined again but unable to takeout Aug-2013 low in impulse manner. We were experienced a bounce from 9170 area in May-2015. However, upside was corrective and can be counted as flat correction in elliott-wave and possibly correction is over on 1.04 zone. With that in mind, we are expecting trend reversal should be taking place and can be seen impulsive declined from 1.04 and possibly we had it's first leg down from 1.04 to 0.9864 and now reversal confirmed from 1.0100 level. Currently we are counting impulsive bearish wave. We are expecting it's minor first leg will be completed soon and can expect small correction towards 1.00. This will provide anyone to join who missed this train.
Action
We are running two short position from 1.01 and 1.004, and for both position we lowered down our stoploss.
-- By Hoagtrading.com (@Hoagtrading)

Identifying Buyers and Sellers!! 1.4166-1.4133 price consolidated and dropped. meaning alot of sellers sold at that area meaning a possible unfilled market orders still in that zone.... an example of this below when price on a daily TF reacted and dropped from my zone 1.4101-1.4081 so i expect the same. i will take profit at 1.38500 and i will move my stop loss into profit once it begins to drop!!! Remember Risk management is key if it violates there is still more opportunity!!!
