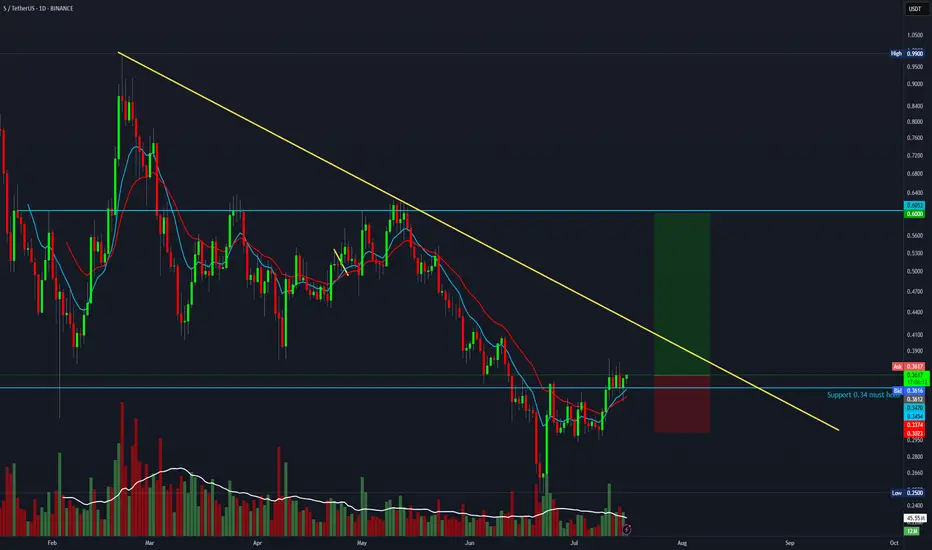
Sonic , the bottom For descriptions jump to previous charts, explained more about the idea that we’re at the bottom and why we might go up , the almost one year of red candles is crazy but that’s the situation with almost all the alts , now if you can’t handle few x to the cellar how do you expect those 10xs ? Lol
Let’s remain calm and observe. Right now we are in a crucial support and I hope it does hold and be a good one and let us go up , it does looks like a break down but as I remember previous cycle breakdowns like this are fake .
FTM

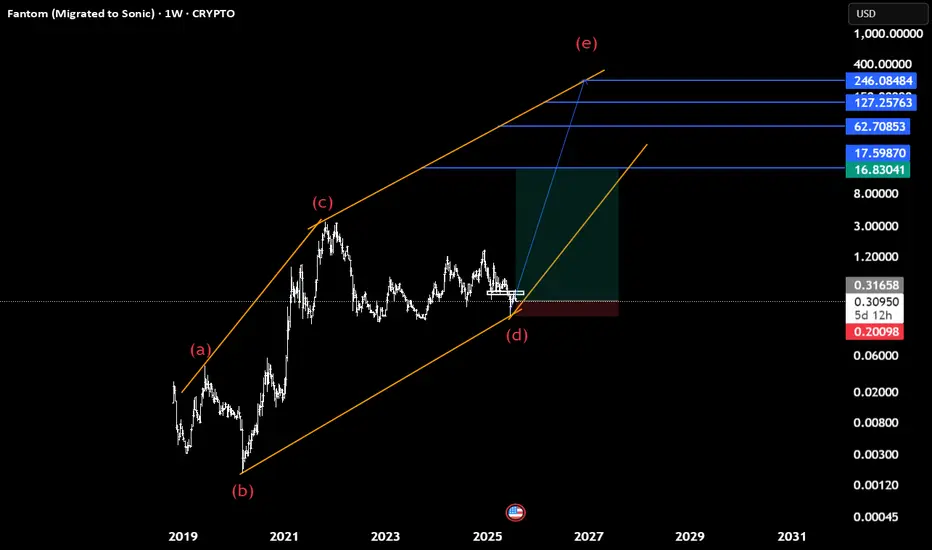
S Roadmap (1W)#SUSDT | #FTMUSDT analysis (1W)
From the point where we placed the red arrow on the chart, the major corrective wave S has begun.
It appears that an ABC pattern has formed on the weekly timeframe, where wave B was a completed diametric structure.
We are now in the large C wave, which is expected to be a long and time-consuming move both in price and duration, likely to complete within the green zone.
This is our outlook on S.
For risk management, please don't forget stop loss and capital management
When we reach the first target, save some profit and then change the stop to entry
Comment if you have any questions
Thank You

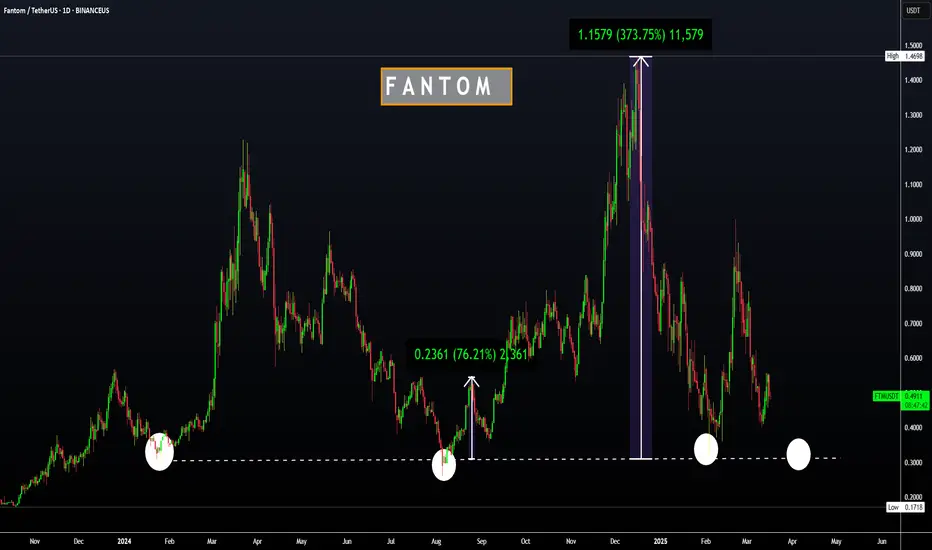
FTM and the 490 risk to reward investment opportunity Hi Everyone;
today we have one of the best risk to reward Investment opportunity
it is more than 490 times the risk and the chart is look very promising.
I expect breaking the previous bear market key point will clear the way to the final target

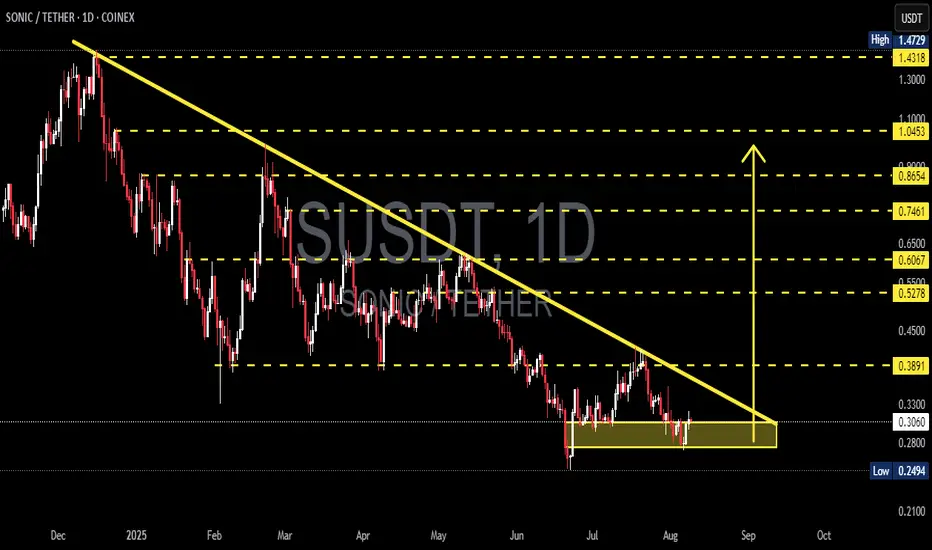
S/USDT The Big Test at the Trendline — Rebound or Rejection?🔎 Overview
The price action of S/USDT remains under pressure from a long-term downtrend, marked by the descending trendline (yellow) that has consistently capped every rally attempt since early this year.
After bouncing from the 0.2219 major low, price has shown a solid rebound and is now testing the critical confluence resistance zone at 0.2984 – 0.31.
This area is a make-or-break level: will buyers manage a breakout to end the seller’s dominance, or will the trendline reject price once again?
---
🧩 Structure & Pattern
1. Descending Trendline
– A clear series of lower highs confirms seller dominance.
– Each rally attempt has been rejected at this line.
2. Key Supports
– 0.2219 → the major swing low and critical downside level.
– Minor support zone: 0.260 – 0.244.
3. Layered Resistances
– 0.2984 (current test) → the first breakout checkpoint.
– 0.3531 – 0.3946 → next upside targets if breakout holds.
– 0.6088 – 0.8650 → major resistance levels, potential rally zone in the mid-term.
---
📈 Bullish Scenario (If Breakout Holds)
Confirmation: Daily close above 0.2984–0.31 with strong volume.
Entry Idea: Buy on retest of the breakout zone.
Upside Targets:
TP1 → 0.3531
TP2 → 0.3946
TP3 → 0.6088
Stop Loss: Below 0.28 (or below the retest low).
Narrative: A breakout from the descending trendline could signal the first step of a trend reversal, opening the path for further bullish momentum.
---
📉 Bearish Scenario (If Rejection Happens)
Confirmation: Bearish rejection candle (engulfing / pinbar) around 0.298–0.31.
Entry Idea: Short/sell after confirmation of rejection.
Downside Targets:
TP1 → 0.260–0.244
TP2 → 0.2219 (major low)
Stop Loss: Above 0.31–0.33.
Narrative: As long as price remains below the trendline, the broader bearish structure is intact. Rejection here may trigger continuation towards the lows.
---
📝 Conclusion
The 0.298–0.31 zone is a major battleground between bulls and bears.
A confirmed breakout could shift momentum towards 0.3531–0.3946.
A rejection, however, keeps downside risk alive with targets back to 0.2219.
Best strategy: Wait for daily close + volume confirmation before committing to major positions.
---
📌 Key Levels to Watch
Support: 0.2884 → 0.260–0.244 → 0.2219
Resistance: 0.2984 → 0.3531 → 0.3946 → 0.6088 → 0.8650
---
#SUSDT #CryptoAnalysis #Altcoin #TechnicalAnalysis #TrendlineBreakout #BearishVsBullish #CryptoTrading #SwingTrade #SupportResistance

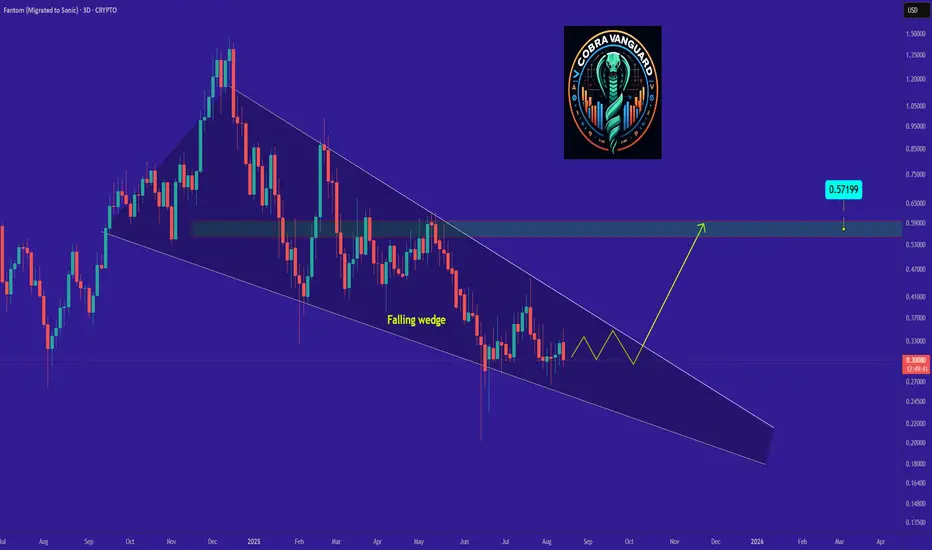
FTM is bullish now and many Traders don't see it !!
So if you pay attention to the FTM chart you can see that the price has formed a Ascending wedge which means it is expected to price move as equal as the measured price movement.( AB=CD )
NOTE: wait for break of the WEDGE .
Best regards CobraVanguard
Sonic (FTM) Technical Outlook: Signs of an Upcoming Breakoutthe price is currently below a dynamic resistance line, but the strength of this line has weakened compared to the past, increasing the likelihood of a breakout.
below the current price, a dynamic support line has formed, preventing the creation of a new price low. additionally, the pivot that led to the lowest low was unsuccessfully broken once. this, along with the fact that the price has been moving within this range over the past two months, serves as a bullish signal.
ichimoku analysis was also used, but is has been removed for chart clarity.
future price targets are: $0.35, $0.60, $1.20, and ultimately $3.00.

SONIC/USDT — Descending Triangle at Key Support!Overview
The daily chart shows a clear medium-term downtrend (well-defined descending trendline) meeting a strong horizontal support zone around 0.25–0.31 USDT (yellow box). Current price ≈ 0.3059 USDT. This structure forms a descending triangle or accumulation range, signaling that the market is in a decision phase — either a bullish breakout or a bearish continuation.
---
Key Levels
Current Price: 0.3059
Support Zone: 0.2494 – 0.305 (historical low at 0.2494)
Descending Trendline Resistance: ~0.33–0.35 (dynamic)
Next Resistances: 0.3891, 0.5278, 0.6067, 0.7461, 0.8654, 1.0453
Breakdown Measured Target: ~0.11 (if 0.2494 breaks)
Potential % moves from current price:
To 0.3891 ≈ +27.2%
To 0.5278 ≈ +72.5%
To 0.2494 ≈ −18.5%
To 0.11 ≈ −64%
---
Pattern & Interpretation
Main Pattern: Descending trendline + horizontal support = descending triangle (bearish bias unless broken to the upside).
Bearish Signal: Lower highs structure, price still under the descending trendline, supply pressure dominant. A daily close below 0.2494 with high volume = breakdown confirmation.
Bullish Signal: Daily close above the trendline (~0.33–0.35) with strong volume, followed by a successful retest = breakout confirmation. Extra confirmation if price breaks and holds above 0.3891.
---
Scenarios
Bullish
1. Break & daily close above trendline (~0.33–0.35) with rising volume.
2. Retest holds as support.
3. Targets: 0.3891 (+~27%), then 0.5278 (+~72%).
4. Stop-loss: below support box (~0.28 or safer < 0.2494).
Bearish
1. Daily close below 0.2494 with strong volume = breakdown.
2. Measured move target ≈ 0.11.
3. Conservative target: psychological zones 0.18–0.15.
4. Stop-loss for shorts: above 0.305–0.33.
---
Trading Notes
Conservative Long: Wait for breakout & retest above trendline.
Aggressive Long: Enter near support (0.26–0.30) with tight stop below 0.2494.
Short: Only after confirmed breakdown below 0.2494.
Always watch daily close + volume to avoid false signals.
---
Conclusion
Current trend is bearish, but the strong 0.25–0.31 support keeps the possibility of a short-term rebound alive.
Decision point: Breakout above 0.35 → bullish rally, Breakdown below 0.2494 → extended sell-off.
Risk management is key — use stop-losses and position sizing.
#SONIC #SONICUSDT #CryptoAnalysis #SupportResistance #DescendingTriangle #Breakout #Altcoin #RiskManagement
Sonic(based on NEo wave)Soon Sonic will start heavy bullish waves to the targets which shown with blue lines.
95% it is a diamnod diametric and we cant consider this as descending triangle because there is no overlap between wave d and a.
Trade setup with a 4:1 R:R for S (formerly FTM)BTC is likely about to continue its move toward 135K — if you're a bull, this is a solid setup with a 4:1 R:R.
Entry: 0.36
Stop Loss: 0.30
Target: 0.60
Sonic pull back - opportunity comingSonic - are we going for a deep pullback?!
If so...
We have confluence for a bonce - MA 200 (4h), Fib 0.618, Diagonal trendline.
I think Sonic cold respond nicely in the area 0.324-0.332 and after that move on for higher target (0.4).

ftmusdt sonicThis is my idea and not a buy recommendation. I'm just waiting for a 20% correction. Leaving this here as a memento

SUSDT 1D AnalysisS ~ 1D Analysis
#S Buy back gradually from here if you still have confidence in this coin with a short term target of at least 15%+ from here.

SONICUSDT 1D Analisis S / SET:SONIC ~ 1D Analisis
#S / #SONIC Buy gradually from here if you still have confidence in this coin with a short term target of at least 10%+ From here.

updateIs Sonic forming an ascending triangle? Sonic is acting confusingly and the market maker is probably planning a big rally after collecting all of Sonic from the public.
S = 55$
SONIC | (Previously Fantom) | HUGE BULLISH PatternFTM has now officially been replaced on most exchange and is now trading as Sonic.
At first we saw an initial drop, typical "sell the news" actions, but now there is a bullish pattern forming in the 4h timeframe.
SONIC is bullish because:
✅ Upwards trendline trading
✅ Higher Lows
✅ Bullish chart pattern: W-Bottom
_______________
BYBIT:SONICUSDT

FTM Delisting | OFICIALLY Becoming SONIC (S)Although a name change for FTM was announced in Aug 2024 already, many exchanges still list FTM, and this will soon change.
It is expected the Fantom will officially be delisted and become SONIC within the next two months.
In August 2024, Sonic Labs announced that they would be replacing Fantom with a new token called Sonic (S). Sonic Labs have confirmed that all existing FTM holders would be able to convert to S at a fixed rate of 1 FTM : 1 S. However, many exchanges will only transfer now, as they will finally be delisting FTM for good and converting all FTM S. This will be done at a conversion rate of 1:1.
_________________________
Make sure you don't miss the latest ETH update, since BTC is likely heading towards a new ATH and ETH stands much more to gain.
_________________
CRYPTO:SONIUSD
POLONIEX:FTMUSDT

ALTCOINS | Alt Season | BUY ZONES1️⃣ATOM / BINANCE:ATOMUSDT
Ideal buy zone is the lower area, unless it CLOSES daily candles above the upper area - then the bottom is likely in and chance for lower entry is slim
2️⃣ Litecoin LTC / BYBIT:LTCUSDT
This likely means a longer wait until ideal entry points, weighted heavier towards the lower zones:
3️⃣ Fantom FTM / BITSTAMP:FTMUSD
Seeing a trendline here that should be noted for a likely buy:
4️⃣ DOGE / BINANCE:DOGEUSDT
DOGE price has not yet begun to trade UNDER moving averages in the weekly either, meaning the bearish cycle is still in early days:
DOGE ideal entry for me would be for accumulation, long-term:

SONICUSDT 12HS / SET:SONIC ~ 12H Analysis
#S / #SONIC Buy after successfully penetrating this resistant line with a short -term target of at least 10%+ from here.

SUSDT 12HS ~ 12H Analysis
#S Buy gradually from here if you still have a Conviction on this coin with a short -term target of at least 10%+.

FTM/USD 1D ChartHello everyone, let's look at the 1D FTM to USD chart, in this situation we can see how the price is moving in a descending triangle where we are approaching the moment of trying to choose the direction in which the price can go further.
Let's start by defining the targets for the near future that the price has to face:
T1 = 0.66 USD
T2 = 0.81 USD
Т3 = 0.93 USD
Now let's move on to the stop-loss in case the market continues to fall:
SL1 = 0.44 USD
SL2 = 0.31 USD
SL3 = 0.21 USD
If we look at the MACD indicator we can see a return to a local downtrend, however we are still in a place where the trend can reverse and surprise us with growth.

ALTS Shine, +55% INCREASE !! FTM | RNDR | Render and Fantom have made steep increases over the past two weeks.
In the past two weeks, FTM increased a whopping 55%:
And RNDR increased around the same amount:
This naturally makes it likely to see a correction soon, which may be the ideal time to get into the accumulation boat - or just for a swing trade.
________________________
GEMINI:RNDRUSD CRYPTO:FTMUSD

FTM | FANTOM | Altcoin with GREAT UPSIDE POTENTIALFTM has recently increased 11% in the weekly, but is making more red candles in the daily and the impulse up seems to be over for now.
Looking at the corrections, from -45% to -80% is not uncommon for Fantom.
The good news, is that the bottom is likely close - and from here, there exists great upside potential.
I am NOT saying we can't fall lower here - infact, a full retracement may be likely, just as we saw the previous cycle. In which case, the upside is even bigger. 30c is indeed a very popular demand zone:
_____________________
BINANCEUS:FTMUSDT
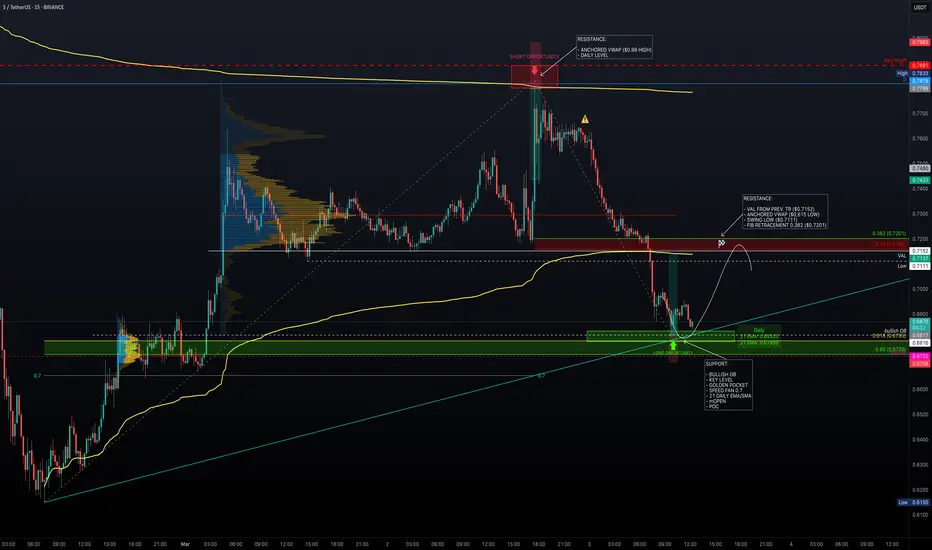
Major Levels – Is Sonic Ready to Pump?After reaching the daily resistance level ($0.7818), price faced strong rejection. The anchored VWAP, acting as dynamic resistance just below the daily level, provided additional confluence for a low-risk short opportunity.
Additionally, a key high at $0.7891 further reinforced this resistance zone. Following the rejection, price sharply declined -13%, retracing back into the previous trading range.
Support Confluence
Price is now approaching a well-defined support zone:
Bullish Order Block: $0.6816
Key Level Near Order Block: $0.6803
Golden Pocket (Fib 0.618 - 0.65): 0.618 at $0.6793 & 0.65 at $0.6739
Monthly Open: $0.6732
Point of Control (POC): $0.6732 (aligning with Monthly Open)
Daily 21 EMA/SMA: 21 EMA at $0.6835 & 21 SMA at $0.6790
Fib Speed Fan 0.7 (from $0.615 to $0.7818): Providing additional support in this zone
Long Trade Setup
Entry Zone: $0.6816 – $0.6732
Stop Loss: Below the Monthly Open ($0.6732)
Take Profit Zone: $0.7111 – $0.7201
Risk-to-Reward (R:R): 3:1 R:R setup, offering a high-probability trade
Take Profit Targets & Resistance Zones
Previous Swing Low: $0.7111 (untested)
Value Area Low (VAL): $0.7152
Anchored VWAP (from $0.615 low): $0.7137
Fib Retracement 0.382 (from $0.7818 high to current low): $0.7201