FT100 THE EU to BREAK UP The chart posted as you can see has ended a 5 waves up and a fib relationship into 1.618 to what looks to be to the TICK I would short all of the EU now ! and look for the USA to have one last advance into FEB cycle peak Due By the 9TH and then the issues for the The EU to start to break apart for most of 2026 . Best of trades WAVETIMER
Ftse100

UK100 (FTSE 100) Bullish Setup | Day & Swing Outlook🔥 Bullish Bias — Tactical Opportunity in UK100 (FTSE 100) 🔥
📌 Asset: UK100 / FTSE 100 Index (largest 100 companies on London Stock Exchange) — benchmark for UK equity sentiment & global cyclicals.
🧠 Setup & Trade Plan
Bullish Plan: Anticipating continuation from value area / liquidity sweep, confirmation of buyers.
Entry: Any favorable price level BUT Thief’s preferred LIMIT LAYER entries (zone stacking) at:
💠 10,160
💠 10,180
💠 10,200
(Precision entries for better R:R — if price respects buyers here, odds tilt bullish.)
Stop-Loss (Thief SL): 📉 10,120
(Adjust according to your risk tolerance — trade safe, manage risk before entries.)
🎯 Profit Target
✔️ Primary Target: 10,350+
Rationale: Potential reaction zone — overlapped resistance, overbought divergences, correlation trap zone — consider partial profit taking. (Not financial advice; scale out with structure.)
🔁 Related Markets / Pairs to Watch
Monitoring correlations can help confirm trend strength and risk sentiment:
👉 GBP/USD
Weak GBP often boosts UK100 performance (many FTSE constituents earn overseas revenues).
Watch for strength/weakness sign changes around key levels.
👉 EUR/GBP & EUR/USD
Can signal broader risk shifts and GBP cross moves. Positive EUR/USD often reflects USD weakness which may align with equity strength.
👉 S&P 500 / US Indices
Global risk sentiment influence — broad equity strength often lifts UK indices.
👉 Gold & Commodities
Risk-off lift in gold might signal equity hesitations — use for context.
📊 Key Technical Notes
✔️ Price zones respected — layered demand strategy adds precision.
✔️ Watch for structural breaks or topping tails on higher TFs for reversal cues.
✔️ RSI / Stoch divergence tools can help confirm entry timing.
🧾 Fundamental & Macro Factors
📅 Upcoming Events That May Influence FTSE 100:
UK economic data (GDP, inflation prints, labour stats) — impact sentiment and monetary stance.
BOE interest rate expectations / policy bias — can shift GBP & equity flows.
Major global macro events (Fed pivots, US job data, China trade cues).
(These drive broader risk flows and can swing indices fast.)
📌 Economic Influence:
UK100 has strong international revenue exposure — GBP weakness often boosts FTSE returns as overseas revenue translates into stronger GBP earnings.
📌 Risk Management Reminder
❗ This idea isn’t financial advice — do your own analysis & size positions according to your personal risk rules. Trade with discipline.
🚀 Thief OG’s — Let’s Swipe Profits, Not Dreams.
🔓 “Every breakout once lived as resistance. Patience picks the lock.”
💎 Stack entry zones, manage risk, take profits — that’s how professionals trade.

FTSE rising trendline support at 10035The FTSE remains in a bullish trend, with recent price action showing signs of a corrective pullback within the broader uptrend.
Support Zone: 10035 – a key level from previous consolidation. Price is currently testing or approaching this level.
A bullish rebound from 10035 would confirm ongoing upside momentum, with potential targets at:
10200 – initial resistance
10255 – psychological and structural level
10310 – extended resistance on the longer-term chart
Bearish Scenario:
A confirmed break and daily close below 10035 would weaken the bullish outlook and suggest deeper downside risk toward:
10010 – minor support
9975 – stronger support and potential demand zone
Outlook:
Bullish bias remains intact while the FTSE holds above 10035. A sustained break below this level could shift momentum to the downside in the short term.
This communication is for informational purposes only and should not be viewed as any form of recommendation as to a particular course of action or as investment advice. It is not intended as an offer or solicitation for the purchase or sale of any financial instrument or as an official confirmation of any transaction. Opinions, estimates and assumptions expressed herein are made as of the date of this communication and are subject to change without notice. This communication has been prepared based upon information, including market prices, data and other information, believed to be reliable; however, Trade Nation does not warrant its completeness or accuracy. All market prices and market data contained in or attached to this communication are indicative and subject to change without notice.

FTSE 100 Maintains Uptrend Structure Within Rising ChannelThe FTSE 100 continues to trade within a well-defined ascending channel, reflecting a broader bullish structure that has been in place for several months. Price remains above both the 50-period and 200-period simple moving averages, with the 50 SMA tracking closely beneath recent candles, suggesting sustained medium-term trend support while the 200 SMA reinforces longer-term bullish conditions.
In the most recent sessions, price action appears to be consolidating near the upper half of the channel, forming a short-term bullish flag or tight consolidation pattern. This behavior often reflects temporary digestion following a strong impulse move rather than a clear trend reversal. The rising channel boundaries remain respected, and no decisive breakdown has occurred so far.
Momentum indicators show mixed but constructive signals. The MACD remains above the zero line, indicating bullish momentum is still present, although the histogram has started to flatten, suggesting some loss of upside momentum in the near term. Meanwhile, RSI is hovering in the low 60s, staying above the neutral 50 level without reaching extreme overbought conditions, which supports the idea of controlled strength rather than exhaustion.
Overall, the technical structure favors a bullish bias while price holds above the channel midline and key moving averages. However, the ongoing consolidation highlights the importance of monitoring momentum and trend structure for confirmation of continuation versus deeper consolidation within the broader uptrend.
-MW

FTSE uptrend continuation supported at 10035The FTSE remains in a bullish trend, with recent price action showing signs of a corrective pullback within the broader uptrend.
Support Zone: 10035 – a key level from previous consolidation. Price is currently testing or approaching this level.
A bullish rebound from 10035 would confirm ongoing upside momentum, with potential targets at:
10200 – initial resistance
10255 – psychological and structural level
10310 – extended resistance on the longer-term chart
Bearish Scenario:
A confirmed break and daily close below 10035 would weaken the bullish outlook and suggest deeper downside risk toward:
10010 – minor support
9975 – stronger support and potential demand zone
Outlook:
Bullish bias remains intact while the FTSE holds above 10035. A sustained break below this level could shift momentum to the downside in the short term.
This communication is for informational purposes only and should not be viewed as any form of recommendation as to a particular course of action or as investment advice. It is not intended as an offer or solicitation for the purchase or sale of any financial instrument or as an official confirmation of any transaction. Opinions, estimates and assumptions expressed herein are made as of the date of this communication and are subject to change without notice. This communication has been prepared based upon information, including market prices, data and other information, believed to be reliable; however, Trade Nation does not warrant its completeness or accuracy. All market prices and market data contained in or attached to this communication are indicative and subject to change without notice.

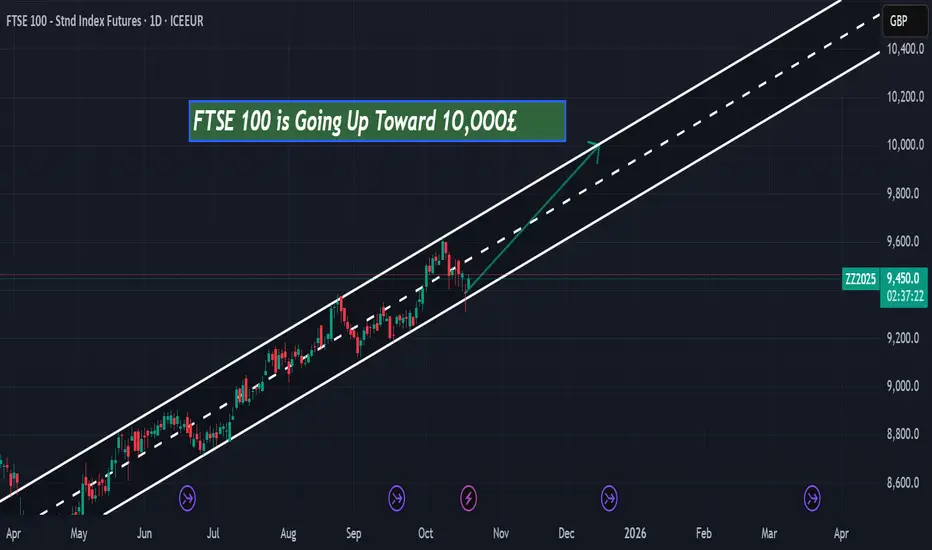
FTSE 100 Outlook: Is the Index on Track to Reach £10,000 by the According to my technical analysis, the FTSE 100 has been moving within a well-defined bullish channel since April 2025. The price structure continues to show higher highs and higher lows, confirming sustained buying pressure and a strong uptrend.
As long as the index remains within this rising channel, the bullish momentum is likely to persist toward the £10,000 level. Based on the current trajectory, this target could be reached in the coming months or by the end of 2025.
FTSE100 sideways consolidation resistance at 10200The FTSE remains in a bullish trend, with recent price action showing signs of a corrective pullback within the broader uptrend.
Support Zone: 10035 – a key level from previous consolidation. Price is currently testing or approaching this level.
A bullish rebound from 10035 would confirm ongoing upside momentum, with potential targets at:
10200 – initial resistance
10255 – psychological and structural level
10310 – extended resistance on the longer-term chart
Bearish Scenario:
A confirmed break and daily close below 10035 would weaken the bullish outlook and suggest deeper downside risk toward:
10010 – minor support
9975 – stronger support and potential demand zone
Outlook:
Bullish bias remains intact while the FTSE holds above 10035. A sustained break below this level could shift momentum to the downside in the short term.
This communication is for informational purposes only and should not be viewed as any form of recommendation as to a particular course of action or as investment advice. It is not intended as an offer or solicitation for the purchase or sale of any financial instrument or as an official confirmation of any transaction. Opinions, estimates and assumptions expressed herein are made as of the date of this communication and are subject to change without notice. This communication has been prepared based upon information, including market prices, data and other information, believed to be reliable; however, Trade Nation does not warrant its completeness or accuracy. All market prices and market data contained in or attached to this communication are indicative and subject to change without notice.

FTSE corrective pullback towards 10035 support?The FTSE remains in a bullish trend, with recent price action showing signs of a corrective pullback within the broader uptrend.
Support Zone: 10035 – a key level from previous consolidation. Price is currently testing or approaching this level.
A bullish rebound from 10035 would confirm ongoing upside momentum, with potential targets at:
10200 – initial resistance
10255 – psychological and structural level
10310 – extended resistance on the longer-term chart
Bearish Scenario:
A confirmed break and daily close below 10035 would weaken the bullish outlook and suggest deeper downside risk toward:
10010 – minor support
9975 – stronger support and potential demand zone
Outlook:
Bullish bias remains intact while the FTSE holds above 10035. A sustained break below this level could shift momentum to the downside in the short term.
This communication is for informational purposes only and should not be viewed as any form of recommendation as to a particular course of action or as investment advice. It is not intended as an offer or solicitation for the purchase or sale of any financial instrument or as an official confirmation of any transaction. Opinions, estimates and assumptions expressed herein are made as of the date of this communication and are subject to change without notice. This communication has been prepared based upon information, including market prices, data and other information, believed to be reliable; however, Trade Nation does not warrant its completeness or accuracy. All market prices and market data contained in or attached to this communication are indicative and subject to change without notice.

FTSE support retest at 10150The FTSE remains in a bullish trend, with recent price action showing signs of a breakout within the broader uptrend.
Support Zone: 10150 – a key level from previous consolidation. Price is currently testing or approaching this level.
A bullish rebound from 10150 would confirm ongoing upside momentum, with potential targets at:
10290 – initial resistance
10350 – psychological and structural level
10417 – extended resistance on the longer-term chart
Bearish Scenario:
A confirmed break and daily close below 10150 would weaken the bullish outlook and suggest deeper downside risk toward:
10083 – minor support
10010 – stronger support and potential demand zone
Outlook:
Bullish bias remains intact while the FTSE holds above 10150. A sustained break below this level could shift momentum to the downside in the short term.
This communication is for informational purposes only and should not be viewed as any form of recommendation as to a particular course of action or as investment advice. It is not intended as an offer or solicitation for the purchase or sale of any financial instrument or as an official confirmation of any transaction. Opinions, estimates and assumptions expressed herein are made as of the date of this communication and are subject to change without notice. This communication has been prepared based upon information, including market prices, data and other information, believed to be reliable; however, Trade Nation does not warrant its completeness or accuracy. All market prices and market data contained in or attached to this communication are indicative and subject to change without notice.

FTSE trend continuation support at 10150The FTSE remains in a bullish trend, with recent price action showing signs of a breakout within the broader uptrend.
Support Zone: 10150 – a key level from previous consolidation. Price is currently testing or approaching this level.
A bullish rebound from 10150 would confirm ongoing upside momentum, with potential targets at:
10290 – initial resistance
10350 – psychological and structural level
10417 – extended resistance on the longer-term chart
Bearish Scenario:
A confirmed break and daily close below 10150 would weaken the bullish outlook and suggest deeper downside risk toward:
10083 – minor support
10010 – stronger support and potential demand zone
Outlook:
Bullish bias remains intact while the FTSE holds above 10150. A sustained break below this level could shift momentum to the downside in the short term.
This communication is for informational purposes only and should not be viewed as any form of recommendation as to a particular course of action or as investment advice. It is not intended as an offer or solicitation for the purchase or sale of any financial instrument or as an official confirmation of any transaction. Opinions, estimates and assumptions expressed herein are made as of the date of this communication and are subject to change without notice. This communication has been prepared based upon information, including market prices, data and other information, believed to be reliable; however, Trade Nation does not warrant its completeness or accuracy. All market prices and market data contained in or attached to this communication are indicative and subject to change without notice.

FTSE 100 – Long-Term Cycle Context (Monthly)The FTSE continues to respect its dominant multi-year cycle, with price currently extended above the cyclical midline following a strong advance.
While momentum remains bullish, price is now entering a zone where cycle timing becomes more important than trend strength. Historically, similar positions within the cycle have preceded mean reversion toward the next cycle low.
No reversal signal yet - but from a cycle perspective, risk is rising as price stretches into the later phase of the oscillation.
Watching for:
• Momentum exhaustion
• Structural weakness
• Cycle rollover confirmation
Educational only, not financial advice.

FTSE uptrend breakout supported at 10084The FTSE remains in a bullish trend, with recent price action showing signs of a breakout within the broader uptrend.
Support Zone: 10084 – a key level from previous consolidation. Price is currently testing or approaching this level.
A bullish rebound from 10084 would confirm ongoing upside momentum, with potential targets at:
10212 – initial resistance
10250 – psychological and structural level
10288 – extended resistance on the longer-term chart
Bearish Scenario:
A confirmed break and daily close below 10084 would weaken the bullish outlook and suggest deeper downside risk toward:
10051 – minor support
10000 – stronger support and potential demand zone
Outlook:
Bullish bias remains intact while the FTSE holds above 10084. A sustained break below this level could shift momentum to the downside in the short term.
This communication is for informational purposes only and should not be viewed as any form of recommendation as to a particular course of action or as investment advice. It is not intended as an offer or solicitation for the purchase or sale of any financial instrument or as an official confirmation of any transaction. Opinions, estimates and assumptions expressed herein are made as of the date of this communication and are subject to change without notice. This communication has been prepared based upon information, including market prices, data and other information, believed to be reliable; however, Trade Nation does not warrant its completeness or accuracy. All market prices and market data contained in or attached to this communication are indicative and subject to change without notice.

FTSE100 trend continuation breakout supported at 10000The FTSE remains in a bullish trend, with recent price action showing signs of a breakout within the broader uptrend.
Support Zone: 10000 – a key level from the previous consolidation. Price is currently testing or approaching this level.
A bullish rebound from 10000 would confirm ongoing upside momentum, with potential targets at:
10160 – initial resistance
10220 – psychological and structural level
10275 – extended resistance on the longer-term chart
Bearish Scenario:
A confirmed break and daily close below 10000 would weaken the bullish outlook and suggest deeper downside risk toward:
9966 – minor support
9920 – stronger support and potential demand zone
Outlook:
Bullish bias remains intact while the FTSE holds above 10000. A sustained break below this level could shift momentum to the downside in the short term.
This communication is for informational purposes only and should not be viewed as any form of recommendation as to a particular course of action or as investment advice. It is not intended as an offer or solicitation for the purchase or sale of any financial instrument or as an official confirmation of any transaction. Opinions, estimates and assumptions expressed herein are made as of the date of this communication and are subject to change without notice. This communication has been prepared based upon information, including market prices, data and other information, believed to be reliable; however, Trade Nation does not warrant its completeness or accuracy. All market prices and market data contained in or attached to this communication are indicative and subject to change without notice.

FTSE100 trend continuation supported at 10000The FTSE remains in a bullish trend, with recent price action showing signs of a breakout within the broader uptrend.
Support Zone: 10000 – a key level from the previous consolidation. Price is currently testing or approaching this level.
A bullish rebound from 10000 would confirm ongoing upside momentum, with potential targets at:
10160 – initial resistance
10220 – psychological and structural level
10275 – extended resistance on the longer-term chart
Bearish Scenario:
A confirmed break and daily close below 10000 would weaken the bullish outlook and suggest deeper downside risk toward:
9966 – minor support
9920 – stronger support and potential demand zone
Outlook:
Bullish bias remains intact while the FTSE holds above 10000. A sustained break below this level could shift momentum to the downside in the short term.
This communication is for informational purposes only and should not be viewed as any form of recommendation as to a particular course of action or as investment advice. It is not intended as an offer or solicitation for the purchase or sale of any financial instrument or as an official confirmation of any transaction. Opinions, estimates and assumptions expressed herein are made as of the date of this communication and are subject to change without notice. This communication has been prepared based upon information, including market prices, data and other information, believed to be reliable; however, Trade Nation does not warrant its completeness or accuracy. All market prices and market data contained in or attached to this communication are indicative and subject to change without notice.

FTSE100 Corrective pullback support at 10000The FTSE remains in a bullish trend, with recent price action showing signs of a breakout within the broader uptrend.
Support Zone: 10000 – a key level from previous consolidation. Price is currently testing or approaching this level.
A bullish rebound from 10000 would confirm ongoing upside momentum, with potential targets at:
10160 – initial resistance
10220 – psychological and structural level
10275 – extended resistance on the longer-term chart
Bearish Scenario:
A confirmed break and daily close below 10000 would weaken the bullish outlook and suggest deeper downside risk toward:
9966 – minor support
9920 – stronger support and potential demand zone
Outlook:
Bullish bias remains intact while the FTSE holds above 10000. A sustained break below this level could shift momentum to the downside in the short term.
This communication is for informational purposes only and should not be viewed as any form of recommendation as to a particular course of action or as investment advice. It is not intended as an offer or solicitation for the purchase or sale of any financial instrument or as an official confirmation of any transaction. Opinions, estimates and assumptions expressed herein are made as of the date of this communication and are subject to change without notice. This communication has been prepared based upon information, including market prices, data and other information, believed to be reliable; however, Trade Nation does not warrant its completeness or accuracy. All market prices and market data contained in or attached to this communication are indicative and subject to change without notice.

FTSE100 corrective pullback support at 9917The FTSE remains in a bullish trend, with recent price action showing signs of a breakout within the broader uptrend.
Support Zone: 9917 – a key level from previous consolidation. Price is currently testing or approaching this level.
A bullish rebound from 9917 would confirm ongoing upside momentum, with potential targets at:
10000 – initial resistance
10050 – psychological and structural level
10080 – extended resistance on the longer-term chart
Bearish Scenario:
A confirmed break and daily close below 9917 would weaken the bullish outlook and suggest deeper downside risk toward:
9900 – minor support
9865 – stronger support and potential demand zone
Outlook:
Bullish bias remains intact while the FTSE holds above 9917. A sustained break below this level could shift momentum to the downside in the short term.
This communication is for informational purposes only and should not be viewed as any form of recommendation as to a particular course of action or as investment advice. It is not intended as an offer or solicitation for the purchase or sale of any financial instrument or as an official confirmation of any transaction. Opinions, estimates and assumptions expressed herein are made as of the date of this communication and are subject to change without notice. This communication has been prepared based upon information, including market prices, data and other information, believed to be reliable; however, Trade Nation does not warrant its completeness or accuracy. All market prices and market data contained in or attached to this communication are indicative and subject to change without notice.

FTSE100 Bullish breakout supported at 9917The FTSE remains in a bullish trend, with recent price action showing signs of a breakout within the broader uptrend.
Support Zone: 9917 – a key level from previous consolidation. Price is currently testing or approaching this level.
A bullish rebound from 9917 would confirm ongoing upside momentum, with potential targets at:
10000 – initial resistance
10050 – psychological and structural level
10080 – extended resistance on the longer-term chart
Bearish Scenario:
A confirmed break and daily close below 9917 would weaken the bullish outlook and suggest deeper downside risk toward:
9900 – minor support
9865 – stronger support and potential demand zone
Outlook:
Bullish bias remains intact while the FTSE holds above 9917. A sustained break below this level could shift momentum to the downside in the short term.
This communication is for informational purposes only and should not be viewed as any form of recommendation as to a particular course of action or as investment advice. It is not intended as an offer or solicitation for the purchase or sale of any financial instrument or as an official confirmation of any transaction. Opinions, estimates and assumptions expressed herein are made as of the date of this communication and are subject to change without notice. This communication has been prepared based upon information, including market prices, data and other information, believed to be reliable; however, Trade Nation does not warrant its completeness or accuracy. All market prices and market data contained in or attached to this communication are indicative and subject to change without notice.

FTSE Bullish continuation supported at 9865FTSE oversold rally resistance at 8820
The FTSE remains in a bullish trend, with recent price action showing signs of a breakout within the broader uptrend.
Support Zone: 9865 – a key level from previous consolidation. Price is currently testing or approaching this level.
A bullish rebound from 9865 would confirm ongoing upside momentum, with potential targets at:
9976 – initial resistance
1000 – psychological and structural level
1050 – extended resistance on the longer-term chart
Bearish Scenario:
A confirmed break and daily close below 9865 would weaken the bullish outlook and suggest deeper downside risk toward:
9830 – minor support
9792 – stronger support and potential demand zone
Outlook:
Bullish bias remains intact while the FTSE holds above 9865. A sustained break below this level could shift momentum to the downside in the short term.
This communication is for informational purposes only and should not be viewed as any form of recommendation as to a particular course of action or as investment advice. It is not intended as an offer or solicitation for the purchase or sale of any financial instrument or as an official confirmation of any transaction. Opinions, estimates and assumptions expressed herein are made as of the date of this communication and are subject to change without notice. This communication has been prepared based upon information, including market prices, data and other information, believed to be reliable; however, Trade Nation does not warrant its completeness or accuracy. All market prices and market data contained in or attached to this communication are indicative and subject to change without notice.

FTSE sideways consolidation capped by resistance at 9900The FTSE remains in a bullish trend, with recent price action showing signs of a breakout within the broader uptrend.
Support Zone: 9750 – a key level from previous consolidation. Price is currently testing or approaching this level.
A bullish rebound from 9750 would confirm ongoing upside momentum, with potential targets at:
9900 – initial resistance
9930 – psychological and structural level
9960 – extended resistance on the longer-term chart
Bearish Scenario:
A confirmed break and daily close below 9750 would weaken the bullish outlook and suggest deeper downside risk toward:
9713 – minor support
9680 – stronger support and potential demand zone
Outlook:
Bullish bias remains intact while the FTSE holds above 9750. A sustained break below this level could shift momentum to the downside in the short term.
This communication is for informational purposes only and should not be viewed as any form of recommendation as to a particular course of action or as investment advice. It is not intended as an offer or solicitation for the purchase or sale of any financial instrument or as an official confirmation of any transaction. Opinions, estimates and assumptions expressed herein are made as of the date of this communication and are subject to change without notice. This communication has been prepared based upon information, including market prices, data and other information, believed to be reliable; however, Trade Nation does not warrant its completeness or accuracy. All market prices and market data contained in or attached to this communication are indicative and subject to change without notice.

FTSE Corrective pullback support at 9750The FTSE remains in a bullish trend, with recent price action showing signs of a breakout within the broader uptrend.
Support Zone: 9750 – a key level from previous consolidation. Price is currently testing or approaching this level.
A bullish rebound from 9750 would confirm ongoing upside momentum, with potential targets at:
9900 – initial resistance
9930 – psychological and structural level
9960 – extended resistance on the longer-term chart
Bearish Scenario:
A confirmed break and daily close below 9750 would weaken the bullish outlook and suggest deeper downside risk toward:
9713 – minor support
9680 – stronger support and potential demand zone
Outlook:
Bullish bias remains intact while the FTSE holds above 9750. A sustained break below this level could shift momentum to the downside in the short term.
This communication is for informational purposes only and should not be viewed as any form of recommendation as to a particular course of action or as investment advice. It is not intended as an offer or solicitation for the purchase or sale of any financial instrument or as an official confirmation of any transaction. Opinions, estimates and assumptions expressed herein are made as of the date of this communication and are subject to change without notice. This communication has been prepared based upon information, including market prices, data and other information, believed to be reliable; however, Trade Nation does not warrant its completeness or accuracy. All market prices and market data contained in or attached to this communication are indicative and subject to change without notice.

FTSE Bullish sideways consolidation supported at 9750The FTSE remains in a bullish trend, with recent price action showing signs of a breakout within the broader uptrend.
Support Zone: 9750 – a key level from previous consolidation. Price is currently testing or approaching this level.
A bullish rebound from 9750 would confirm ongoing upside momentum, with potential targets at:
9900 – initial resistance
9930 – psychological and structural level
9960 – extended resistance on the longer-term chart
Bearish Scenario:
A confirmed break and daily close below 9750 would weaken the bullish outlook and suggest deeper downside risk toward:
9713 – minor support
9680 – stronger support and potential demand zone
Outlook:
Bullish bias remains intact while the FTSE holds above 9750. A sustained break below this level could shift momentum to the downside in the short term.
This communication is for informational purposes only and should not be viewed as any form of recommendation as to a particular course of action or as investment advice. It is not intended as an offer or solicitation for the purchase or sale of any financial instrument or as an official confirmation of any transaction. Opinions, estimates and assumptions expressed herein are made as of the date of this communication and are subject to change without notice. This communication has been prepared based upon information, including market prices, data and other information, believed to be reliable; however, Trade Nation does not warrant its completeness or accuracy. All market prices and market data contained in or attached to this communication are indicative and subject to change without notice.

UK100 Ready for 10,000? Bullish Swing Setup Explained🔹 UK100 (FTSE 100) Index — Swing Trade Opportunity Guide
Asset: UK100 Index
Market Type: Indices
Trade Style: Swing Trade
📊 Market Bias
Trend Direction: 🟢 Bullish
Bullish structure confirmed with a HULL Moving Average + Triangular Moving Average pullback, indicating trend continuation after healthy retracement.
🎯 Trade Plan
Strategy: Trend-following pullback continuation
Entry Plan:
👉 Any price level entry allowed
👉 Layered entry approach (Thief Layering Strategy)
Buy Limit Layer Zones:
• 9700
• 9750
• 9800
(You may increase or adjust layers based on your own risk plan)
This layered approach helps optimize average entry during volatility without chasing price.
🛑 Risk Management
Stop Loss: 9650
⚠️ Dear Ladies & Gentlemen (Thief OG’s),
This stop loss is not mandatory. Adjust SL according to your personal risk management and strategy rules.
🎯 Profit Plan
Primary Target: 10000
📌 Reasoning:
• Strong resistance zone
• Overbought conditions expected
• Potential trap & corrective reaction near highs
⚠️ Dear Ladies & Gentlemen (Thief OG’s),
This TP is for guidance only. Partial profits and manual exits are encouraged based on price action.
🔗 Related Markets to Watch (Correlation Guide)
💵 USD Index (DXY)
• Weakness in DXY often supports global equity indices
• Risk-on sentiment favors UK100 upside continuation
🇺🇸 US30 / NAS100
• Strong US indices usually provide positive sentiment spillover
• Bullish continuation in US equities supports FTSE strength
🛢️ Brent Crude (UKOIL)
• UK100 has heavy energy exposure
• Rising oil prices can boost FTSE components
🏦 GBP/USD
• Extreme GBP strength may cap FTSE upside
• Mild GBP weakness is generally supportive for UK exporters
🧠 Final Notes
✔ Trend-following setup
✔ Layered risk-controlled entries
✔ Structure-based SL
✔ Resistance-aware profit planning
📌 Trade smart. Manage risk. Let the trend pay.

FTSE Bullish breakout supported at 9750
The FTSE remains in a bullish trend, with recent price action showing signs of a breakout within the broader uptrend.
Support Zone: 9750 – a key level from previous consolidation. Price is currently testing or approaching this level.
A bullish rebound from 9750 would confirm ongoing upside momentum, with potential targets at:
9900 – initial resistance
9930 – psychological and structural level
9960 – extended resistance on the longer-term chart
Bearish Scenario:
A confirmed break and daily close below 9750 would weaken the bullish outlook and suggest deeper downside risk toward:
9713 – minor support
9680 – stronger support and potential demand zone
Outlook:
Bullish bias remains intact while the FTSE holds above 9750. A sustained break below this level could shift momentum to the downside in the short term.
This communication is for informational purposes only and should not be viewed as any form of recommendation as to a particular course of action or as investment advice. It is not intended as an offer or solicitation for the purchase or sale of any financial instrument or as an official confirmation of any transaction. Opinions, estimates and assumptions expressed herein are made as of the date of this communication and are subject to change without notice. This communication has been prepared based upon information, including market prices, data and other information, believed to be reliable; however, Trade Nation does not warrant its completeness or accuracy. All market prices and market data contained in or attached to this communication are indicative and subject to change without notice.
